Markets
Ranked: The Most Popular Fast Food Brands in America


Ranked: The Most Popular Fast Food Brands in America
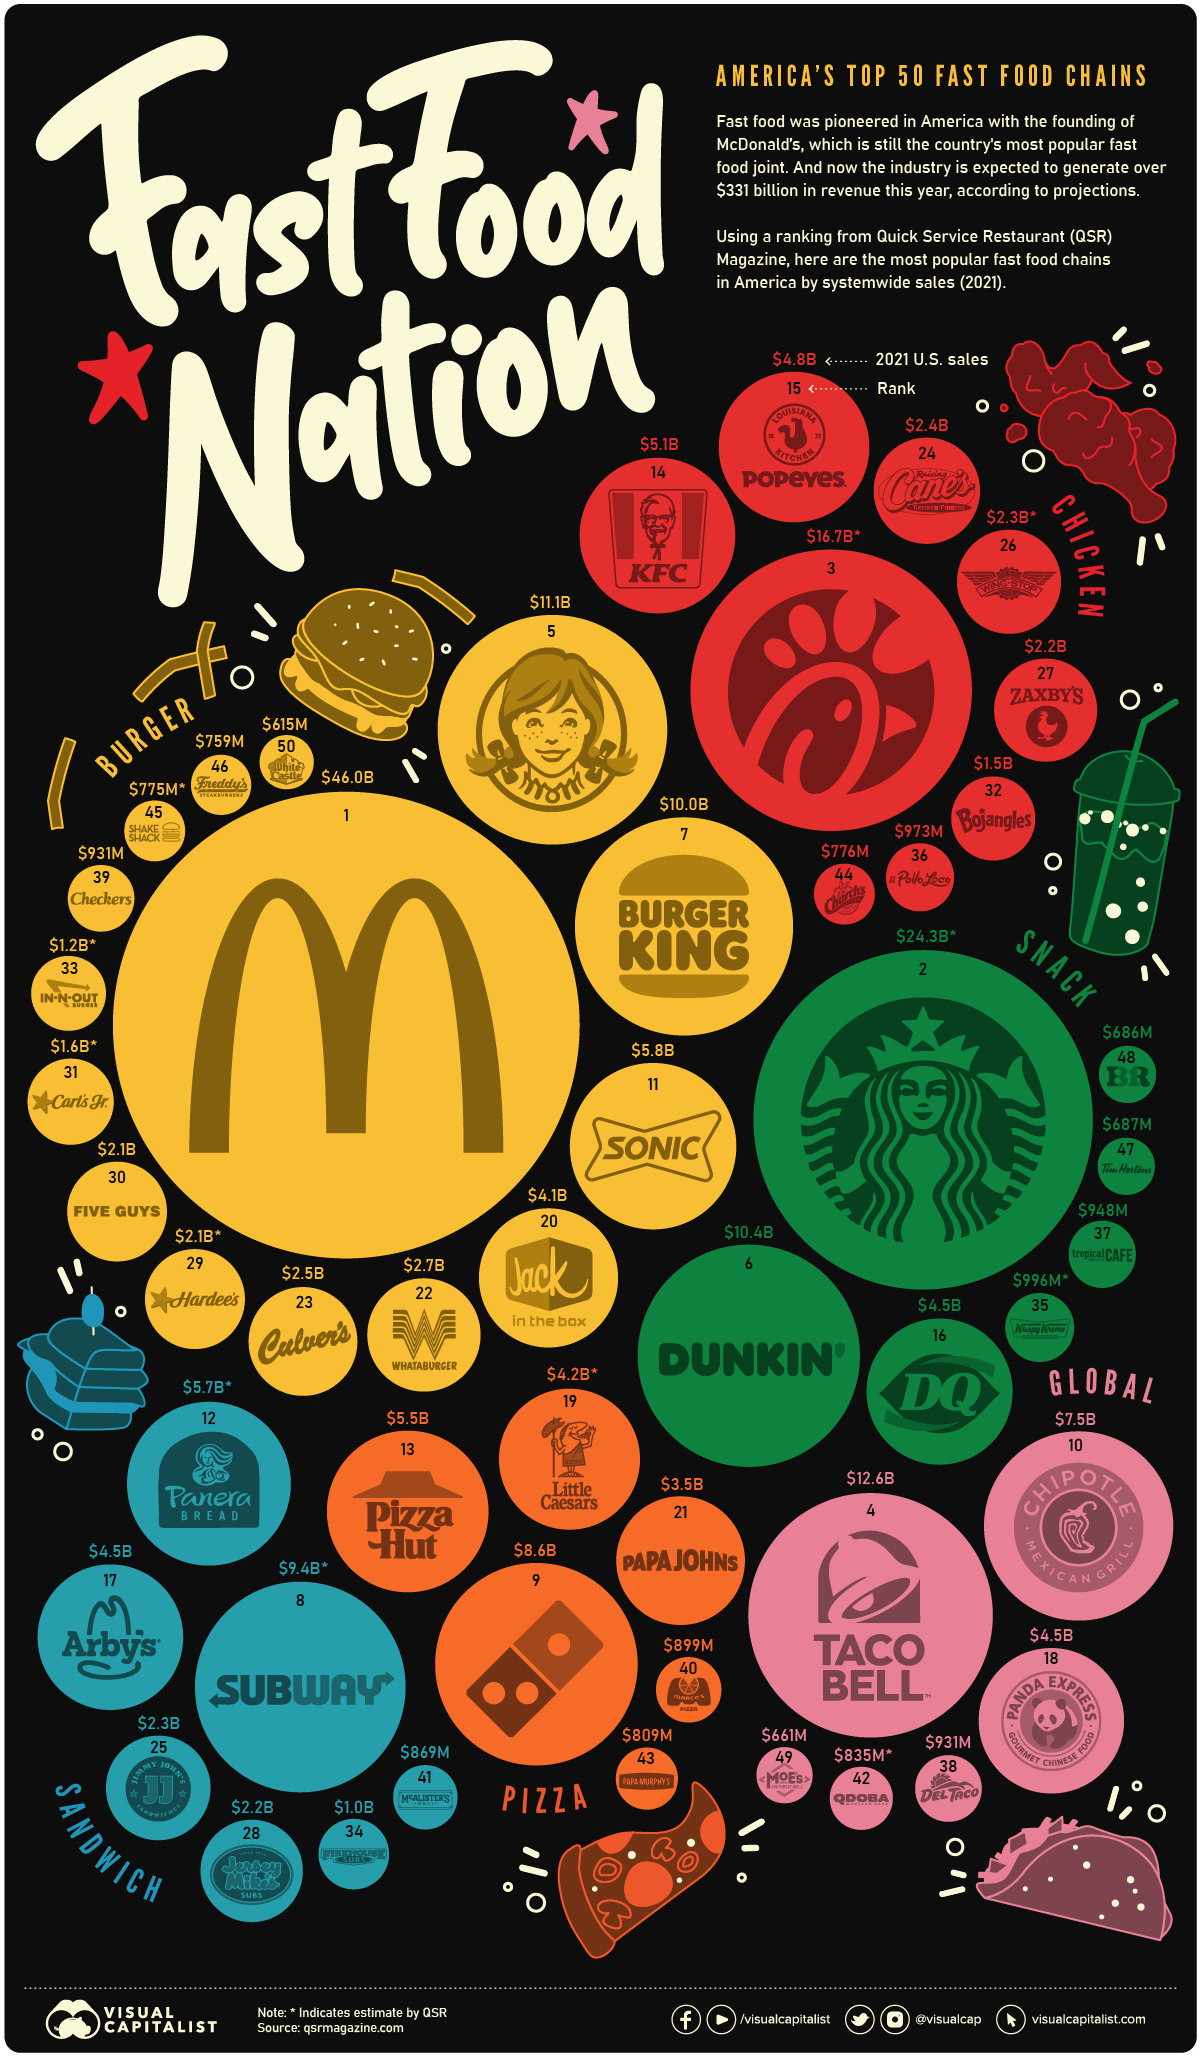
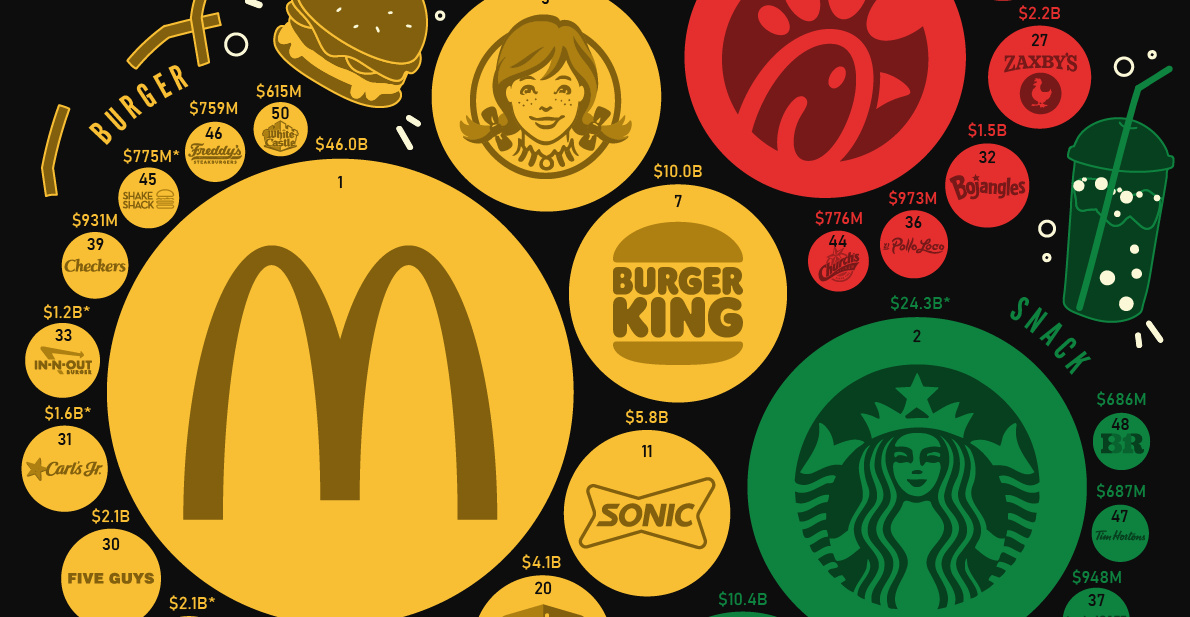
Ever since the McDonald brothers created the concept of fast food in 1940, the restaurant’s golden arches have continued to beckon customers to its quick, cheap, and tasty meals.
McDonald’s is still the most popular fast food brand in America today—with $46 billion in systemwide sales last year.
This graphic uses data from a report on America’s top 50 fast food chains by Quick Service Restaurant (QSR) Magazine. The popular brands are sized by their 2021 systemwide sales and broken down into six broad categories: Burger, Chicken, Snack, Pizza, Sandwich, and Global.
Note: a number of these figures are estimates. Unofficial figures are noted in the graphic with an asterisk.
The Most Popular Fast Food Companies
It’s indisputable that McDonald’s is America’s favorite fast food restaurant, if not the world’s. McDonald’s sales are almost double the second the place restaurant’s, Starbucks—totaling $46 billion compared to the coffee shop’s $24 billion.
Here’s a closer look at the numbers:
| Rank | Company | Systemwide Sales (2021) | Category |
|---|---|---|---|
| #1 | McDonald's | $46.0 billion | Burger |
| #2 | Starbucks | $24.3 billion | Snack |
| #3 | Chick-fil-A | $16.7 billion | Chicken |
| #4 | Taco Bell | $12.6 billion | Global |
| #5 | Wendy's | $11.1 billion | Burger |
| #6 | Dunkin' | $10.4 billion | Snack |
| #7 | Burger King | $10.0 billion | Burger |
| #8 | Subway | $9.4 billion | Sandwich |
| #9 | Domino's | $8.6 billion | Pizza |
| #10 | Chipotle | $7.5 billion | Global |
| #11 | Sonic Drive-In | $5.8 billion | Burger |
| #12 | Panera Bread | $5.7 billion | Sandwich |
| #13 | Pizza Hut | $5.5 billion | Pizza |
| #14 | KFC | $5.1 billion | Chicken |
| #15 | Popeyes Louisiana Kitchen | $4.8 billion | Chicken |
| #16 | Dairy Queen | $4.5 billion | Snack |
| #17 | Arby's | $4.5 billion | Sandwich |
| #18 | Panda Express | $4.5 billion | Global |
| #19 | Little Caesars | $4.2 billion | Pizza |
| #20 | Jack in the Box | $4.1 billion | Burger |
| #21 | Papa Johns | $3.5 billion | Pizza |
| #22 | Whataburger | $2.7 billion | Burger |
| #23 | Culver's | $2.5 billion | Burger |
| #24 | Raising Caine's | $2.4 billion | Chicken |
| #25 | Jimmy John's | $2.3 billion | Sandwich |
| #26 | Wingstop | $2.3 billion | Chicken |
| #27 | Zaxby's | $2.2 billion | Chicken |
| #28 | Jersey Mike's | $2.2 billion | Sandwich |
| #29 | Hardee's | $2.1 billion | Burger |
| #30 | Five Guys | $2.1 billion | Burger |
| #31 | Carl's Jr. | $1.6 billion | Burger |
| #32 | Bojangles | $1.5 billion | Chicken |
| #33 | In-N-Out Burger | $1.2 billion | Burger |
| #34 | Firehouse Subs | $1.0 billion | Sandwich |
| #35 | Krispy Kreme | $996 million | Snack |
| #36 | Pel Pollo Loco | $973 million | Chicken |
| #37 | Tropical Smoothie Cafe | $948 million | Snack |
| #38 | Del Taco | $931 million | Global |
| #39 | Checkers/Rally's | $931 million | Burger |
| #40 | Marco's Pizza | $899 million | Pizza |
| #41 | McAlister's Deli | $869 million | Sandwich |
| #42 | Qdoba | $835 million | Global |
| #43 | Papa Murphy's | $809 million | Pizza |
| #44 | Church's Chicken | $776 million | Chicken |
| #45 | Shake Shack | $775 million | Burger |
| #46 | Freddy's Frozen Custard & Steakburger | $759 million | Burger |
| #47 | Tim Hortons | $687 million | Snack |
| #48 | Baskin-Robbins | $686 million | Snack |
| #49 | Moe's | $661 million | Global |
| #50 | White Castle | $615 million | Burger |
Most of the top 20 restaurants are extremely well known, like Chick-fil-A in third place and Taco Bell in fourth. Some of these chains, however, will be unrecognizable depending on which part of the U.S. you live in. While Bojangles is ubiquitous in the Southeast, for example, many on the West Coast may have never heard of it.
Some of the lower ranking restaurants include Shake Shack (#45), White Castle (#50), and the Canadian-founded Tim Hortons (#47).
Fast Food Industry Trends
America’s fast food industry is expected to generate $331 billion in sales in 2022, and many restaurants are capitalizing on trends shaped in part by the pandemic.
Fast food companies are already somewhat ideal for pandemic conditions with drive-thrus, fast service, and a model that doesn’t encourage sitting down to eat.
Looking to the future, Starbucks, for example, has claimed 90% of its new stores will feature drive-thrus. Digital sales and transactions that limit contact, making fast food even more quick and convenient, are growing as well. Starbucks’ mobile order service has grown 400% over the last five years. And in 2021, the delivery side of their business grew 30% year-over-year, according to the QSR report.
Additionally, the report featured 50 up-and-coming fast food companies to watch in the industry. Here’s a look:
| Rank | Company | Systemwide Sales (2021) | Category |
|---|---|---|---|
| #1 | Smoothie King | $602 million | Snack |
| #2 | Habit Burger | $600 million | Burger |
| #3 | Auntie Anne's | $576 million | Snack |
| #4 | Captain D's | $567 million | Seafood |
| #5 | Steak 'N' Shake | $539 million | Burger |
| #6 | Portillo's | $526 million | Snack |
| #7 | Jamba | $505 million | Snack |
| #8 | Schlotzsky's | $332 million | Sandwich |
| #9 | Krystal | $323 million | Burger |
| #10 | Fazoli's | $298 million | Global |
| #11 | Pizza Ranch | $279 million | Pizza |
| #12 | Scooter's Coffee | $263 million | Snack |
| #13 | Penn Station | $258 million | Sandwich |
| #14 | Chicken Salad Chick | $255 million | Chicken |
| #15 | Mountain Mike's | $254 million | Pizza |
| #16 | Smashburger | $253 million | Burger |
| #17 | Cinnabon | $224 million | Snack |
| #18 | Wetzel's | $219 million | Snack |
| #19 | Donatos | $211 million | Pizza |
| #20 | Newk's | $208 million | Sandwich |
| #21 | Bonchon | $173 million | Chicken |
| #22 | Waba Grill | $170 million | Global |
| #23 | The Human Bean | $109 million | Snack |
| #24 | Capriotti's | $108 million | Sandwich |
| #25 | Great Harvest Bread Company | $108 million | Sandwich |
| #26 | Teriyaki Madness | $90 million | Global |
| #27 | Roy Rogers | $82 million | Burger |
| #28 | Pizza Guys | $79 million | Pizza |
| #29 | Mooyah | $71 million | Burger |
| #30 | Salsarita's | $68 million | Global |
| #31 | Dog Haus | $67 million | Snack |
| #32 | Gold Star | $61 million | Burger |
| #33 | Hawaiian Bros | $55 million | Global |
| #34 | Honeygrow | $55 million | Global |
| #35 | Robeks | $50 million | Snack |
| #36 | PJ’s Coffee of New Orleans | $46 million | Snack |
| #37 | Kolache Factory | $46 million | Snack |
| #38 | Juice it Up! | $43 million | Snack |
| #39 | Happy Joe's | $38 million | Pizza |
| #40 | Rusty Taco | $35 million | Global |
| #41 | Wing Zone | $34 million | Chicken |
| #42 | Swig | $29 million | Snack |
| #43 | Pickleman's | $29 million | Sandwich |
| #44 | Killer Burger | $17 million | Burger |
| #45 | Wing Snob | $15 million | Chicken |
| #46 | Sobol | $13 million | Global |
| #47 | Bad Ass Coffee of Hawaii | $12 million | Snack |
| #48 | Asian Box | $11 million | Global |
| #49 | Sauce on the Side | $9 million | Global |
| #50 | Mici Italian | $6 million | Global |
Some of these are well-established fast food joints that are simply growing their sales, like Cinnabon, while others are newer to the scene.
America’s Favorite Fast Food
Using the ranking’s food categories, we calculated the total sales in each category from the top 50 to figure out which foods are America’s favorites. The winner is evidently burgers, with $92.2 billion in collective sales. Here’s a look at the breakdown:
| Rank | Food Category | Category Cumulative Sales |
|---|---|---|
| #1 | Burger | $92.2 billion |
| #2 | Snack | $42.5 billion |
| #3 | Chicken | $36.7 billion |
| #4 | Global | $27.0 billion |
| #5 | Sandwich | $25.9 billion |
| #6 | Pizza | $23.5 billion |
Sales at Burger restaurants were more than double the runner-up, which was Snacks. After all, nothing is more American than a classic hamburger and fries.


Economy
Economic Growth Forecasts for G7 and BRICS Countries in 2024
The IMF has released its economic growth forecasts for 2024. How do the G7 and BRICS countries compare?


G7 & BRICS Real GDP Growth Forecasts for 2024
The International Monetary Fund’s (IMF) has released its real gross domestic product (GDP) growth forecasts for 2024, and while global growth is projected to stay steady at 3.2%, various major nations are seeing declining forecasts.
This chart visualizes the 2024 real GDP growth forecasts using data from the IMF’s 2024 World Economic Outlook for G7 and BRICS member nations along with Saudi Arabia, which is still considering an invitation to join the bloc.
Get the Key Insights of the IMF’s World Economic Outlook
Want a visual breakdown of the insights from the IMF’s 2024 World Economic Outlook report?
This visual is part of a special dispatch of the key takeaways exclusively for VC+ members.
Get the full dispatch of charts by signing up to VC+.
Mixed Economic Growth Prospects for Major Nations in 2024
Economic growth projections by the IMF for major nations are mixed, with the majority of G7 and BRICS countries forecasted to have slower growth in 2024 compared to 2023.
Only three BRICS-invited or member countries, Saudi Arabia, the UAE, and South Africa, have higher projected real GDP growth rates in 2024 than last year.
| Group | Country | Real GDP Growth (2023) | Real GDP Growth (2024P) |
|---|---|---|---|
| G7 | 🇺🇸 U.S. | 2.5% | 2.7% |
| G7 | 🇨🇦 Canada | 1.1% | 1.2% |
| G7 | 🇯🇵 Japan | 1.9% | 0.9% |
| G7 | 🇫🇷 France | 0.9% | 0.7% |
| G7 | 🇮🇹 Italy | 0.9% | 0.7% |
| G7 | 🇬🇧 UK | 0.1% | 0.5% |
| G7 | 🇩🇪 Germany | -0.3% | 0.2% |
| BRICS | 🇮🇳 India | 7.8% | 6.8% |
| BRICS | 🇨🇳 China | 5.2% | 4.6% |
| BRICS | 🇦🇪 UAE | 3.4% | 3.5% |
| BRICS | 🇮🇷 Iran | 4.7% | 3.3% |
| BRICS | 🇷🇺 Russia | 3.6% | 3.2% |
| BRICS | 🇪🇬 Egypt | 3.8% | 3.0% |
| BRICS-invited | 🇸🇦 Saudi Arabia | -0.8% | 2.6% |
| BRICS | 🇧🇷 Brazil | 2.9% | 2.2% |
| BRICS | 🇿🇦 South Africa | 0.6% | 0.9% |
| BRICS | 🇪🇹 Ethiopia | 7.2% | 6.2% |
| 🌍 World | 3.2% | 3.2% |
China and India are forecasted to maintain relatively high growth rates in 2024 at 4.6% and 6.8% respectively, but compared to the previous year, China is growing 0.6 percentage points slower while India is an entire percentage point slower.
On the other hand, four G7 nations are set to grow faster than last year, which includes Germany making its comeback from its negative real GDP growth of -0.3% in 2023.
Faster Growth for BRICS than G7 Nations
Despite mostly lower growth forecasts in 2024 compared to 2023, BRICS nations still have a significantly higher average growth forecast at 3.6% compared to the G7 average of 1%.
While the G7 countries’ combined GDP is around $15 trillion greater than the BRICS nations, with continued higher growth rates and the potential to add more members, BRICS looks likely to overtake the G7 in economic size within two decades.
BRICS Expansion Stutters Before October 2024 Summit
BRICS’ recent expansion has stuttered slightly, as Argentina’s newly-elected president Javier Milei declined its invitation and Saudi Arabia clarified that the country is still considering its invitation and has not joined BRICS yet.
Even with these initial growing pains, South Africa’s Foreign Minister Naledi Pandor told reporters in February that 34 different countries have submitted applications to join the growing BRICS bloc.
Any changes to the group are likely to be announced leading up to or at the 2024 BRICS summit which takes place October 22-24 in Kazan, Russia.
Get the Full Analysis of the IMF’s Outlook on VC+
This visual is part of an exclusive special dispatch for VC+ members which breaks down the key takeaways from the IMF’s 2024 World Economic Outlook.
For the full set of charts and analysis, sign up for VC+.

-

 Markets1 week ago
U.S. Debt Interest Payments Reach $1 Trillion
-

 Markets2 weeks ago
Ranked: The Most Valuable Housing Markets in America
-

 Money2 weeks ago
Which States Have the Highest Minimum Wage in America?
-

 AI2 weeks ago
Ranked: Semiconductor Companies by Industry Revenue Share
-

 Markets2 weeks ago
Ranked: The World’s Top Flight Routes, by Revenue
-

 Countries2 weeks ago
Population Projections: The World’s 6 Largest Countries in 2075
-

 Markets2 weeks ago
The Top 10 States by Real GDP Growth in 2023
-

 Money2 weeks ago
The Smallest Gender Wage Gaps in OECD Countries