Personal Finance
Ranked: The Best and Worst Pension Plans, by Country


The Best and Worst Pension Plans Worldwide
Each year, millions of people around the world leave the workforce to retire.
But as the global population grows older, and the COVID-19 pandemic accelerates the already rising number of retirees, there is still a large degree of variance in the quality of public pension plans around the world.
Which countries have invested in robust public pension programs, and which lag behind?
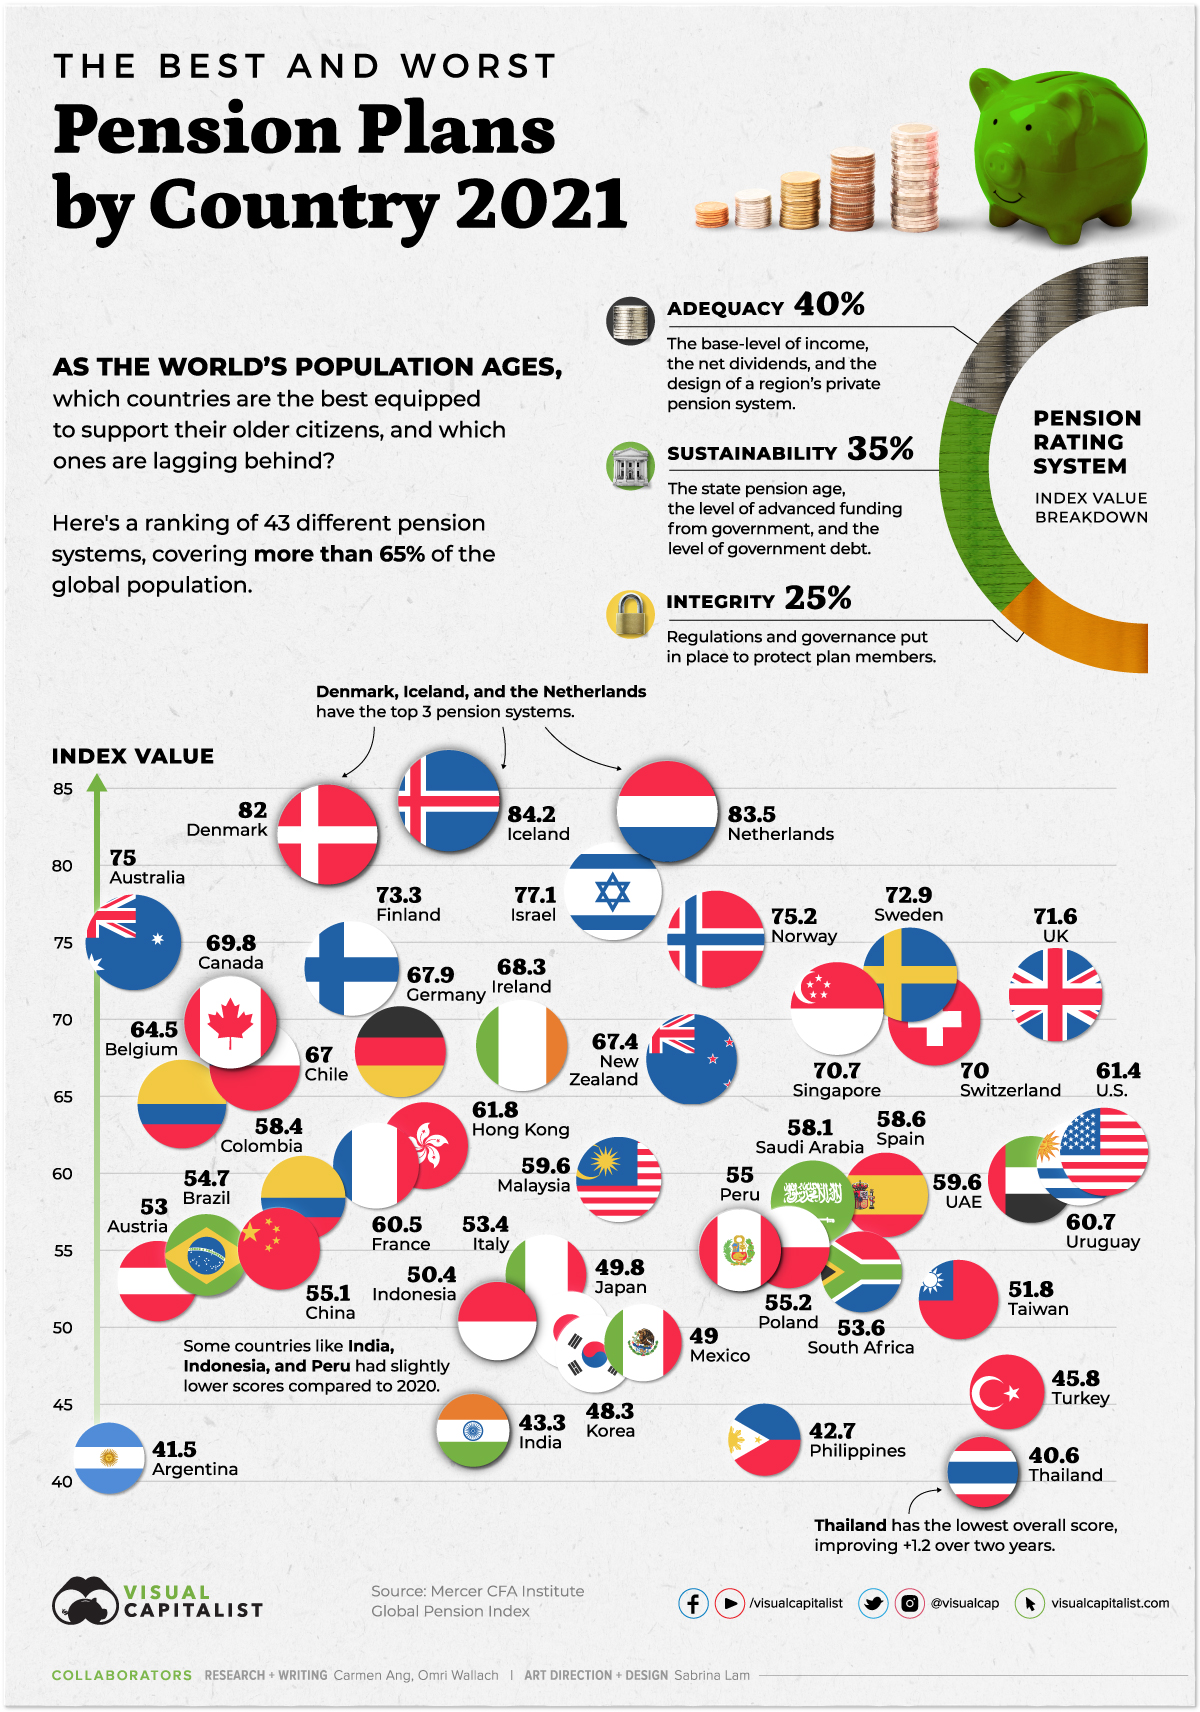
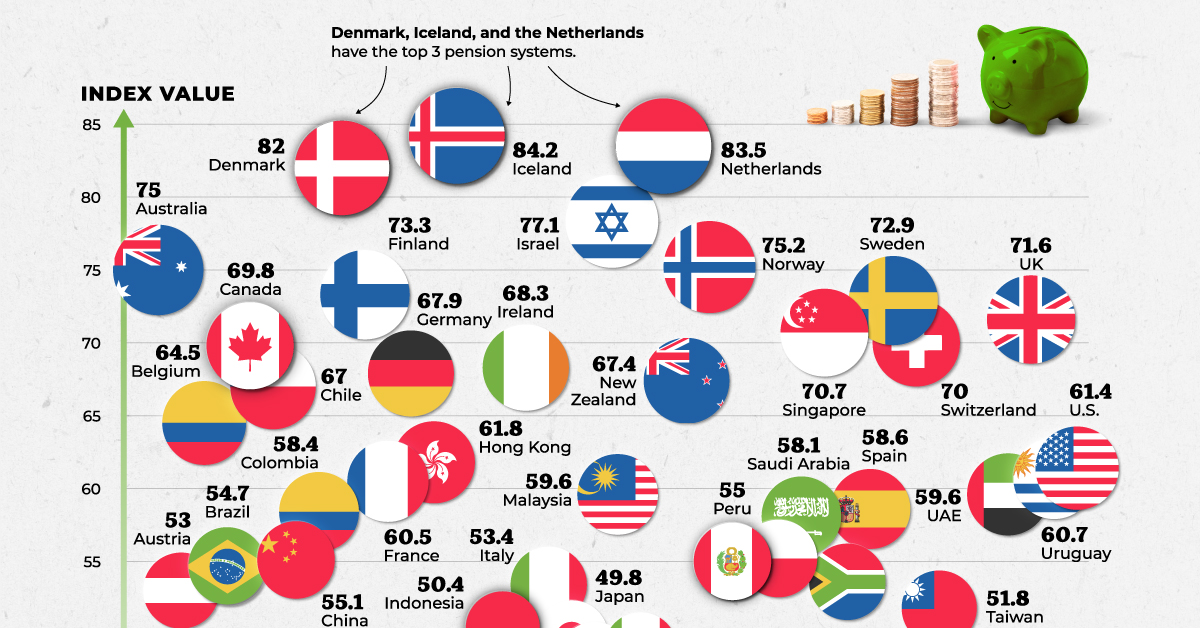
This graphic, using 2021 data from Mercer CFA Institute Global Pension Index, compares retirement income systems worldwide.
How the Index Ranks Pension Plans
Because a country’s pension system is unique to its particular economic and historical context, it’s difficult to draw direct comparisons. However, there are certain elements that pension experts see as universally positive, and that lead to better financial support for older citizens.
As with previous rankings, Mercer and the CFA Institute organized these universal elements into three sub-indexes:
- Adequacy: The base-level of income, as well as the design of a region’s private pension system.
- Sustainability: The state pension age, the level of advanced funding from the government, and the level of government debt.
- Integrity: Regulations and governance put in place to protect plan members.
These three measures were used to rank the pension system of 43 different countries, representing more than 65% of the world’s population. This year’s iteration of the index notably includes four new countries—Iceland, Taiwan, UAE, and Uruguay.
The Full Ranking
When it comes to the best pension plans across the globe, Iceland, the Netherlands, and Denmark have the top three systems.
| Country | Overall Value | Adequacy | Sustainability | Integrity |
|---|---|---|---|---|
| 🇦🇷 Argentina | 41.5 | 52.7 | 27.7 | 43.0 |
| 🇦🇺 Australia | 75.0 | 67.4 | 75.7 | 86.3 |
| 🇦🇹 Austria | 53.0 | 65.3 | 23.5 | 74.5 |
| 🇧🇪 Belgium | 64.5 | 74.9 | 36.3 | 87.4 |
| 🇧🇷 Brazil | 54.7 | 71.2 | 24.1 | 71.2 |
| 🇨🇦 Canada | 69.8 | 69.0 | 65.7 | 76.7 |
| 🇨🇱 Chile | 67.0 | 57.6 | 68.8 | 79.3 |
| 🇨🇳 China | 55.1 | 62.6 | 43.5 | 59.4 |
| 🇨🇴 Colombia | 58.4 | 62.0 | 46.2 | 69.8 |
| 🇩🇰 Denmark | 82.0 | 81.1 | 83.5 | 81.4 |
| 🇫🇮 Finland | 73.3 | 71.4 | 61.5 | 93.1 |
| 🇫🇷 France | 60.5 | 79.1 | 41.8 | 56.8 |
| 🇩🇪 Germany | 67.9 | 79.3 | 45.4 | 81.2 |
| 🇭🇰 Hong Kong | 61.8 | 55.1 | 51.1 | 87.7 |
| 🇮🇸 Iceland | 84.2 | 82.7 | 84.6 | 86.0 |
| 🇮🇳 India | 43.3 | 33.5 | 41.8 | 61.0 |
| 🇮🇩 Indonesia | 50.4 | 44.7 | 43.6 | 69.2 |
| 🇮🇪 Ireland | 68.3 | 78.0 | 47.4 | 82.1 |
| 🇮🇱 Israel | 77.1 | 73.6 | 76.1 | 83.9 |
| 🇮🇹 Italy | 53.4 | 68.2 | 21.3 | 74.9 |
| 🇯🇵 Japan | 49.8 | 52.9 | 37.5 | 61.9 |
| 🇰🇷 Korea | 48.3 | 43.4 | 52.7 | 50.0 |
| 🇲🇾 Malaysia | 59.6 | 50.6 | 57.5 | 76.8 |
| 🇲🇽 Mexico | 49.0 | 47.3 | 54.7 | 43.8 |
| 🇳🇱 Netherlands | 83.5 | 82.3 | 81.6 | 87.9 |
| 🇳🇿 New Zealand | 67.4 | 61.8 | 62.5 | 83.2 |
| 🇳🇴 Norway | 75.2 | 81.2 | 57.4 | 90.2 |
| 🇵🇪 Peru | 55.0 | 58.8 | 44.2 | 64.1 |
| 🇵🇭 Philippines | 42.7 | 38.9 | 52.5 | 35.0 |
| 🇵🇱 Poland | 55.2 | 60.9 | 41.3 | 65.6 |
| 🇸🇦 Saudi Arabia | 58.1 | 61.7 | 50.9 | 62.5 |
| 🇸🇬 Singapore | 70.7 | 73.5 | 59.8 | 81.5 |
| 🇿🇦 South Africa | 53.6 | 44.3 | 46.5 | 78.5 |
| 🇪🇸 Spain | 58.6 | 72.9 | 28.1 | 78.3 |
| 🇸🇪 Sweden | 72.9 | 67.8 | 73.7 | 80.0 |
| 🇨🇭 Switzerland | 70.0 | 65.4 | 67.2 | 81.3 |
| 🇹🇼 Taiwan | 51.8 | 40.8 | 51.9 | 69.3 |
| 🇹🇭 Thailand | 40.6 | 35.2 | 40.0 | 50.0 |
| 🇹🇷 Turkey | 45.8 | 47.7 | 28.6 | 66.7 |
| 🇦🇪 UAE | 59.6 | 59.7 | 50.2 | 72.6 |
| 🇬🇧 UK | 71.6 | 73.9 | 59.8 | 84.4 |
| 🇺🇾 Uruguay | 60.7 | 62.1 | 49.2 | 74.4 |
| 🇺🇲 U.S. | 61.4 | 60.9 | 63.6 | 59.2 |
| Average | 61.0 | 62.2 | 51.7 | 72.1 |
Iceland’s system ranks high across all three sub-indexes. The country offers a state pension with two components: mandatory contributions from both employees and employers, and optional contributions to state-approved pension products.
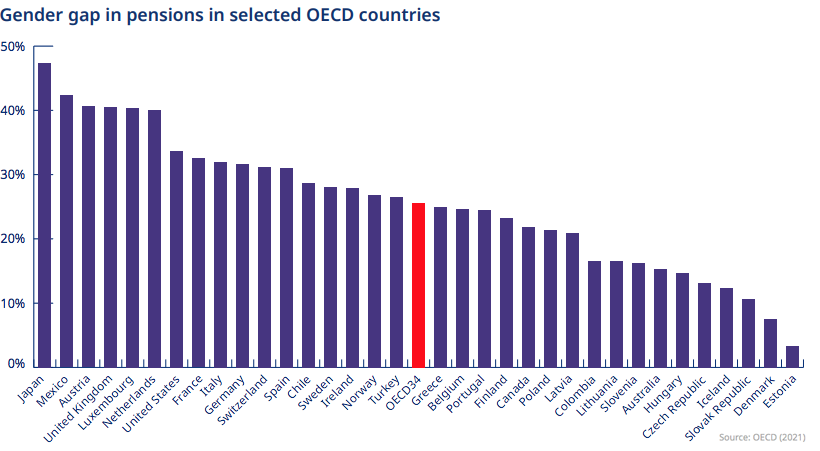
Its system has a high contribution rate, which ultimately results in a generous state pension that retirees in Iceland can tap into. The country also has a relatively low gender pension gap, meaning the difference between the average female pension versus male pension is relatively small—especially compared to other OECD countries.
On the opposite end of the spectrum, the Philippines, Argentina, and Thailand scored the lowest on the ranking.
Thailand scores particularly low in the adequacy category, with a score of 35.2. To increase its score, Thailand could increase the minimum payments for its poorest demographic and include more employees in occupational pension schemes.
Recommendations for Better Pension Plans
According to the index, countries seem to be steadily improving their pension systems. From 2020 to 2021, the average score of the overall index increased by 1.0.
With an average of 60.7, the index shows that most countries’ systems have some good features, but they also have some significant shortcomings that could be addressed by the following recommendations:
- Boosting adequacy by increasing coverage, and including more employees in private pensions systems.
- Increasing sustainability by adjusting retirement pension age to reflect increasing life expectancy, and promoting higher workforce participation from older citizens.
- Raise integrity by introducing policies that reduce the gender pension gap and discrepancies amongst minorities.
Countries that implement even a few of these changes could make a huge difference for their next generation of retirees—and those that don’t could be in trouble in the near future.


Personal Finance
Chart: The Declining Value of the U.S. Federal Minimum Wage
This graphic compares the nominal vs. inflation-adjusted value of the U.S. minimum wage, from 1940 to 2023.


The Declining Value of the U.S. Federal Minimum Wage
This was originally posted on our Voronoi app. Download the app for free on iOS or Android and discover incredible data-driven charts from a variety of trusted sources.
This graphic illustrates the history of the U.S. federal minimum wage using data compiled by Statista, in both nominal and real (inflation-adjusted) terms. The federal minimum wage was raised to $7.25 per hour in July 2009, where it has remained ever since.
Nominal vs. Real Value
The data we used to create this graphic can be found in the table below.
| Year | Nominal value ($/hour) | Real value ($/hour) |
|---|---|---|
| 1940 | 0.3 | 6.5 |
| 1945 | 0.4 | 6.82 |
| 1950 | 0.75 | 9.64 |
| 1955 | 0.75 | 8.52 |
| 1960 | 1 | 10.28 |
| 1965 | 1.25 | 12.08 |
| 1970 | 1.6 | 12.61 |
| 1975 | 2.1 | 12.04 |
| 1980 | 3.1 | 11.61 |
| 1985 | 3.35 | 9.51 |
| 1990 | 3.8 | 8.94 |
| 1995 | 4.25 | 8.49 |
| 2000 | 5.15 | 9.12 |
| 2005 | 5.15 | 8.03 |
| 2010 | 7.25 | 10.09 |
| 2015 | 7.25 | 9.3 |
| 2018 | 7.25 | 8.78 |
| 2019 | 7.25 | 8.61 |
| 2020 | 7.25 | 8.58 |
| 2021 | 7.25 | 8.24 |
| 2022 | 7.25 | 7.61 |
| 2023 | 7.25 | 7.25 |
What our graphic shows is how inflation has eroded the real value of the U.S. minimum wage over time, despite nominal increases.
For instance, consider the year 1960, when the federal minimum wage was $1 per hour. After accounting for inflation, this would be worth around $10.28 today!
The two lines converge at 2023 because the nominal and real value are identical in present day terms.
Many States Have Their Own Minimum Wage
According to the National Conference of State Legislatures (NCSL), 30 states and Washington, D.C. have implemented a minimum wage that is higher than $7.25.
The following states have adopted the federal minimum: Georgia, Idaho, Indiana, Iowa, Kansas, Kentucky, New Hampshire, North Carolina, North Dakota, Oklahoma, Pennsylvania, Texas, Utah, Wisconsin, and Wyoming.
Meanwhile, the states of Alabama, Louisiana, Mississippi, South Carolina, and Tennessee have no wage minimums, but have to follow the federal minimum.
How Does the U.S. Minimum Wage Rank Globally?
If you found this topic interesting, check out Mapped: Minimum Wage Around the World to see which countries have the highest minimum wage in monthly terms, as of January 2023.

-

 Real Estate2 weeks ago
Visualizing America’s Shortage of Affordable Homes
-

 Technology1 week ago
Ranked: Semiconductor Companies by Industry Revenue Share
-

 Money2 weeks ago
Which States Have the Highest Minimum Wage in America?
-

 Real Estate2 weeks ago
Ranked: The Most Valuable Housing Markets in America
-

 Business2 weeks ago
Charted: Big Four Market Share by S&P 500 Audits
-

 AI2 weeks ago
The Stock Performance of U.S. Chipmakers So Far in 2024
-

 Misc2 weeks ago
Almost Every EV Stock is Down After Q1 2024
-

 Money2 weeks ago
Where Does One U.S. Tax Dollar Go?