Environment
Ranked: The 50 Companies That Use the Highest Percentage of Green Energy
Which Companies Use the Most Green Energy?
Green energy was once a niche segment of the wider energy industry, but it’s quickly becoming an essential energy source in many regions and nations across the globe.
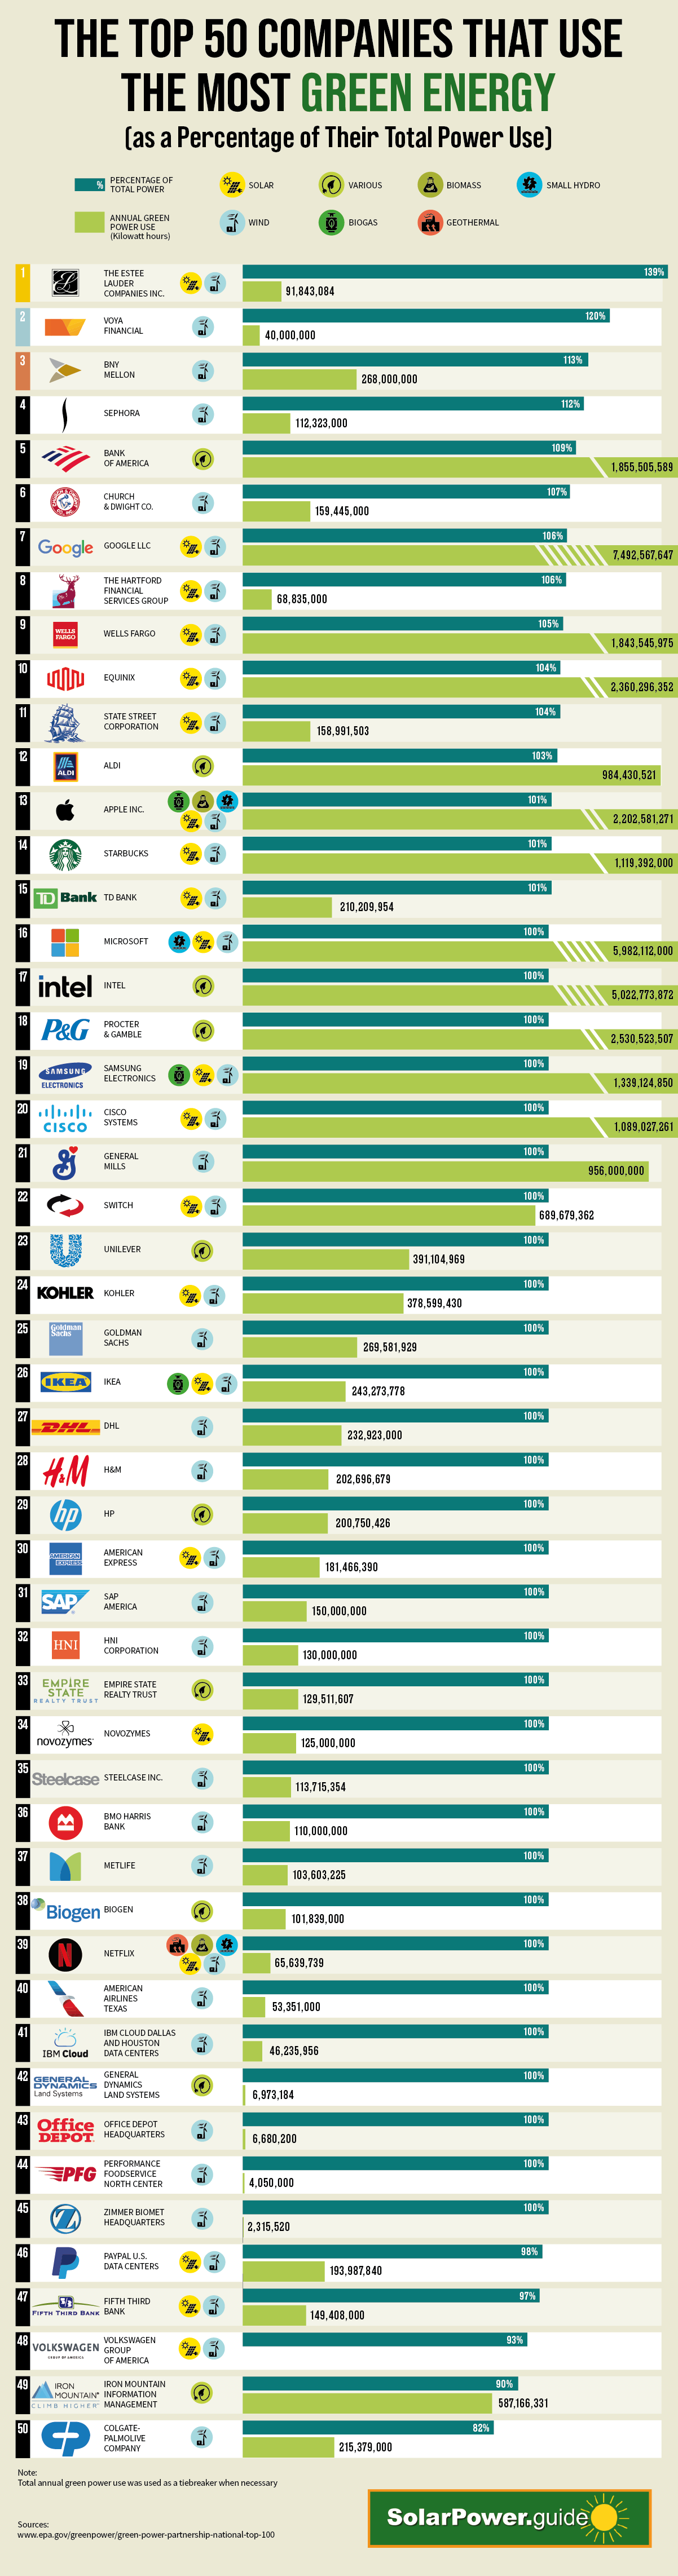
Based on data from the Environmental Protection Agency (EPA), this infographic by SolarPower.Guide shows the top 50 greenest companies, based on the highest proportion of green energy used in their overall consumption mix.
Leaders in Green Energy Use
As green energy becomes more affordable, some major businesses like Google, Wells Fargo, and Apple are embracing it in a big way.
It also helps that institutional investors are nudging companies in that direction anyways, especially as they become more focused on incorporating environment, social and governance (ESG) into their portfolios.
Here are the top 15 U.S. companies that use the highest percentage of green energy:
| Rank | Company | Green Power use | Annual Green Power Use (kWh) |
|---|---|---|---|
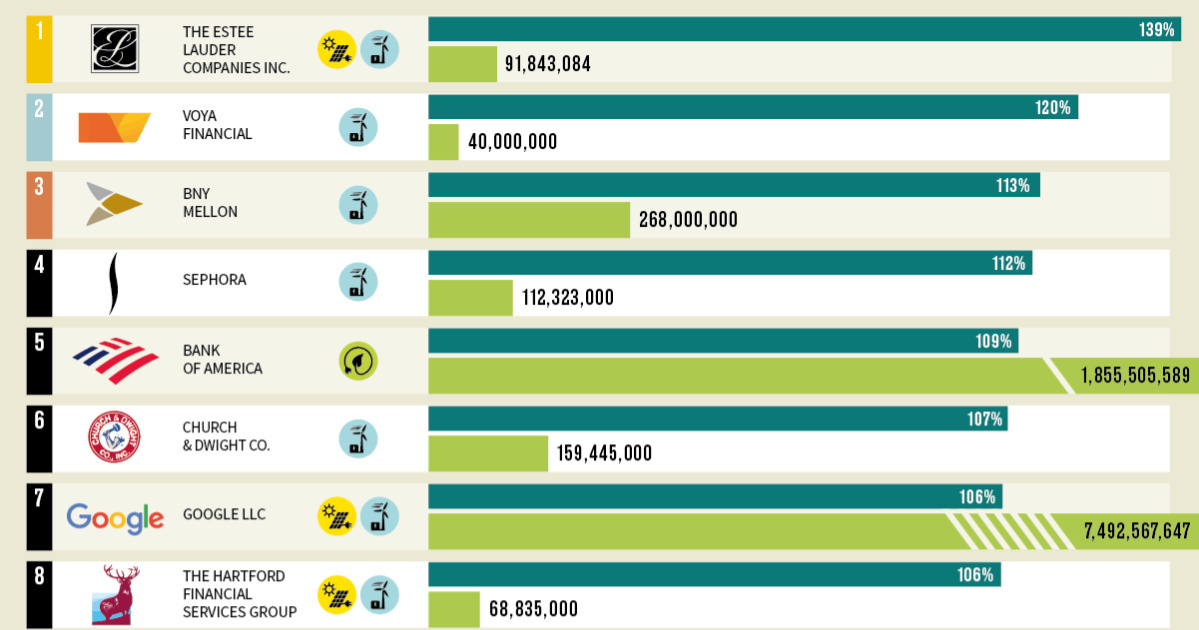
| #1 | The Estee Lauder Companies Inc. | 139% | 91,843,084 |
| #2 | Voya Financial | 120% | 40,000,000 |
| #3 | BNY Mellon | 113% | 268,000,000 |
| #4 | Sephora | 112% | 112,323,000 |
| #5 | Bank of America | 109% | 1,855,505,589 |
| #6 | Church & Dwight Co. | 107% | 159,445,000 |
| #7 | Google LLC | 106% | 7,492,567,647 |
| #8 | The Hartford Financial Services Group | 106% | 68,835,000 |
| #9 | Wells Fargo | 105% | 1,843,545,975 |
| #10 | Equinix | 104% | 2,360,296,352 |
| #11 | State Street Corp. | 104% | 158,991,503 |
| #12 | Aldi | 103% | 984,430,521 |
| #13 | Apple Inc. | 101% | 2,202,581,271 |
| #14 | Starbucks | 101% | 1,119,392,000 |
| #15 | TD Bank | 101% | 210,209,954 |
Note: The values reflect the amount of green power as a percentage of a company’s total electricity use. Companies that purchase green power exceeding their total organization-wide electricity use will show a value greater than 100%.
Green Energy vs. Renewable Energy
The term “green energy” is often met with confusion by some and is sometimes just referred to as “renewables” by others. So, what is green energy, and how is it different from other sources of renewable energy?
Green energy is a subset of renewable energy and represents those energy sources and technologies that provide the highest environmental benefit. The EPA defines green power as electricity produced from solar, wind, geothermal, biogas, eligible biomass, and low-impact small hydroelectric sources.
Other renewable types of energy exist, but may not be considered fully green, at least as the EPA defines it. For example, while massive hydro projects provide a renewable source of energy, they can also have big impact on the environment. Same goes for non-eligible biomass—a category which includes biomass that may not be close to carbon-neutral.
Climate Commitments
In addition to the use of green power for operations, major companies are also looking at the bigger picture and setting targets to achieve carbon neutrality.
Here are a few of the major companies that have made climate commitments in the near future:
| Company | Commitment | By Year |
|---|---|---|
| Apple | Net Zero Carbon Emission | 2030 |
| Ikea | Climate Positive | 2030 |
| Burger King | Net Zero Operations | 2030 |
| Microsoft | Net Zero Carbon Emission | 2030 |
| BBC | Net Zero Carbon Emission | 2030 |
| Net Zero Value Chain | 2030 | |
| Verizon | Net Zero Carbon Emission | 2035 |
| Unilever | Net Zero Carbon Emission | 2039 |
| Pepsi Co. | Net Zero Carbon Emission | 2040 |
| BP | Net Zero Carbon Emission | 2050 |
This will undoubtedly impact their overall consumption and the energy mix in the years to come.


Green
Ranked: Top Countries by Total Forest Loss Since 2001
The country with the most forest loss since 2001 lost as much forest cover as the next four countries combined.
Ranked: Top Countries By Total Forest Loss Since 2001
This was originally posted on our Voronoi app. Download the app for free on iOS or Android and discover incredible data-driven charts from a variety of trusted sources.
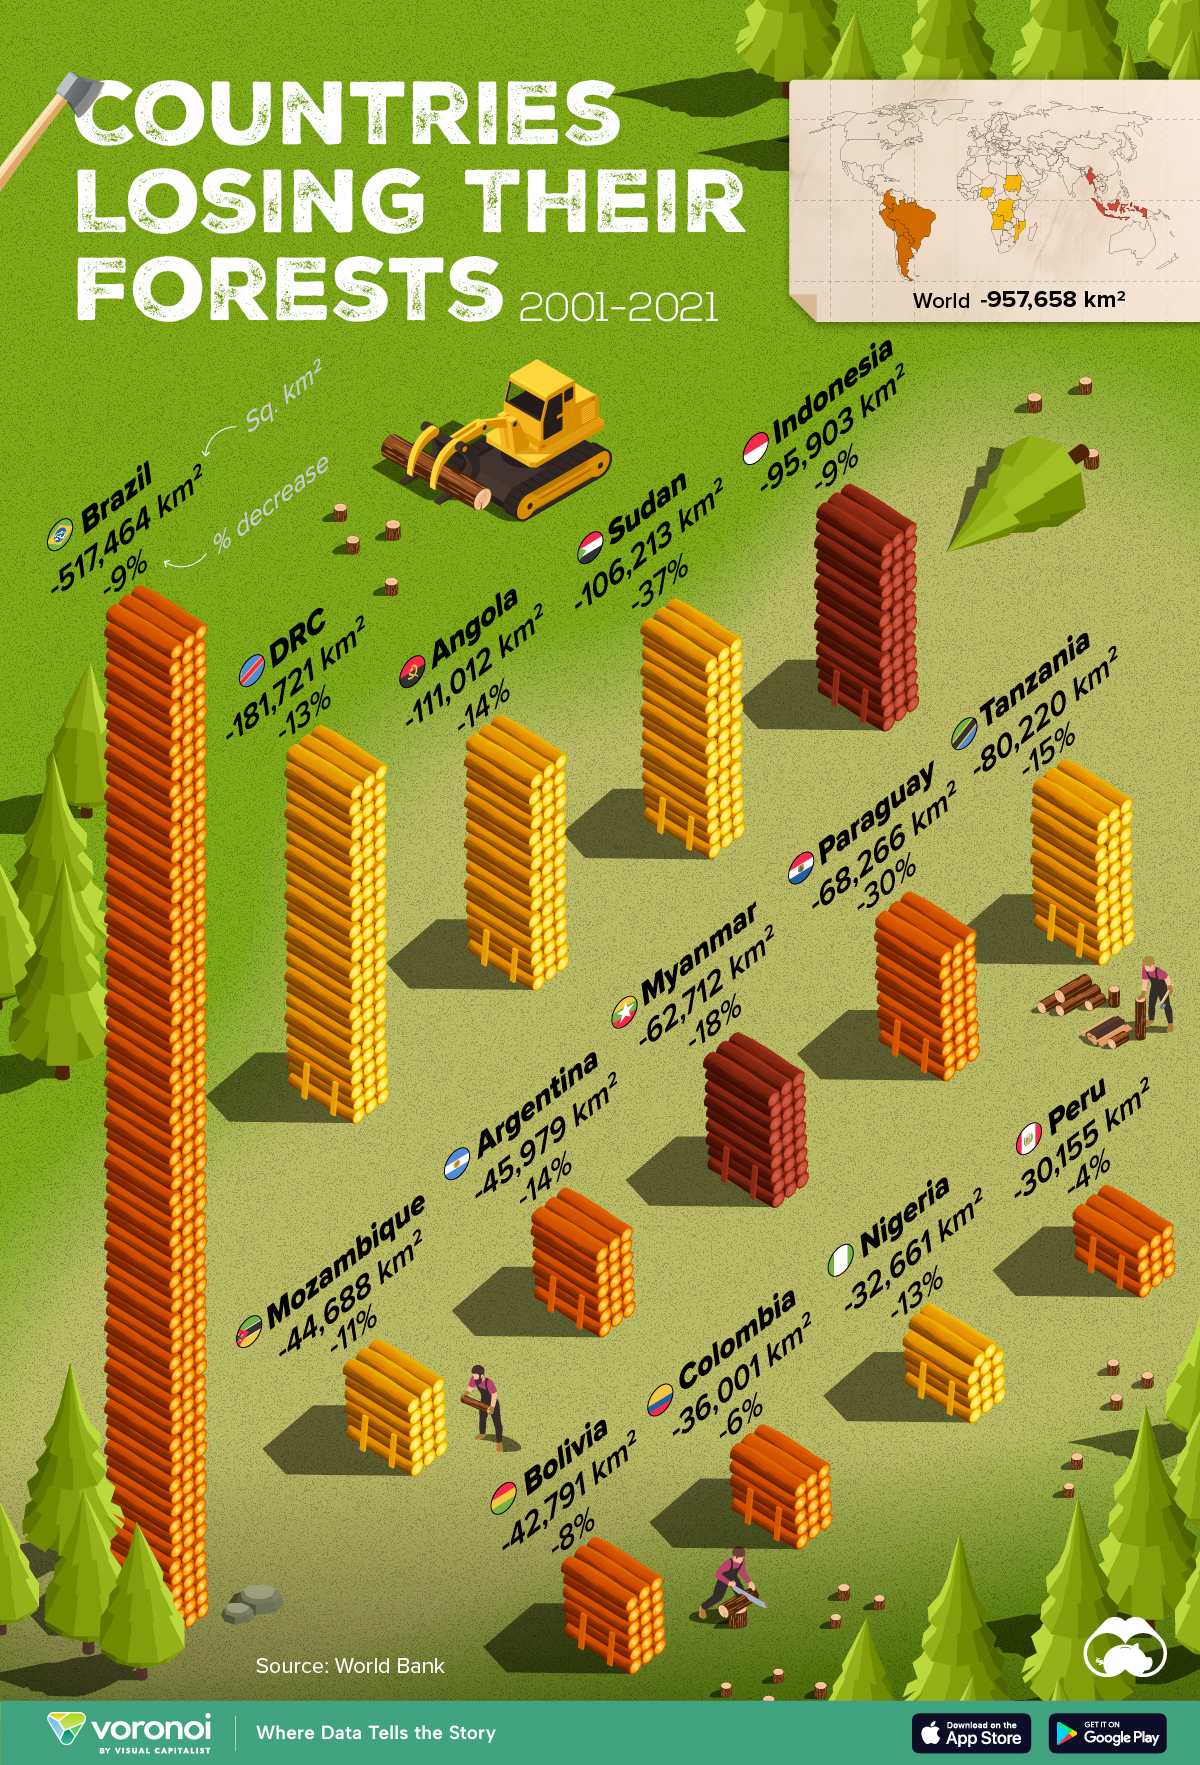
Forests are critical natural resources, often caught in the crosshairs of economic development. Thanks to expanding human settlement, agriculture, and industry, the world lost nearly 1 million square kilometers (km²) of forest cover since 2001.
But where has most of this deforestation occurred?
We rank the countries by the total decrease in their forest area between 2001 and 2021, measured in square kilometers along with their percentage decrease for context. All of this data was sourced from the World Bank.
A caveat to this data: countries are ranked by total forest loss, so countries with the largest forests feature predominantly on this list.
Which Country Has Lost the Most Forests (2001-2021)?
Brazil has lost more than half a million square kilometers of forest in the last two decades. Agricultural expansion for beef and soy production alongside mining and infrastructure growth are the primary drivers behind this large scale deforestation.
This has also caused periodic fires in the Amazon rainforest, drawing repeated alarm from around the world. In fact, Brazil has lost as much forest cover as the next four countries combined.
The table below lists the countries included in this graphic, as well as several others further down the ranking.
| Rank | Country | Region | 2001–21 Change (in km2) | % of Forest Loss |
|---|---|---|---|---|
| 1 | 🇧🇷 Brazil | South America | -517,464 | -9% |
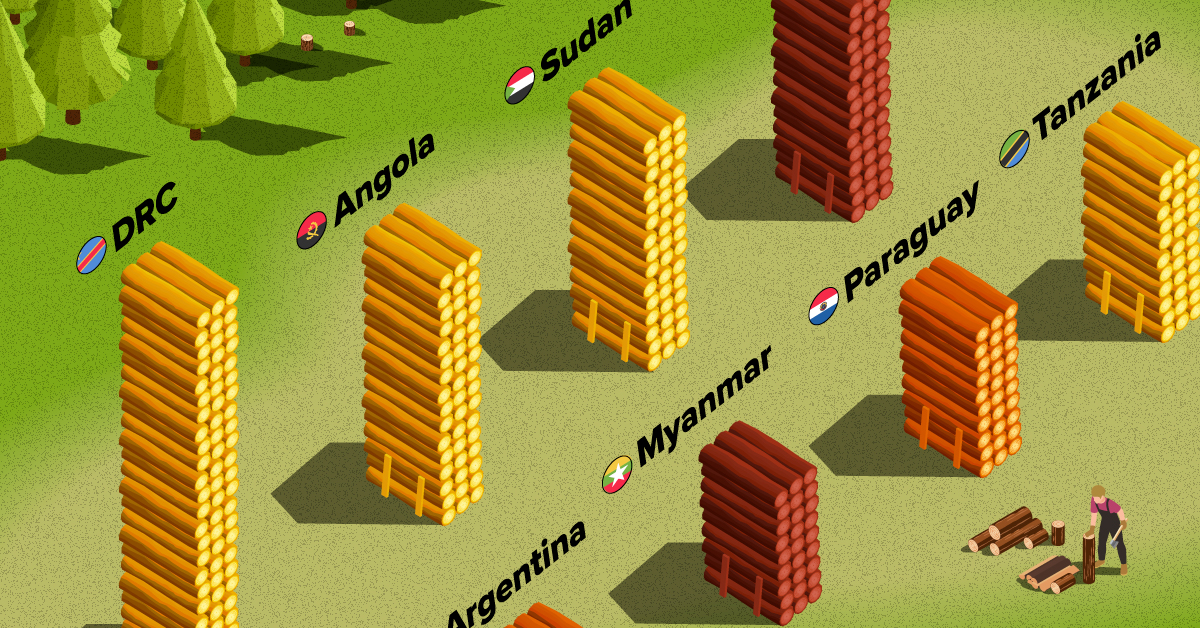
| 2 | 🇨🇩 DRC | Africa | -181,721 | -13% |
| 3 | 🇦🇴 Angola | Africa | -111,012 | -14% |
| 4 | 🇸🇩 Sudan | Africa | -106,213 | -37% |
| 5 | 🇮🇩 Indonesia | Asia | -95,903 | -9% |
| 6 | 🇹🇿 Tanzania | Africa | -80,220 | -15% |
| 7 | 🇵🇾 Paraguay | South America | -68,266 | -30% |
| 8 | 🇲🇲 Myanmar | Asia | -62,712 | -18% |
| 9 | 🇦🇷 Argentina | South America | -45,979 | -14% |
| 10 | 🇲🇿 Mozambique | Africa | -44,688 | -11% |
| 11 | 🇧🇴 Bolivia | South America | -42,791 | -8% |
| 12 | 🇨🇴 Colombia | South America | -36,001 | -6% |
| 13 | 🇳🇬 Nigeria | Africa | -32,661 | -13% |
| 14 | 🇵🇪 Peru | South America | -30,155 | -4% |
| 15 | 🇰🇭 Cambodia | Asia | -28,491 | -26% |
| 16 | 🇻🇪 Venezuela | South America | -28,130 | -6% |
| 17 | 🇲🇽 Mexico | North America | -26,732 | -4% |
| 18 | 🇿🇲 Zambia | Africa | -23,924 | -5% |
| 19 | 🇧🇼 Botswana | Africa | -23,660 | -14% |
| 20 | 🇨🇮 Cote d'Ivoire | Africa | -22,577 | -45% |
What is quickly apparent is how most of the countries on this list are from Africa and South America. A study found a correlation where developing economies tend to have higher deforestation rates than advanced economies. Former colonies have also experienced more forest loss than those that were not colonized.
In Asia, Indonesia’s burgeoning palm oil industry is a key driver to deforestation, though efforts are now being made to reverse its impact. Meanwhile, Cambodia experienced rapid clear-cutting for its growing rubber plantations and timber industry.
Finally, Myanmar has long contended with illegal logging, but the country’s ongoing civil war is styming conversation efforts.

-

 Real Estate2 weeks ago
Visualizing America’s Shortage of Affordable Homes
-

 Technology1 week ago
Ranked: Semiconductor Companies by Industry Revenue Share
-

 Money1 week ago
Which States Have the Highest Minimum Wage in America?
-

 Real Estate1 week ago
Ranked: The Most Valuable Housing Markets in America
-

 Business2 weeks ago
Charted: Big Four Market Share by S&P 500 Audits
-

 AI2 weeks ago
The Stock Performance of U.S. Chipmakers So Far in 2024
-

 Misc2 weeks ago
Almost Every EV Stock is Down After Q1 2024
-

 Money2 weeks ago
Where Does One U.S. Tax Dollar Go?