Demographics
Ranked: The 20 Countries With the Fastest Declining Populations


Visualizing Population Decline by Country
Since the mid-1900s, the global population has followed a steep upwards trajectory.
While much of this growth has been concentrated in China and India, researchers expect the next wave of growth to occur in Africa. As of 2019, for example, the average woman in Niger is having over six children in her lifetime.
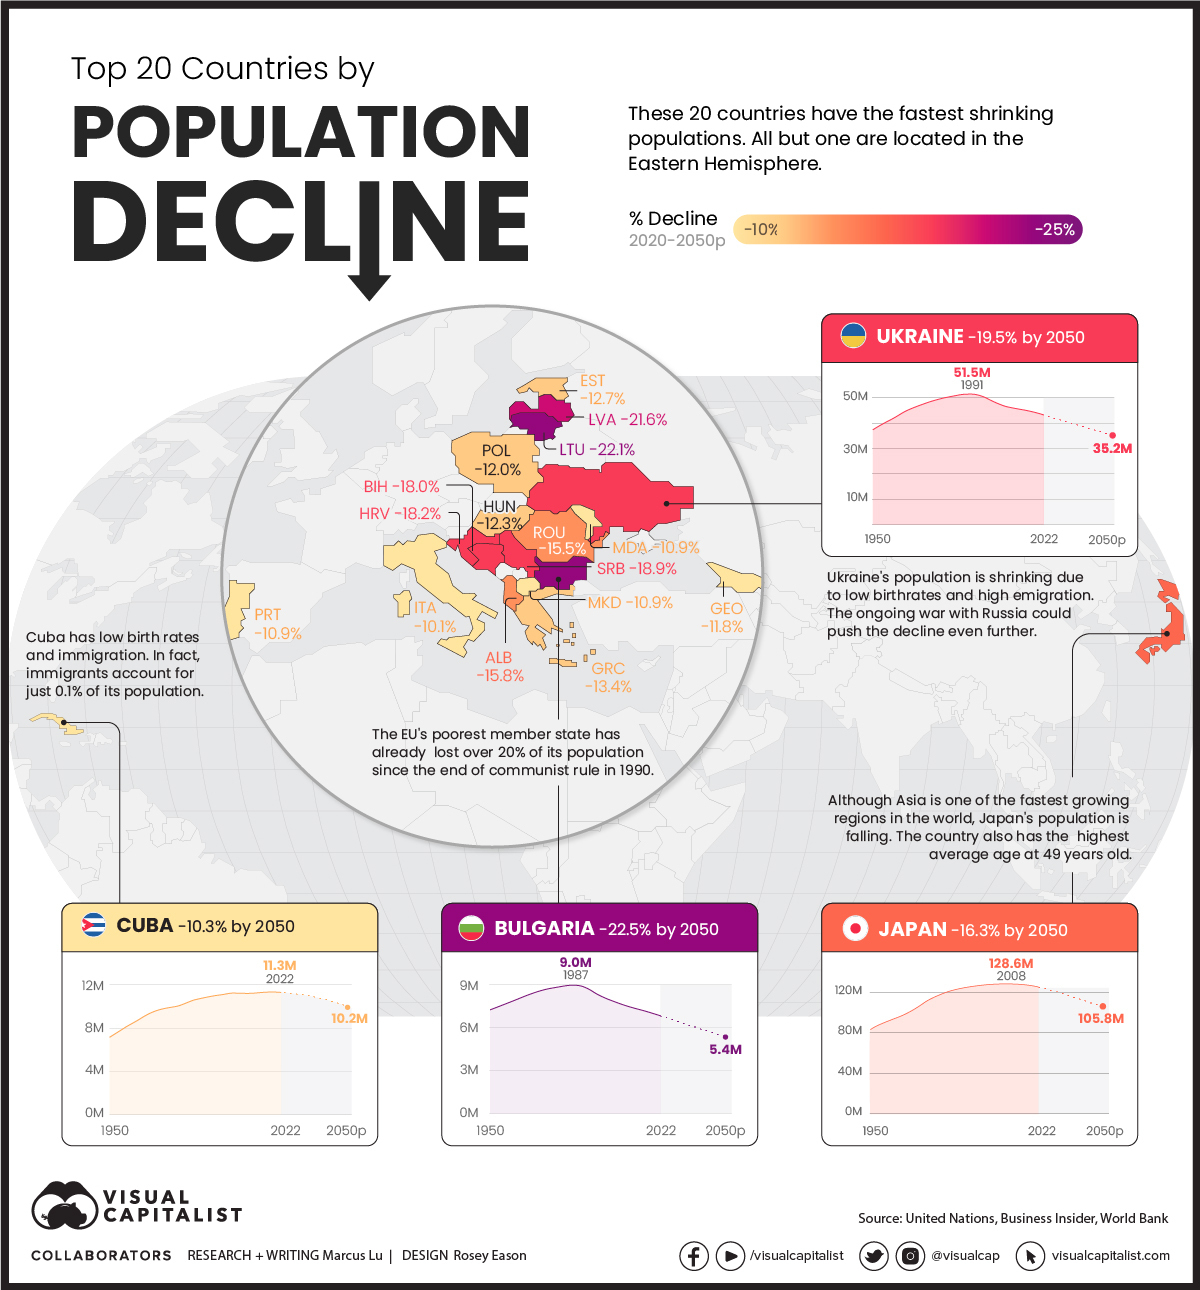
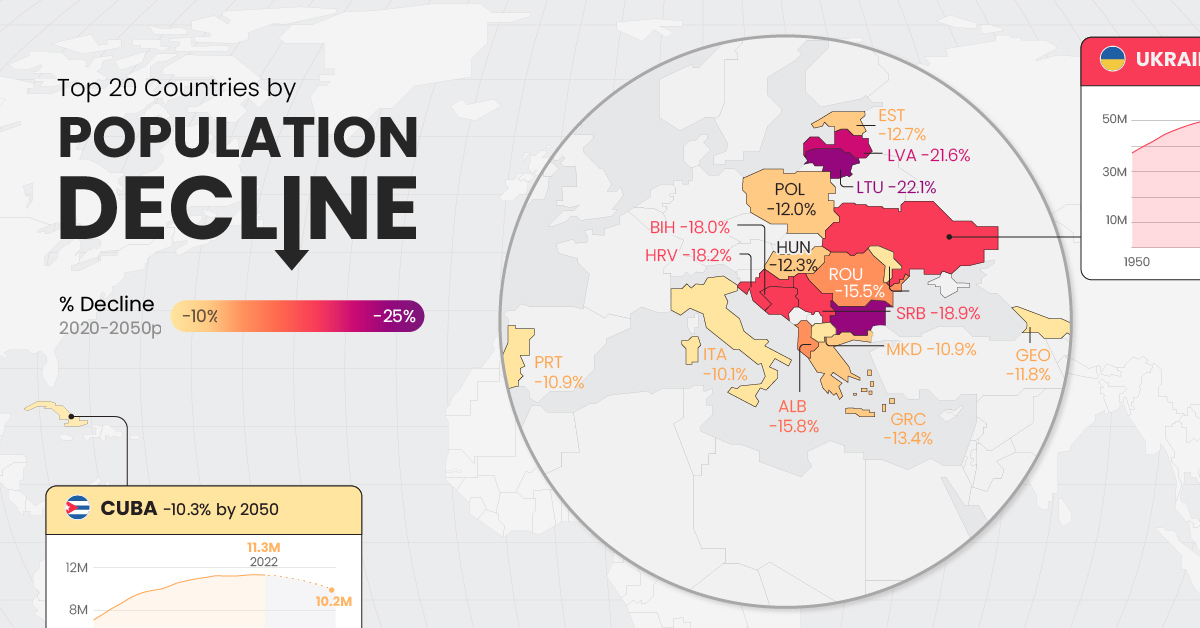
At the opposite end of this spectrum are a number of countries that appear to be shrinking from a population perspective. To shed some light on this somewhat surprising trend, we’ve visualized the top 20 countries by population decline.
The Top 20
The following table ranks countries by their rate of population decline, based on projected rate of change between 2020 and 2050 and using data from the United Nations.
| Rank | Country | Decline 2020-2050 |
|---|---|---|
| 1 | 🇧🇬 Bulgaria | 22.5% |
| 2 | 🇱🇹 Lithuania | 22.1% |
| 3 | 🇱🇻 Latvia | 21.6% |
| 4 | 🇺🇦 Ukraine | 19.5% |
| 5 | 🇷🇸 Serbia | 18.9% |
| 6 | 🇧🇦 Bosnia and Herzegovina | 18.2% |
| 7 | 🇭🇷 Croatia | 18.0% |
| 8 | 🇲🇩 Moldova | 16.7% |
| 9 | 🇯🇵 Japan | 16.3% |
| 10 | 🇦🇱 Albania | 15.8% |
| 11 | 🇷🇴 Romania | 15.5% |
| 12 | 🇬🇷 Greece | 13.4% |
| 13 | 🇪🇪 Estonia | 12.7% |
| 14 | 🇭🇺 Hungary | 12.3% |
| 15 | 🇵🇱 Poland | 12.0% |
| 16 | 🇬🇪 Georgia | 11.8% |
| 17 | 🇵🇹 Portugal | 10.9% |
| 18 | 🇲🇰 North Macedonia | 10.9% |
| 19 | 🇨🇺 Cuba | 10.3% |
| 20 | 🇮🇹 Italy | 10.1% |
Many of these countries are located in or near Eastern Europe, for reasons we’ll discuss below.
The first issue is birth rates, which according to the Peterson Institute for International Economics (PIIE), have fallen since the collapse of the Soviet Union. Across the region, the average number of children per woman fell from 2.1 in 1988 to 1.2 by 1998.
Birth rates have recovered slightly since then, but are not enough to offset deaths and emigration, which refers to citizens leaving their country to live elsewhere.
Eastern Europe saw several waves of emigration following the European Union’s (EU) border expansions in 2004 and 2007. The PIIE reports that by 2016, 6.3 million Eastern Europeans resided in other EU states.
The Outliers
There are two geographical outliers in this dataset which sit on either side of Europe.
Japan
The first is Japan, where birth rates have fallen continuously since 1970. It wasn’t until 2010, however, that the country’s overall population began to shrink.
By the numbers, the situation appears dire. In 2021, 811,604 babies were born in Japan, while 1.44 million people died. As a result of its low birth rates, the island nation also has the world’s highest average age at 49 years old.
The Japanese government has introduced various social programs to make having kids more appealing, but these don’t appear to be getting to the root of the problem. For deeper insight into Japan’s low birthrates, it’s worth reading this article by The Atlantic.
Cuba
The second country is Cuba, and it’s the only one not located within the Eastern Hemisphere. Cuba’s fertility rate of 1.7 children per woman is the lowest in the Latin American region. It can be compared to countries like Mexico (2.2), Paraguay (2.5), and Guatemala (3.0).
Cuba’s immigration is also incredibly low compared to its neighboring countries. According to the International Organization for Migration, immigrants account for just 0.1% of its total population.


Demographics
The Smallest Gender Wage Gaps in OECD Countries
Which OECD countries have the smallest gender wage gaps? We look at the 10 countries with gaps lower than the average.


The Smallest Gender Pay Gaps in OECD Countries
This was originally posted on our Voronoi app. Download the app for free on iOS or Android and discover incredible data-driven charts from a variety of trusted sources.
Among the 38 member countries in the Organization for Economic Cooperation and Development (OECD), several have made significant strides in addressing income inequality between men and women.
In this graphic we’ve ranked the OECD countries with the 10 smallest gender pay gaps, using the latest data from the OECD for 2022.
The gender pay gap is calculated as the difference between median full-time earnings for men and women divided by the median full-time earnings of men.
Which Countries Have the Smallest Gender Pay Gaps?
Luxembourg’s gender pay gap is the lowest among OECD members at only 0.4%—well below the OECD average of 11.6%.
| Rank | Country | Percentage Difference in Men's & Women's Full-time Earnings |
|---|---|---|
| 1 | 🇱🇺 Luxembourg | 0.4% |
| 2 | 🇧🇪 Belgium | 1.1% |
| 3 | 🇨🇷 Costa Rica | 1.4% |
| 4 | 🇨🇴 Colombia | 1.9% |
| 5 | 🇮🇪 Ireland | 2.0% |
| 6 | 🇭🇷 Croatia | 3.2% |
| 7 | 🇮🇹 Italy | 3.3% |
| 8 | 🇳🇴 Norway | 4.5% |
| 9 | 🇩🇰 Denmark | 5.8% |
| 10 | 🇵🇹 Portugal | 6.1% |
| OECD Average | 11.6% |
Notably, eight of the top 10 countries with the smallest gender pay gaps are located in Europe, as labor equality laws designed to target gender differences have begun to pay off.
The two other countries that made the list were Costa Rica (1.4%) and Colombia (1.9%), which came in third and fourth place, respectively.
How Did Luxembourg (Nearly) Eliminate its Gender Wage Gap?
Luxembourg’s virtually-non-existent gender wage gap in 2020 can be traced back to its diligent efforts to prioritize equal pay. Since 2016, firms that have not complied with the Labor Code’s equal pay laws have been subjected to penalizing fines ranging from €251 to €25,000.
Higher female education rates also contribute to the diminishing pay gap, with Luxembourg tied for first in the educational attainment rankings of the World Economic Forum’s Global Gender Gap Index Report for 2023.
See More Graphics about Demographics and Money
While these 10 countries are well below the OECD’s average gender pay gap of 11.6%, many OECD member countries including the U.S. are significantly above the average. To see the full list of the top 10 OECD countries with the largest gender pay gaps, check out this visualization.

-

 Maps2 weeks ago
Mapped: Average Wages Across Europe
-

 Money1 week ago
Which States Have the Highest Minimum Wage in America?
-

 Real Estate1 week ago
Ranked: The Most Valuable Housing Markets in America
-

 Markets1 week ago
Charted: Big Four Market Share by S&P 500 Audits
-

 AI1 week ago
The Stock Performance of U.S. Chipmakers So Far in 2024
-

 Automotive2 weeks ago
Almost Every EV Stock is Down After Q1 2024
-

 Money2 weeks ago
Where Does One U.S. Tax Dollar Go?
-

 Green2 weeks ago
Ranked: Top Countries by Total Forest Loss Since 2001