Technology
Ranked: The World’s Most Popular Social Networks, and Who Owns Them


The World’s Most Popular Social Networks, and Who Owns Them
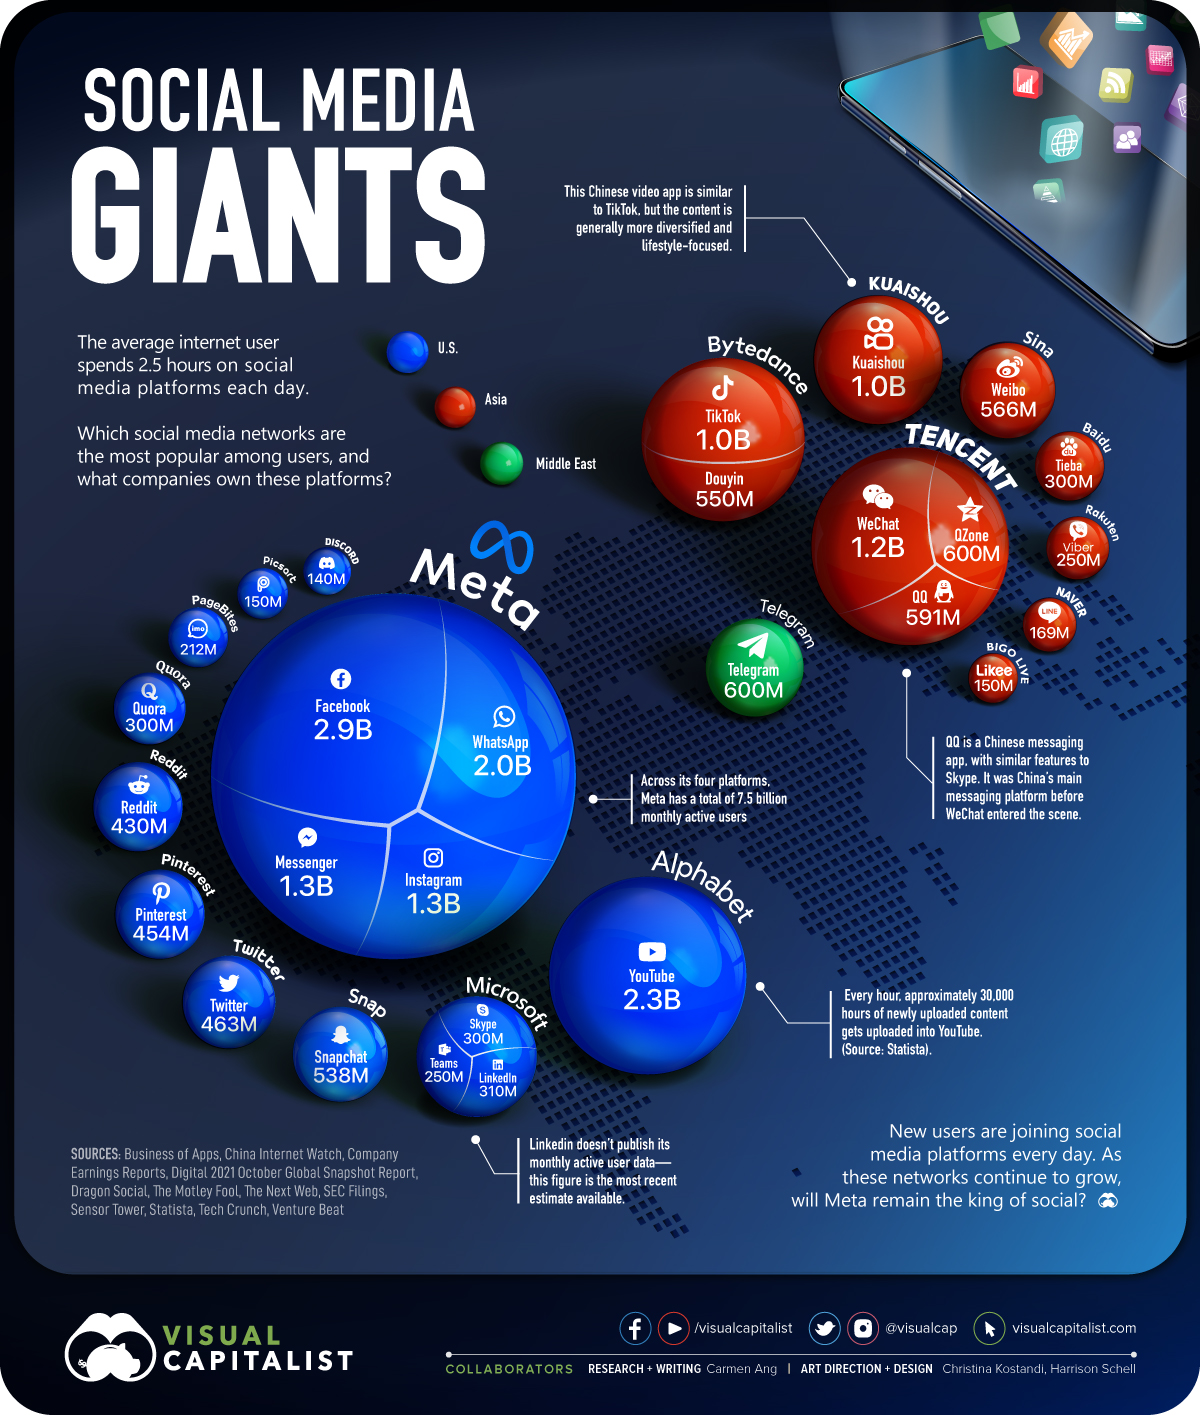
Currently, there are over 4.5 billion people around the world who use some form of social media—about 57% of the global population.
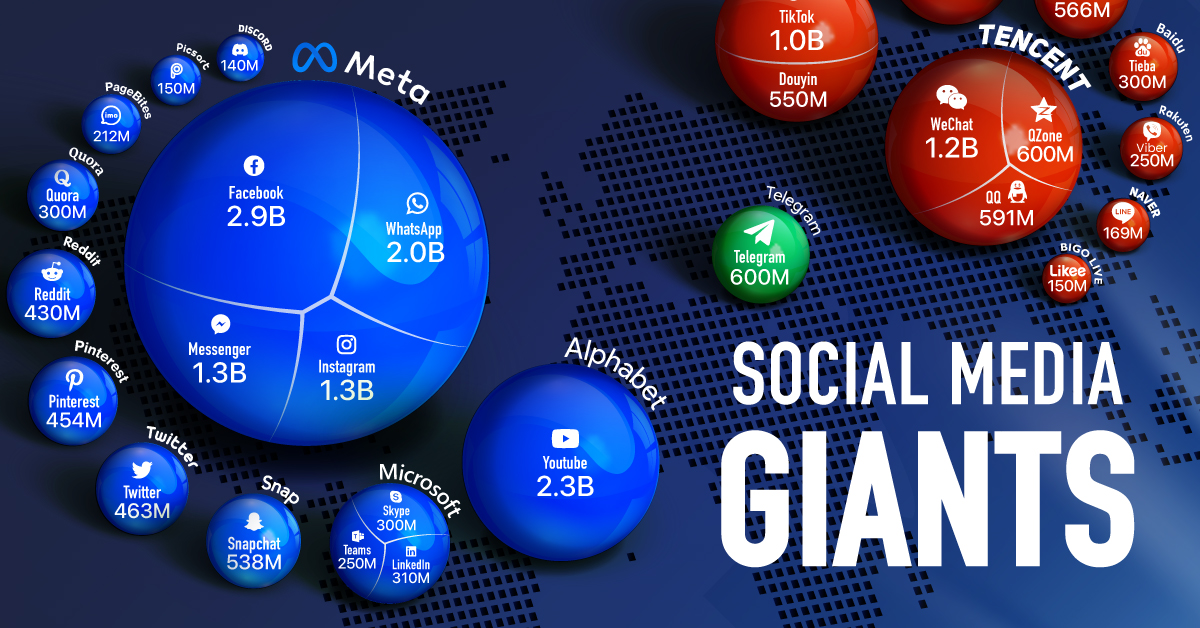
Yet, while social media’s audience is widespread and diverse, just a handful of companies control a majority of the world’s most popular social media platforms. Meta, the tech giant formerly known as Facebook, owns four of the five most widely used platforms.
This graphic highlights the biggest social networks across the globe, measured by their monthly active users (MAUs).
Note: We’ll be using terms like “social network” and “social platform” interchangeably to refer to various messaging, video, and image-sharing platforms that have social attributes built in.
Top Social Platforms by Monthly Active Users
To measure each platform’s MAUs, we dug into various sources, including the most recent company SEC filings, and quarterly earnings reports.
A majority of Meta’s user base comes from its most popular platform, Facebook—the social media giant currently has around 2.9 billion MAUs worldwide.
| Rank | Platform name | Parent company | Country | Monthly active users, in millions |
|---|---|---|---|---|
| #1 | Meta | 🇺🇸 U.S. | 2,910 | |
| #2 | YouTube | Alphabet | 🇺🇸 U.S. | 2,291 |
| #3 | Meta | 🇺🇸 U.S. | 2,000 | |
| #4 | Messenger | Meta | 🇺🇸 U.S. | 1,300 |
| #5 | Meta | 🇺🇸 U.S. | 1,287 | |
| #6 | Tencent | 🇨🇳 China | 1,225 | |
| #7 | Kuaishou | Kuaishou | 🇨🇳 China | 1,000 |
| #8 | TikTok | Bytedance | 🇨🇳 China | 1,000 |
| #9 | Telegram | Telegram | 🇦🇪 UAE | 600 |
| #10 | Qzone | Tencent | 🇨🇳 China | 600 |
| #11 | Tencent | 🇨🇳 China | 591 | |
| #12 | Sina | 🇨🇳 China | 566 | |
| #13 | Douyin | Bytedance | 🇨🇳 China | 550 |
| #14 | Snapchat | Snap | 🇺🇸 U.S. | 538 |
| #15 | 🇺🇸 U.S. | 463 | ||
| #16 | 🇺🇸 U.S. | 454 | ||
| #17 | 🇺🇸 U.S. | 430 | ||
| #18 | Microsoft | 🇺🇸 U.S. | 310 | |
| #19 | Quora | Quora | 🇺🇸 U.S. | 300 |
| #20 | Skype | Microsoft | 🇺🇸 U.S. | 300 |
| #21 | Tieba | Baidu | 🇨🇳 China | 300 |
| #22 | Viber | Rakuten | 🇯🇵 Japan | 250 |
| #23 | Teams | Microsoft | 🇺🇸 U.S. | 250 |
| #24 | imo | PageBites | 🇺🇸 U.S. | 212 |
| #25 | Line | Naver | 🇰🇷 South Korea | 169 |
| #26 | Picsart | Picsart | 🇺🇸 U.S. | 150 |
| #27 | Likee | Bigo Live | 🇸🇬 Singapore | 150 |
| #28 | Discord | Discord | 🇺🇸 U.S. | 140 |
Where in the world are Facebook users located? The platform’s biggest user base comes from India, with an audience size of almost 350 million. Its second-largest user base is the United States, with 193.9 million users, while Indonesia comes in third with 142.5 million.
But Facebook isn’t the only social giant in Meta’s network of platforms. WhatsApp has approximately 2 billion MAUs, making it Meta’s second-largest platform, and the third-largest social network overall.
Like Facebook, a significant number of WhatsApp users are located in India, with roughly 390 million users. Brazil has a large portion of WhatsApp users as well, with an audience size of 108 million.
The Billion Users Club
Meta currently dominates the social network landscape, with a combined total of 7.5 billion MAUs across all four of its platforms. However, a few other companies also hit the one billion MAU mark across all their platforms on the list:
| Rank | Parent company | # of companies on the list | Country | Combined MUAs |
|---|---|---|---|---|
| 1 | Meta | 4 | 🇺🇸 U.S. | 7.5 billion |
| 2 | Tencent | 3 | 🇨🇳 China | 2.4 billion |
| 3 | Alphabet | 1 | 🇺🇸 U.S. | 2.3 billion |
| 4 | Bytedance | 2 | 🇨🇳 China | 1.6 billion |
| 5 | Kuaishou | 1 | 🇨🇳 China | 1 billion |
After Meta, Tencent has the second-highest reach thanks to its three platforms—WeChat, Qzone, and QQ. Of the three, WeChat is currently the most popular. On average, WeChat users send about 45 billion messages a day.
Third on the list is Alphabet, thanks to its one platform, YouTube. Founded in 2005, this video streaming platform currently has over 50 million content creators, who share approximately 500 hours of video content every minute.
Close behind Alphabet is Bytedance, with a combined 1.6 billion MAUs across its two platforms—Douyin and its international counterpart TikTok. While the apps share a lot of similarities, they function as completely separate entities, with different registration, content policies, and regulations.
Global Social Networks? Not Always
While social media networks often transcend country borders, it’s worth noting that the online realm does not completely escape the constraints and regulations of our physical world.
Since 2009, Facebook has been banned in China for not complying with censorship rules. Facebook was also blocked in Iran and Syria around the same time and has been blocked sporadically since.
In 2020, the Trump administration tried to enact a similar ban against TikTok, but the order was blocked by a federal judge and eventually revoked by the Biden administration a year later.
Despite various bans and roadblocks, it’s clear that social media platforms have seeped into the lives (and onto the screens) of users across the globe. And as internet access worldwide continues to grow, so too will the number of social media users.


Technology
Ranked: Semiconductor Companies by Industry Revenue Share
Nvidia is coming for Intel’s crown. Samsung is losing ground. AI is transforming the space. We break down revenue for semiconductor companies.


Semiconductor Companies by Industry Revenue Share
This was originally posted on our Voronoi app. Download the app for free on Apple or Android and discover incredible data-driven charts from a variety of trusted sources.
Did you know that some computer chips are now retailing for the price of a new BMW?
As computers invade nearly every sphere of life, so too have the chips that power them, raising the revenues of the businesses dedicated to designing them.
But how did various chipmakers measure against each other last year?
We rank the biggest semiconductor companies by their percentage share of the industry’s revenues in 2023, using data from Omdia research.
Which Chip Company Made the Most Money in 2023?
Market leader and industry-defining veteran Intel still holds the crown for the most revenue in the sector, crossing $50 billion in 2023, or 10% of the broader industry’s topline.
All is not well at Intel, however, with the company’s stock price down over 20% year-to-date after it revealed billion-dollar losses in its foundry business.
| Rank | Company | 2023 Revenue | % of Industry Revenue |
|---|---|---|---|
| 1 | Intel | $51B | 9.4% |
| 2 | NVIDIA | $49B | 9.0% |
| 3 | Samsung Electronics | $44B | 8.1% |
| 4 | Qualcomm | $31B | 5.7% |
| 5 | Broadcom | $28B | 5.2% |
| 6 | SK Hynix | $24B | 4.4% |
| 7 | AMD | $22B | 4.1% |
| 8 | Apple | $19B | 3.4% |
| 9 | Infineon Tech | $17B | 3.2% |
| 10 | STMicroelectronics | $17B | 3.2% |
| 11 | Texas Instruments | $17B | 3.1% |
| 12 | Micron Technology | $16B | 2.9% |
| 13 | MediaTek | $14B | 2.6% |
| 14 | NXP | $13B | 2.4% |
| 15 | Analog Devices | $12B | 2.2% |
| 16 | Renesas Electronics Corporation | $11B | 1.9% |
| 17 | Sony Semiconductor Solutions Corporation | $10B | 1.9% |
| 18 | Microchip Technology | $8B | 1.5% |
| 19 | Onsemi | $8B | 1.4% |
| 20 | KIOXIA Corporation | $7B | 1.3% |
| N/A | Others | $126B | 23.2% |
| N/A | Total | $545B | 100% |
Note: Figures are rounded. Totals and percentages may not sum to 100.
Meanwhile, Nvidia is very close to overtaking Intel, after declaring $49 billion of topline revenue for 2023. This is more than double its 2022 revenue ($21 billion), increasing its share of industry revenues to 9%.
Nvidia’s meteoric rise has gotten a huge thumbs-up from investors. It became a trillion dollar stock last year, and broke the single-day gain record for market capitalization this year.
Other chipmakers haven’t been as successful. Out of the top 20 semiconductor companies by revenue, 12 did not match their 2022 revenues, including big names like Intel, Samsung, and AMD.
The Many Different Types of Chipmakers
All of these companies may belong to the same industry, but they don’t focus on the same niche.
According to Investopedia, there are four major types of chips, depending on their functionality: microprocessors, memory chips, standard chips, and complex systems on a chip.
Nvidia’s core business was once GPUs for computers (graphics processing units), but in recent years this has drastically shifted towards microprocessors for analytics and AI.
These specialized chips seem to be where the majority of growth is occurring within the sector. For example, companies that are largely in the memory segment—Samsung, SK Hynix, and Micron Technology—saw peak revenues in the mid-2010s.

-

 Mining2 weeks ago
Charted: The Value Gap Between the Gold Price and Gold Miners
-

 Real Estate1 week ago
Ranked: The Most Valuable Housing Markets in America
-

 Business1 week ago
Charted: Big Four Market Share by S&P 500 Audits
-

 AI1 week ago
The Stock Performance of U.S. Chipmakers So Far in 2024
-

 Misc1 week ago
Almost Every EV Stock is Down After Q1 2024
-

 Money2 weeks ago
Where Does One U.S. Tax Dollar Go?
-

 Green2 weeks ago
Ranked: Top Countries by Total Forest Loss Since 2001
-

 Real Estate2 weeks ago
Visualizing America’s Shortage of Affordable Homes