Technology
Ranked: The World’s Most Downloaded Apps
Note: Estimates include unique installs on iPhone, iPad, and Google Play from Jan. 1 through Dec. 31, 2019. Pre-installed apps for Apple and Google are excluded.
Ranked: The World’s Most Downloaded Apps
From strategically finding love, to helping researchers search for extraterrestrial life—there is quite literally an app for almost anything these days.
It is therefore no surprise that apps have become one of the largest consumer ecosystems on the planet, with the global app economy expected to reach $6.3 trillion by 2021.
Today’s graphics pull data from a recent report by Sensor Tower that ranks the top 20 most downloaded apps of 2019. New entrants are rising up and threatening the dominance of more established tech companies—but can they sustain their current position on the leaderboard?
The Champions of the App Economy
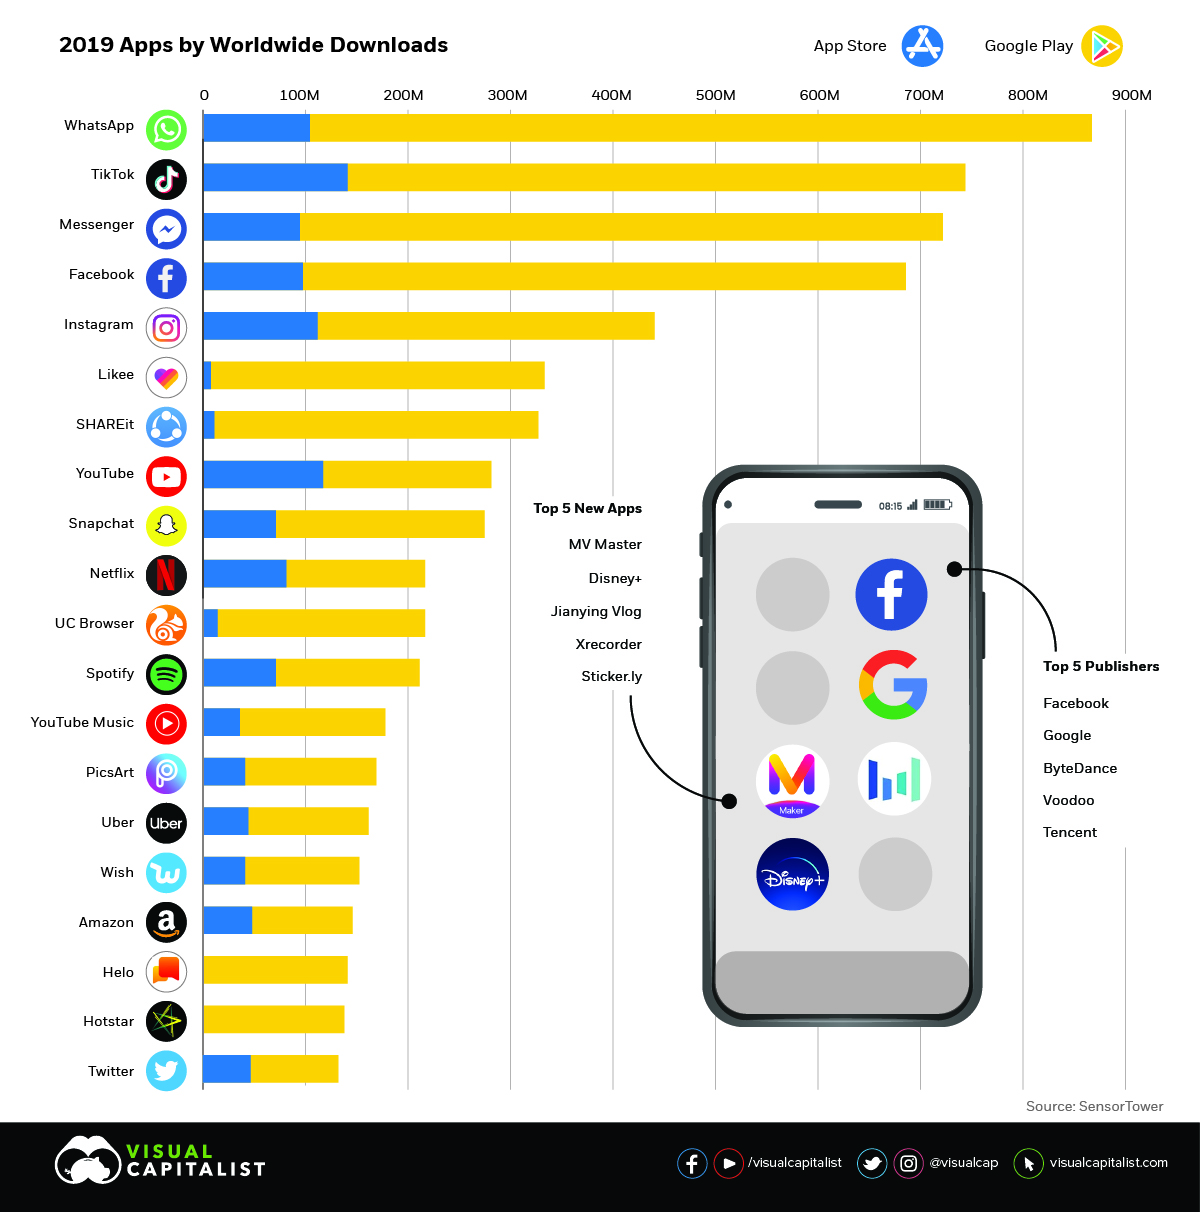
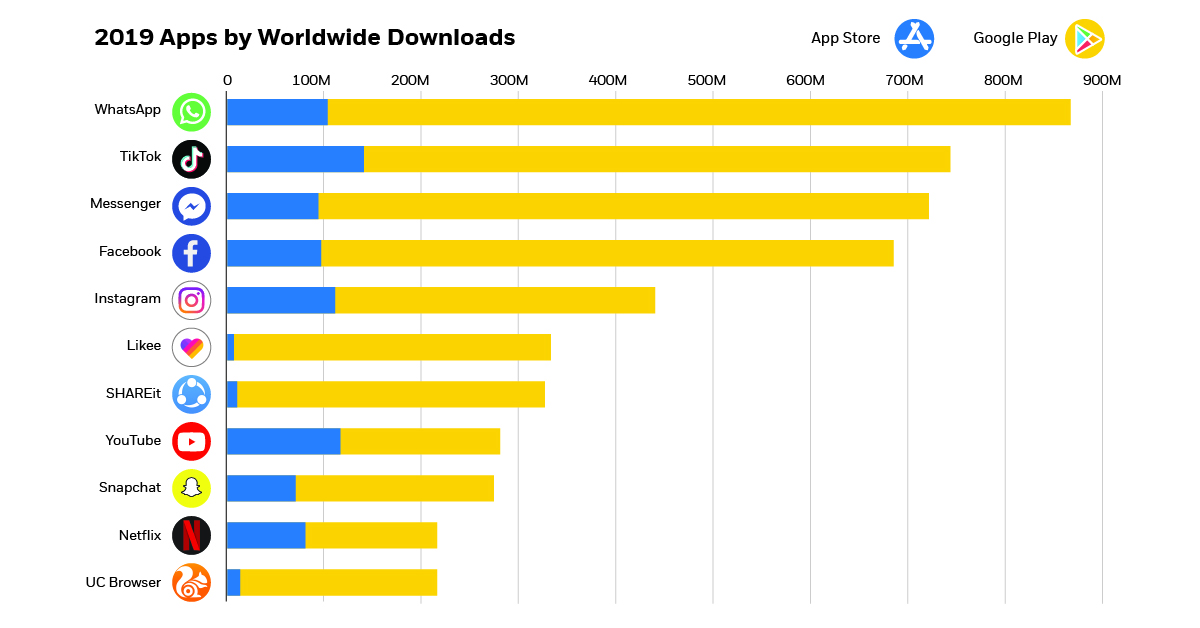
According to the report, total app downloads grew to 115 billion in 2019, including almost 31 billion downloads on the App Store and 84 billion on Google Play.
Social media giant Facebook owns four out of five of 2019’s most downloaded apps: Facebook, Facebook Messenger, WhatsApp, and Instagram. Collectively, they boast an eye-watering 16 billion downloads—with WhatsApp holding the top spot for the fourth year running.
Growth in the short-form video category is apparent. The video creation app Likee joined this year’s ranking and sits in sixth place, with the majority of the app’s 330 million downloads coming from India.
The app lets users edit videos using a wide variety of effects, and directly competes with TikTok—a lip syncing app that entered the ranking in 2018 and now threatens WhatsApp’s position at the top of the leaderboard.
Which Apps Are Climbing the Ranks?
TikTok is the newest platform to turn its users into viral sensations, grossing $177 million in 2019. This is equal to more than five times its 2018 revenue. TikTok also bypassed Instagram in 2018, breaking Facebook’s foothold on the top four apps globally.
TikTok is owned by Chinese tech firm ByteDance, the most valuable private company in the world—and 78% of TikTok’s total Q4’2019 revenue came from its native country.
Aside from several short-form video entrants, new players from other industries continue to storm up the ranks. While they don’t make the list of most downloaded apps yet, their recent success could change that.
Streaming Services
Netflix is the only streaming service to make it into the top 20 most downloaded apps, but the launch of Disney+ could potentially change that.
Despite a November launch, Disney+ became the second most popular new app of 2019. Within a month, the service generated $50 million in revenue.
To put this into context, Disney+ acquired 34% of all streaming app downloads in less than three months, or 30 million subscribers—half of Netflix’s current 60 million U.S. subscribers. That figure also surpasses Hulu and Amazon Prime’s figures for the entirety of 2019.
Gaming
With 2.4 billion people playing mobile games in 2019, gaming is also set to become a major player in the app economy.
Two popular console franchises, Call of Duty and Mario Kart, recently entered the mobile market to become two of the most successful games in the category.
The free mobile version of Call of Duty had the second best quarter of any mobile game ever, with 170 million worldwide downloads. Only Pokémon GO had a better quarter, with more than 300 million installs when it launched in 2016.
The success of these apps can be attributed to their already established consumer base, and the evident shift in more gamers moving to mobile platforms as smartphone technology and processing speeds improve.
Countries Leading the App Economy
The app economy is also being fueled by growth in emerging markets including China, India, Brazil and Russia, thanks to faster internet speeds and increasing smartphone adoption rates.
Specifically, India’s increasing digitization is driving significant growth in the market. The country witnessed nearly 5 billion app installs in the last quarter of 2019—surging ahead of the U.S. with just over 3 billion installs.
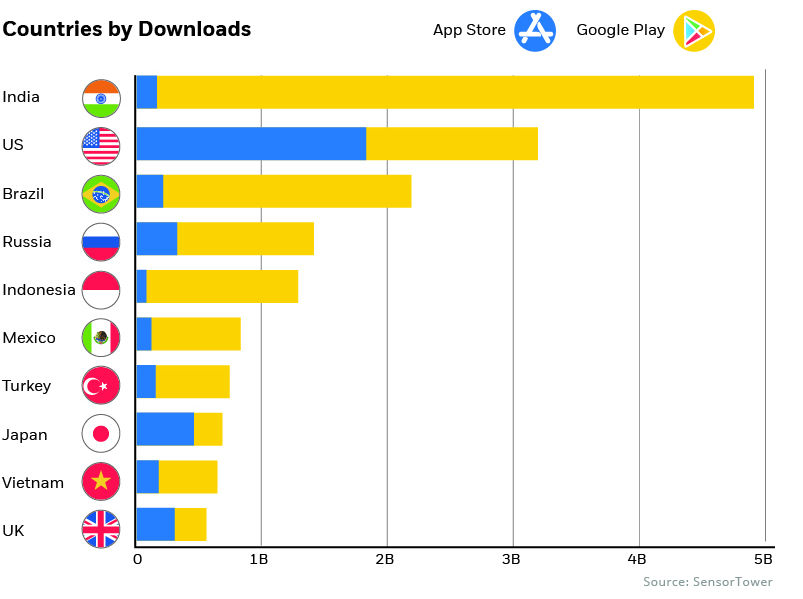
Note: As Google Play is not available in China, the country was excluded from this chart.
India’s demand could be attributed to the fact that half of its 1.3 billion population is under the age of 25. A younger, tech savvy audience has resulted in India becoming TikTok’s top market, commanding 45% of the app’s first time downloads in 2019.
The App Economy 2.0
With an explosion in user spending, and seemingly endless opportunities for innovation, the global app economy shows a tremendous amount of promise, but is still in its early days.
Consumers spent $101 billion on apps globally in 2018. This is double the size of the global sneaker market, and nearly three times the size of the oral care industry.
—Danielle Levitas, EVP of Global Marketing & Market Insights at App Annie
Rising consumer spend combined with other forms of monetization, such as advertising and mobile commerce, could soon enable the app market to surpass the trillion dollar barrier in revenue.
While many experts claimed that the app industry was dead in its tracks, it’s safe to say that those predictions are now being irrefutably challenged.
Support the Future of Data Storytelling
Sorry to interrupt your reading, but we have a favor to ask. At Visual Capitalist we believe in a world where data can be understood by everyone. That’s why we want to build the VC App - the first app of its kind combining verifiable and transparent data with beautiful, memorable visuals. All available for free.
As a small, independent media company we don’t have the expertise in-house or the funds to build an app like this. So we’re asking our community to help us raise funds on Kickstarter.
If you believe in data-driven storytelling, join the movement and back us on Kickstarter!
Thank you.

Technology
Ranked: The Best-Selling Video Game Consoles of All Time
Video game consoles have changed drastically over the last 50 years. Here are some of the best-selling ones across the globe.

Ranked: The Best-Selling Video Game Consoles of All Time
In 1972, the first-ever commercially available home video game console hit the market—the Magnavox Odyssey. Players of the Odyssey had a choice between two built-in games that were stored directly in the device, and would use a joystick and dials as a controller.
Video game consoles have come a long way since then, and the console market has grown into a multi-billion dollar industry that’s expected to reach $72.67 billion in value by the end of 2022.
This graphic by Enrique Mendoza uses data from VGChartz to show the market leaders in the industry, by highlighting the top-selling video consoles of all time, as of May 8, 2022.
Nine Generations of Video Game Consoles
Before diving into the top-selling consoles, it’s worth taking a step back to touch on the evolution of home consoles to show how they’ve changed over the years.
We dug into the literature on the history of video game consoles, and found that most articles and blog posts on the topic cite nine different generations of devices.
Here’s a breakdown of each generation, and some of their most noteworthy systems:
1972: Gen One, Where it Began
Consoles in the first generation had pre-built games that were stored directly on the device. They include the Magnavox Odyssey and Atari’s Pong.
1976: Gen Two Emerges
In this generation, games were sold separately, rather than programmed into the device. Consoles of this gen include the Fairchild Channel F and the Atari 2600.
1983: Gen Three, the “8-bit Generation”
This era’s consoles typically had 8-bit processes which allowed for more advanced graphics for the time. A few notable consoles during this gen were the Sega SG-1000 and the Nintendo Famicom, released outside Japan as the Nintendo Entertainment System (NES).
1987: Gen Four Elevates Handheld Gaming
Home consoles were released with 16-bit systems, meaning that audio and graphics improved even more in this era. But an arguably bigger moment for this gen was the emergence of the Nintendo Game Boy.
1993: The 3D Start of Gen Five
This generation saw the move away from pixels and towards 3D polygons. Some consoles like the Sony PlayStation started using CD-ROMs instead of cartridges, which stored more data at a cheaper cost and changed the industry.
1998: Gen Six and the Internet
At the start of this generation, the three major players in the console space were Sony, Sega, and Nintendo. By the end, Sega would be replaced with Microsoft as it launched the Xbox and helped popularize online console gaming.
2005: HD Graphics and Motion Controls of Gen Seven
On one side of the market, Microsoft and Sony were competing with high-definition graphics, faster processers, and different forms (Blu-rays or DVDs). But Nintendo’s motion-sensing Nintendo Wii arguably defined this generation, and the handheld Nintendo DS swept the market as well.
2012: Gen Eight’s Modern Consoles
Consoles of this era started having increased connectivity and processing power, with full HD an expectation. It was also an extremely long generation, starting with Nintendo’s unsuccessful Wii U and ending with the ultra-successful Nintendo Switch, widely considered the first hybrid console with three different ways to play: TV mode, handheld mode, or tabletop mode.
2020: Gen Nine and Beyond
So far, this generation has brought upgraded graphics (up to 8K resolution), larger games, and game-streaming capabilities. Devices in this gen include the Xbox Series X/S and PlayStation 5, which both use solid state drives to increase speed and performance, while Nintendo has yet to introduce a 9th generation device.
The Best-Selling Game Consoles
The best-selling video game console of all time is Sony’s PlayStation 2 (PS2). More than 157 million systems have been sold around the world since its launch in March 2000.
Rank | Console | Manufacturer | Global lifetime sales (millions) |
---|---|---|---|
1 | PlayStation 2 (PS2) | Sony | 157.68 |
2 | Nintendo DS (DS) | Nintendo | 154.90 |
3 | Game Boy (GB) | Nintendo | 118.69 |
4 | PlayStation 4 (PS4) | Sony | 116.97 |
5 | Nintendo Switch (NS) | Nintendo | 107.21 |
6 | PlayStation (PS) | Sony | 102.50 |
7 | Nintendo Wii (Wii) | Nintendo | 101.64 |
8 | PlayStation 3 (PS3) | Sony | 87.41 |
9 | Xbox 360 (X360) | Microsoft | 85.8 |
10 | Game Boy Advance (GBA) | Nintendo | 81.51 |
11 | PlayStation Portable (PSP) | Sony | 81.09 |
12 | Nintendo 3DS (3DS) | Nintendo | 75.95 |
13 | Nintendo Entertainment System (NES) | Nintendo | 61.91 |
14 | Xbox One (XOne) | Microsoft | 50.57 |
15 | Super Nintendo Entertainment System (SNES) | Nintendo | 49.10 |
16 | Nintendo 64 (N64) | Nintendo | 32.93 |
17 | Sega Genesis (GEN) | Sega | 29.54 |
18 | Atari 2600 (2600) | Atari | 27.64 |
19 | Xbox (XB) | Microsoft | 24.65 |
20 | GameCube (GC) | Nintendo | 21.74 |
21 | PlayStation 5 (PS5) | Sony | 19.32 |
22 | PlayStation Vita (PSV) | Sony | 16.21 |
23 | Xbox Series X/S (XS) | Microsoft | 14.32 |
24 | Nintendo Wii U (WiiU) | Nintendo | 13.97 |
25 | GameGear (GG) | Sega | 10.62 |
26 | Sega Saturn (SAT) | Sega | 8.82 |
27 | Dreamcast (DC) | Sega | 8.20 |
28 | Atari 7800 (7800) | Atari | 4.30 |
Despite the fact the PS2’s been discontinued since 2013, no other gaming console has managed to top it—in fact, the next closest actively-sold consoles, the PS4 and Nintendo Switch, are each more than 40 million units behind.
One major factor for the PS2’s success was its built-in DVD player. At the time, DVD players were very expensive, and in many places a PS2 was a cheaper and effective alternative. It was also one of the first devices to be “backward compatible,” meaning users could play most of their PS1 games on the PS2. This meant players didn’t have to buy a whole new library of games when they made the switch to a PS2, and Sony could tap into its existing customer base.
But while Sony’s PS2 is the top-selling console on the list, Nintendo has more top-selling consoles on the list—almost half of the consoles on the list are manufactured by Nintendo (11), while only seven are made by Sony.
What Will it Take to Out-Sell the PS2?
As the PS4 has started taking a backseat to the PS5 in sales and promotion, the current most-likely contender for the best-selling console crown is the Nintendo Switch. Early in 2022, it was the fastest console to sell 100 million units.
With lots of hype around the possibilities of AR and VR, it’ll be interesting to see what new features come with the next generation of gaming consoles.
Will future devices ever beat the PS2’s record-breaking sales? Time will tell. But for now, the 22-year-old console continues to hold its well-earned spot at the top.
Technology
Visualizing The 50 Biggest Data Breaches From 2004–2021
In 2021, more than 5.9 billion user records were stolen. This graphic visualizes the 50 largest data breaches, by entity and sector, since 2004.

Visualizing The 50 Biggest Data Breaches From 2004–2021
As our world has become increasingly reliant on technology and data stored online, data breaches have become an omnipresent threat to users, businesses, and government agencies. In 2021, a new record was set with more than 5.9 billion user records stolen.
This graphic by Chimdi Nwosu visualizes the 50 largest data breaches since 2004, along with the sectors most impacted. Data was aggregated from company statements and news reports.
Understanding the Basics of Data Breaches
A data breach is an incident in which sensitive or confidential information is copied, transmitted or stolen by an unauthorized entity. This can occur as a result of malware attacks, payment card fraud, insider leaks, or unintended disclosure.
The targeted data is often customer PII (personally identifiable information), employee PII, intellectual property, corporate data or government agency data.
Date breaches can be perpetrated by lone hackers, organized cybercrime groups, or even national governments. Stolen information can then be used in other criminal enterprises such as identity theft, credit card fraud, or held for ransom payment.
Notable Data Breaches Since 2004
The largest data breach recorded occurred in 2013 when all three billion Yahoo accounts had their information compromised. In that cyberattack, the hackers were able to gather the personal information and passwords of users. While the full extent of the Yahoo data breach is still not fully realized, subsequent cybercrimes across the globe have been linked to the stolen information.
Here are the 50 largest data breaches by amount of user records stolen from 2004–2021.
Rank | Entity | Sector | Records Compromised | Year |
---|---|---|---|---|
1 | Yahoo | Web | 3.0B | 2013 |
2 | River City Media | Web | 1.4B | 2017 |
3 | Aadhaar | Government | 1.1B | 2018 |
4 | First American Corporation | Finance | 885M | 2019 |
5 | Spambot | Web | 711M | 2017 |
6 | Web | 700M | 2021 | |
7 | Tech | 533M | 2021 | |
8 | Yahoo | Web | 500M | 2014 |
9 | Marriott International | Retail | 500M | 2018 |
10 | Syniverse | Telecoms | 500M | 2021 |
11 | Web | 419M | 2019 | |
12 | Friend Finder Network | Web | 412M | 2016 |
13 | OxyData | Tech | 380M | 2019 |
14 | MySpace | Web | 360M | 2016 |
15 | Exactis | Data | 340M | 2018 |
16 | Tech | 330M | 2018 | |
17 | Airtel | Telecoms | 320M | 2019 |
18 | Indian citizens | Web | 275M | 2019 |
19 | Wattpad | Web | 270M | 2020 |
20 | Microsoft | Web | 250M | 2019 |
21 | Experian Brazil | Finance | 220M | 2021 |
22 | Chinese resume leak | Web | 202M | 2019 |
23 | Court Ventures | Finance | 200M | 2013 |
24 | Apollo | Tech | 200M | 2018 |
25 | Deep Root Analytics | Web | 198M | 2015 |
26 | Zynga | Gaming | 173M | 2019 |
27 | VK | Web | 171M | 2016 |
28 | Equifax | Finance | 163M | 2017 |
29 | Dubsmash | Web | 162M | 2019 |
30 | Massive American business hack | Finance | 160M | 2013 |
31 | MyFitnessPal | App | 150M | 2018 |
32 | Ebay | Web | 145M | 2014 |
33 | Canva | Web | 139M | 2019 |
34 | Heartland | Finance | 130M | 2009 |
35 | Nametests | App | 120M | 2018 |
36 | Tetrad | Finance | 120M | 2020 |
37 | Web | 117M | 2016 | |
38 | Pakistani mobile operators | Telecoms | 115M | 2020 |
39 | ElasticSearch | Tech | 108M | 2019 |
40 | Capital One | Finance | 106M | 2019 |
41 | Thailand visitors | Government | 106M | 2021 |
42 | Firebase | App | 100M | 2018 |
43 | Quora | Web | 100M | 2018 |
44 | Rambler.ru | Web | 98M | 2012 |
45 | TK / TJ Maxx | Retail | 94M | 2007 |
46 | MyHeritage | Web | 92M | 2018 |
47 | AOL | Web | 92M | 2004 |
48 | Dailymotion | Web | 85M | 2016 |
49 | Anthem | Health | 80M | 2015 |
50 | Sony Playstation Network | Gaming | 77M | 2011 |
The massive Yahoo hack accounted for roughly 30% of the 9.9 billion user records stolen from the Web sector—by far the most impacted sector. The next most-impacted sectors were Tech and Finance, with 2 billion and 1.6 billion records stolen, respectively.
Although these three sectors had the highest totals of user data lost, that doesn’t necessarily imply they have weaker security measures. Instead, it can probably be attributed to the sheer number of user records they compile.
Not all infamous data breaches are of a large scale. A smaller data breach in 2014 made headlines when Apple’s iCloud was hacked and the personal pictures of roughly 200 celebrities were disseminated across the internet. Although this highly targeted hack only affected a few hundred people, it highlighted how invasive and damaging data breaches can be to users.
The Cost of Data Breaches to Businesses
Every year data breaches cost businesses billions of dollars to prevent and contain, while also eroding consumer trust and potentially having an adverse effect on customer retention.
A 2021 IBM security report estimated that the average cost per data breach for companies in 2020 was $4.2 million, which represents a 10% increase from 2019. That increase is mainly attributed to the added security risk associated with having more people working remotely due to the COVID-19 pandemic.
Measures to Improve Data Security
Completely preventing data breaches is essentially impossible, as cybercrime enterprises are often persistent, dynamic, and sophisticated. Nevertheless, businesses can seek out innovative methods to prevent exposure of data and mitigate potential damages.
For example, after the iCloud attack in 2014, Apple began avidly encouraging users to adopt two-factor authentication in an effort to strengthen data security.
Regardless of the measures businesses take, the unfortunate reality is that data breaches are a cost of doing business in the modern world and will continue to be a concern to both companies and users.
-
Money1 week ago
Mapping the Migration of the World’s Millionaires
-
Markets2 weeks ago
Visualizing the Coming Shift in Global Economic Power (2006-2036p)
-
Datastream3 weeks ago
Ranked: These Are 10 of the World’s Least Affordable Housing Markets
-
Demographics1 week ago
Mapped: A Decade of Population Growth and Decline in U.S. Counties
-
Misc2 weeks ago
Visualizing Well-Known Airlines by Fleet Composition
-
Politics4 weeks ago
Which Countries Trust Their Government, and Which Ones Don’t?
-
Markets4 weeks ago
Ranked: Visualizing the Largest Trading Partners of the U.S.
-
Misc7 days ago
Iconic Infographic Map Compares the World’s Mountains and Rivers