Technology
Ranked: Big Tech CEO Insider Trading During the First Half of 2021
Big Tech CEO Insider Trading During The First Half of 2021
When CEOs of major companies are selling their shares, investors can’t help but notice.
After all, these decisions have a direct effect on the personal wealth of these insiders, which can say plenty about their convictions with respect to the future direction of the companies they run.
Considering that Big Tech stocks are some of the most popular holdings in today’s portfolios, and are backed by a collective $5.3 trillion in institutional investment, how do the CEOs of these organizations rank by their insider selling?
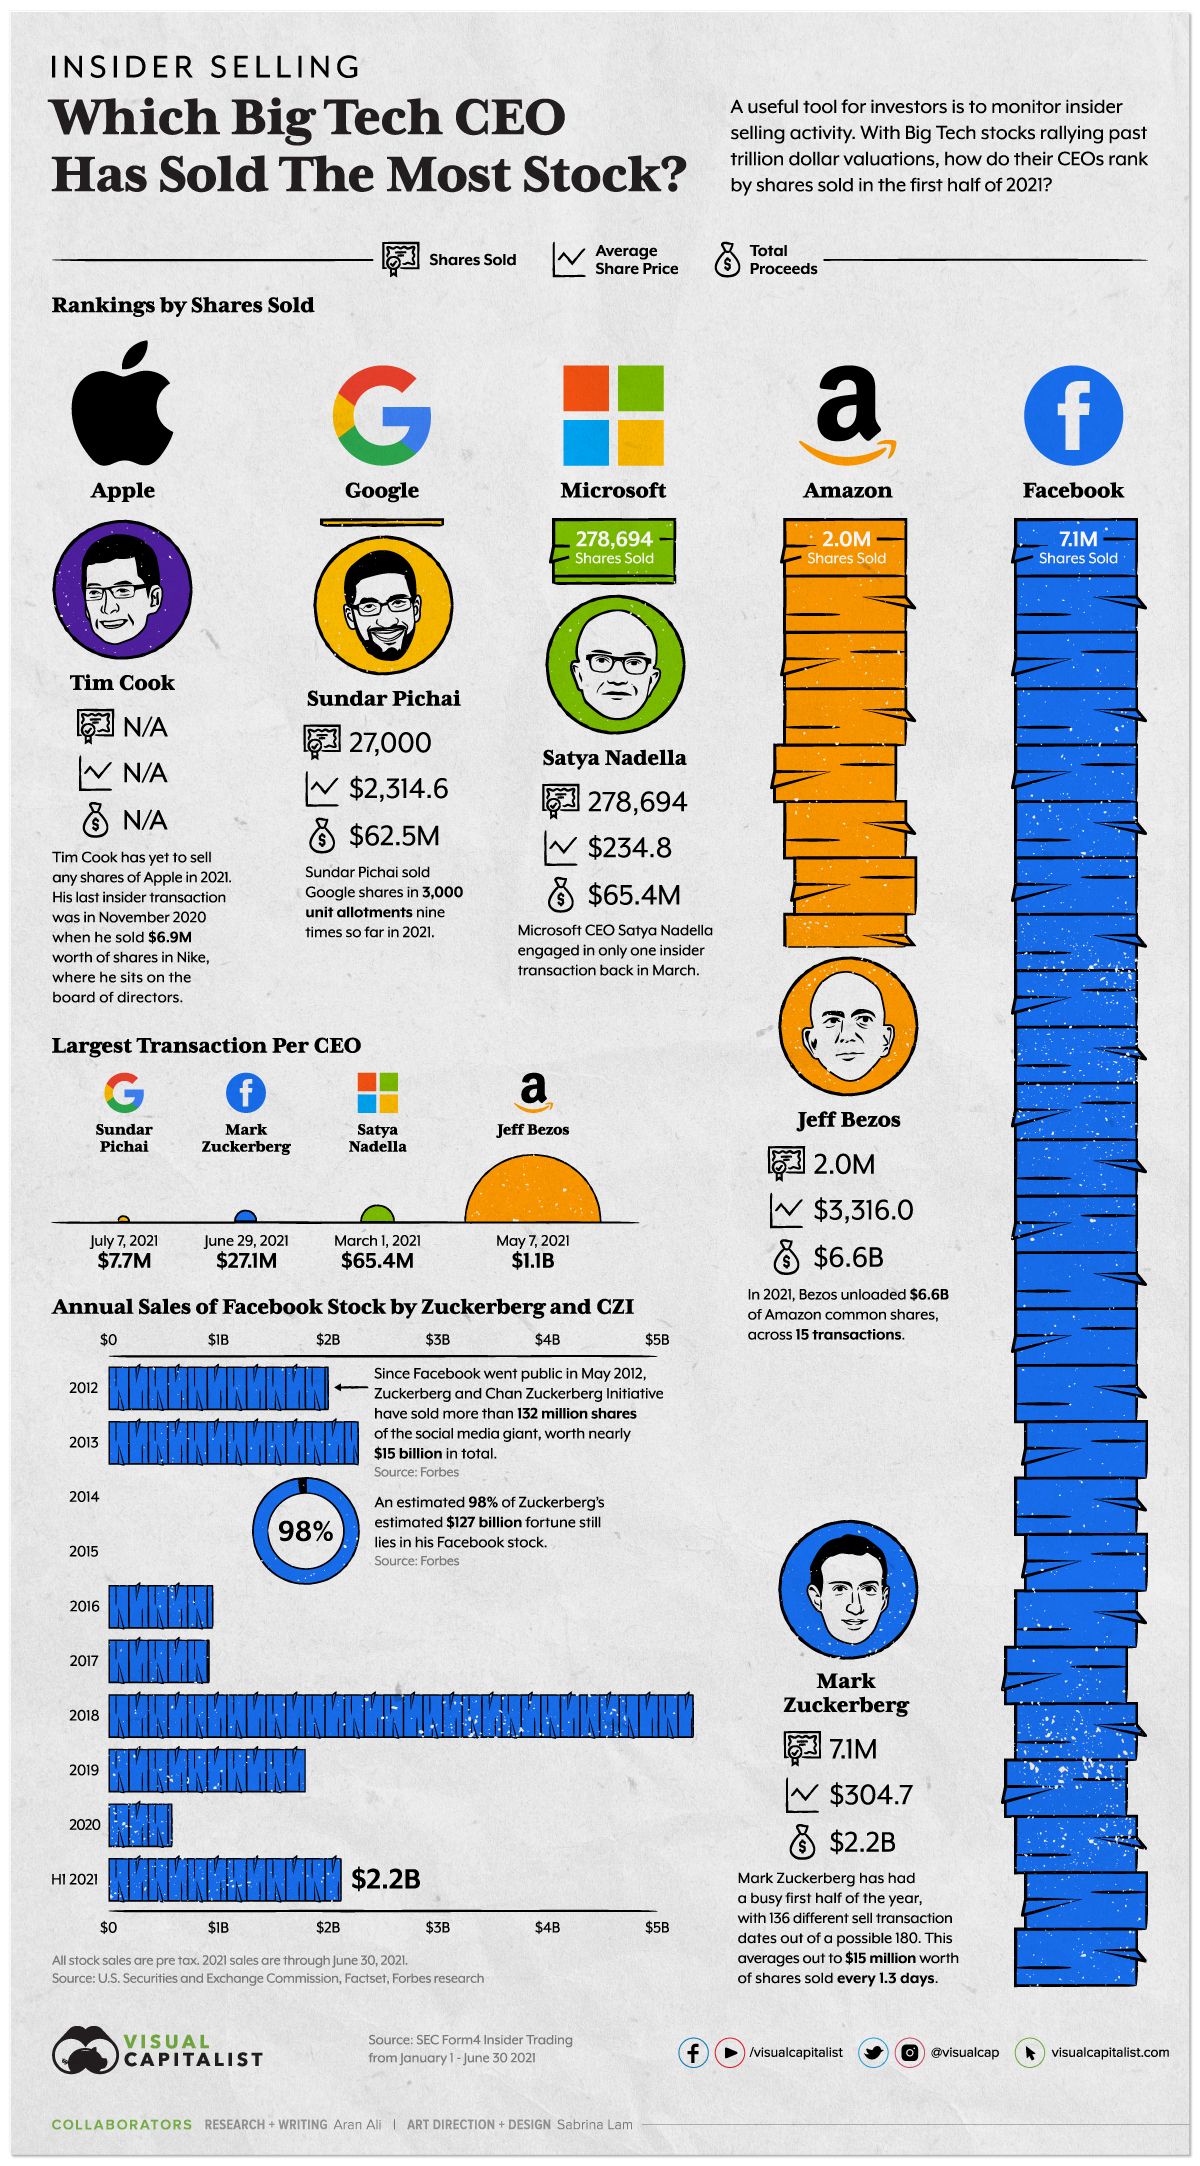
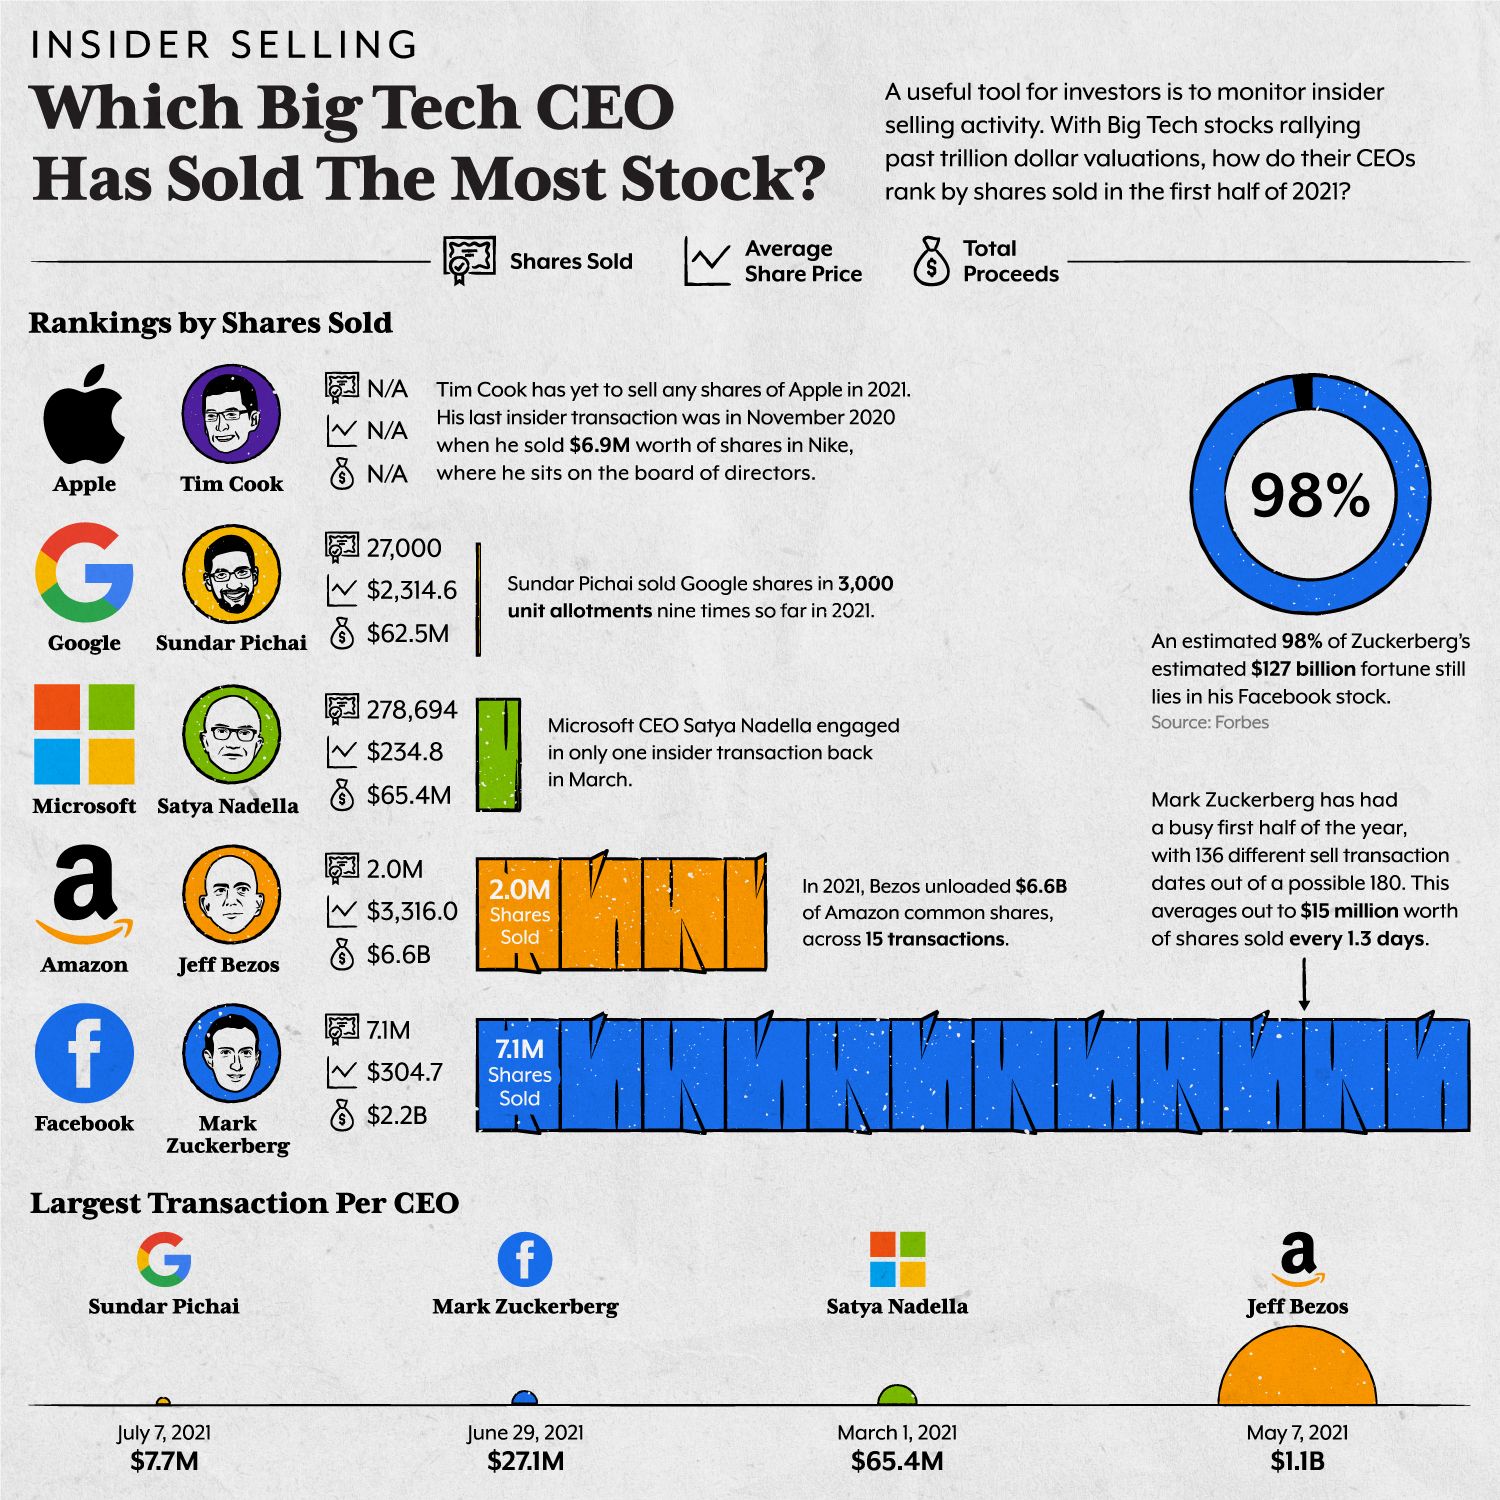
| CEO | Stock | Shares Sold H1 2021 | Value of Shares ($M) |
|---|---|---|---|
| Jeff Bezos | Amazon (AMZN) | 2.0 million | $6,600 |
| Mark Zuckerberg | Facebook (FB) | 7.1 million | $2,200 |
| Satya Nadella | Microsoft (MSFT) | 278,694 | $65 |
| Sundar Pichai | Google (GOOGL) | 27,000 | $62 |
| Tim Cook | Apple (AAPL) | 0 | $0 |
Breaking Down Insider Trading, by CEO
Let’s dive into the insider trading activity of each Big Tech CEO:
Jeff Bezos
During the first half of 2021, Jeff Bezos sold 2 million shares of Amazon worth $6.6 billion.
This activity was spread across 15 different transactions, representing an average of $440 million per transaction. Altogether, this ranks him first by CEO insider selling, by total dollar proceeds. Bezos’s time as CEO of Amazon came to an end shortly after the half way mark for the year.
Mark Zuckerberg
In second place is Mark Zuckerberg, who has been significantly busier selling than the rest.
In the first half of 2021, he unloaded 7.1 million shares of Facebook onto the open market, worth $2.2 billion. What makes these transactions interesting is the sheer quantity of them, as he sold on 136 out of 180 days. On average, that’s $12 million worth of stock sold every day.
Zuckerberg’s record year of selling in 2018 resulted in over $5 billion worth of stock sold, but over 90% of his net worth still remains in the company.
Satya Nadella
Next is Satya Nadella, who sold 278,694 shares of Microsoft, worth $234 million. Despite this, the Microsoft CEO still holds an estimated 1.6 million shares, which is the largest of any insider.
Microsoft’s stock has been on a tear for a number of years now, and belongs to an elite trillion dollar club, which consists of only six public companies.
Sundar Pichai
Fourth on the list is Sundar Pichai who has been at the helm at Google for six years now. Since the start of 2021, he’s sold 27,000 shares through nine separate transactions, worth $62.5 million. However, Pichai still has an estimated 6,407 Class A and 114,861 Class C shares.
Google is closing in on a $2 trillion valuation and is the best performing Big Tech stock, with shares rising 60% year-to-date. Their market share growth from U.S. ad revenues is a large contributing factor.
Tim Cook
Last, is Tim Cook, who just surpassed a decade as Apple CEO.
During this time, shares have rallied over 1,000% and annual sales have gone from $100 billion to $347 billion. That said, Cook has sold 0 shares of Apple during the first half of 2021. That doesn’t mean he hasn’t sold shares elsewhere, though. Cook also sits on the board of directors for Nike, and has sold $6.9 million worth of shares this year.
Measuring Insider Selling
All things equal, it’s desirable for management to have skin in the game, and be invested alongside shareholders. It can also be seen as aligning long-term interests.
A good measure of insider selling activity is in relation to the existing stake in the company. For example, selling $6.6 billion worth of shares may sound like a lot, but when there are 51.7 million Amazon shares remaining for Jeff Bezos, it actually represents a small portion and is probably not cause for panic.
If, however, executives are disclosing large transactions relative to their total stakes, it might be worth digging deeper.


Technology
Visualizing AI Patents by Country
See which countries have been granted the most AI patents each year, from 2012 to 2022.


Visualizing AI Patents by Country
This was originally posted on our Voronoi app. Download the app for free on iOS or Android and discover incredible data-driven charts from a variety of trusted sources.
This infographic shows the number of AI-related patents granted each year from 2010 to 2022 (latest data available). These figures come from the Center for Security and Emerging Technology (CSET), accessed via Stanford University’s 2024 AI Index Report.
From this data, we can see that China first overtook the U.S. in 2013. Since then, the country has seen enormous growth in the number of AI patents granted each year.
| Year | China | EU and UK | U.S. | RoW | Global Total |
|---|---|---|---|---|---|
| 2010 | 307 | 137 | 984 | 571 | 1,999 |
| 2011 | 516 | 129 | 980 | 581 | 2,206 |
| 2012 | 926 | 112 | 950 | 660 | 2,648 |
| 2013 | 1,035 | 91 | 970 | 627 | 2,723 |
| 2014 | 1,278 | 97 | 1,078 | 667 | 3,120 |
| 2015 | 1,721 | 110 | 1,135 | 539 | 3,505 |
| 2016 | 1,621 | 128 | 1,298 | 714 | 3,761 |
| 2017 | 2,428 | 144 | 1,489 | 1,075 | 5,136 |
| 2018 | 4,741 | 155 | 1,674 | 1,574 | 8,144 |
| 2019 | 9,530 | 322 | 3,211 | 2,720 | 15,783 |
| 2020 | 13,071 | 406 | 5,441 | 4,455 | 23,373 |
| 2021 | 21,907 | 623 | 8,219 | 7,519 | 38,268 |
| 2022 | 35,315 | 1,173 | 12,077 | 13,699 | 62,264 |
In 2022, China was granted more patents than every other country combined.
While this suggests that the country is very active in researching the field of artificial intelligence, it doesn’t necessarily mean that China is the farthest in terms of capability.
Key Facts About AI Patents
According to CSET, AI patents relate to mathematical relationships and algorithms, which are considered abstract ideas under patent law. They can also have different meaning, depending on where they are filed.
In the U.S., AI patenting is concentrated amongst large companies including IBM, Microsoft, and Google. On the other hand, AI patenting in China is more distributed across government organizations, universities, and tech firms (e.g. Tencent).
In terms of focus area, China’s patents are typically related to computer vision, a field of AI that enables computers and systems to interpret visual data and inputs. Meanwhile America’s efforts are more evenly distributed across research fields.
Learn More About AI From Visual Capitalist
If you want to see more data visualizations on artificial intelligence, check out this graphic that shows which job departments will be impacted by AI the most.

-

 Markets1 week ago
U.S. Debt Interest Payments Reach $1 Trillion
-

 Business2 weeks ago
Charted: Big Four Market Share by S&P 500 Audits
-

 Real Estate2 weeks ago
Ranked: The Most Valuable Housing Markets in America
-

 Money2 weeks ago
Which States Have the Highest Minimum Wage in America?
-

 AI2 weeks ago
Ranked: Semiconductor Companies by Industry Revenue Share
-

 Markets2 weeks ago
Ranked: The World’s Top Flight Routes, by Revenue
-

 Demographics2 weeks ago
Population Projections: The World’s 6 Largest Countries in 2075
-

 Markets2 weeks ago
The Top 10 States by Real GDP Growth in 2023