Markets
Ranked: America’s Best States to Do Business In


Ranked: America’s Best States to Do Business In
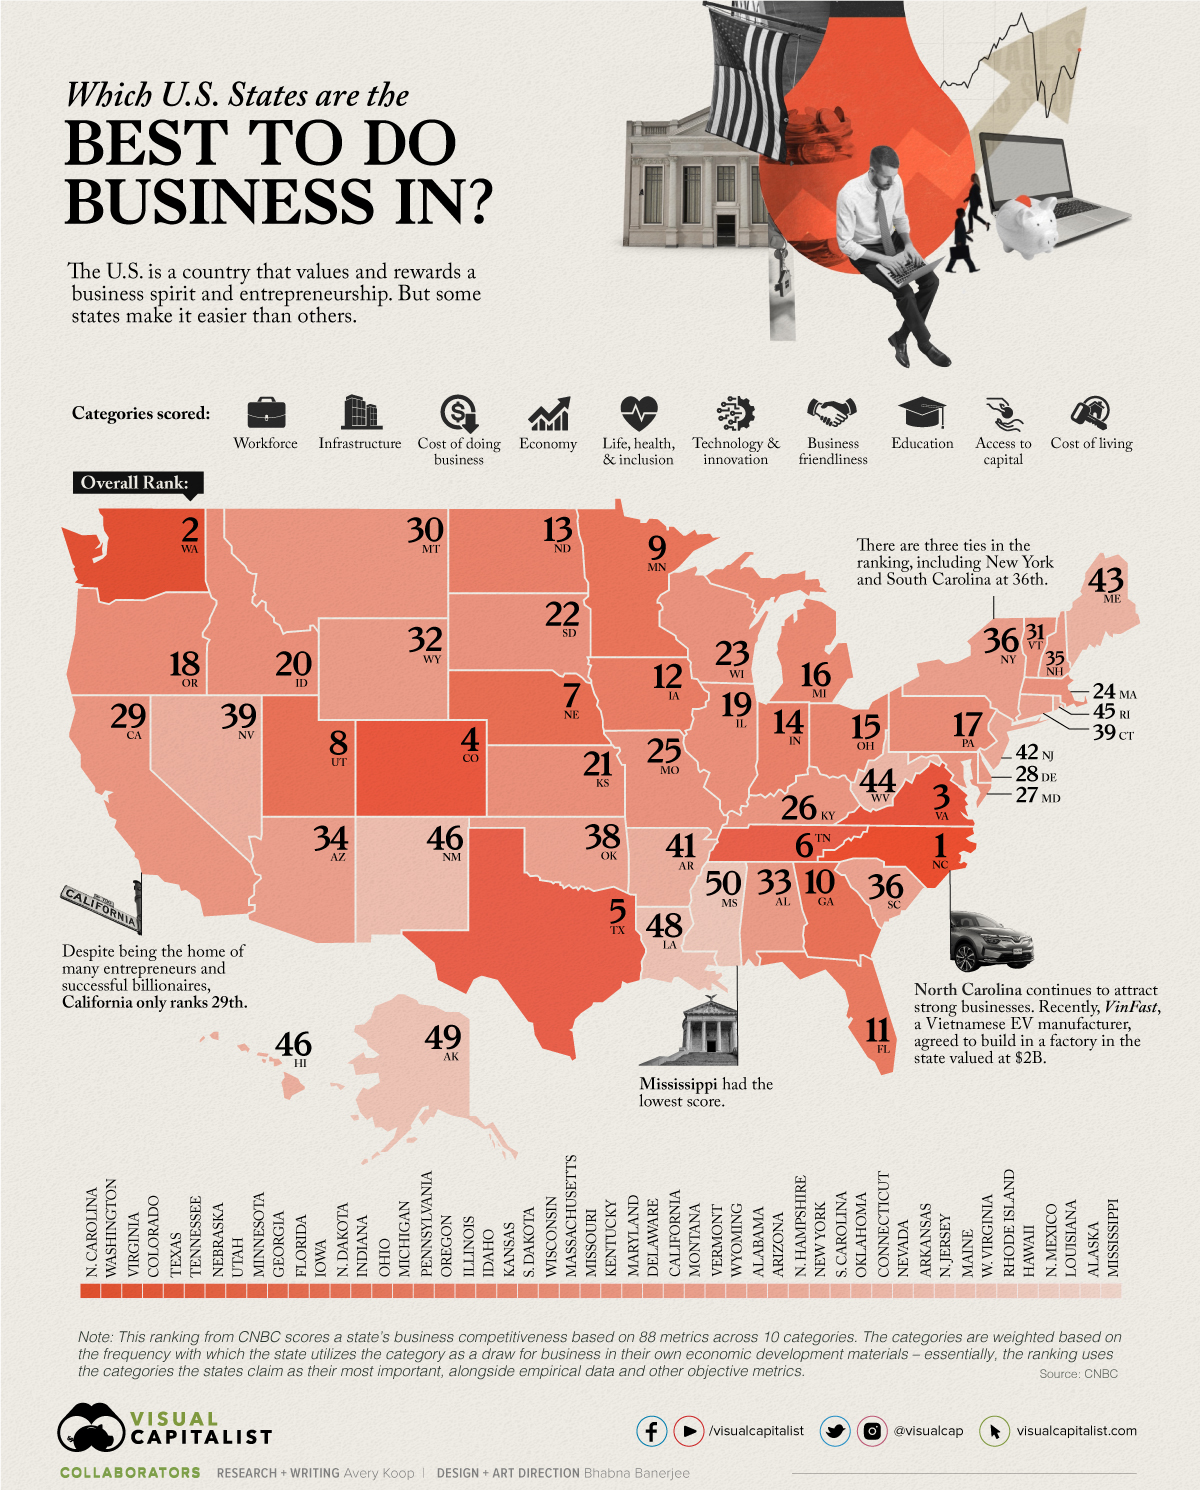
The United States often ranks as one of the best countries to start a business in, but the ease with which one can do business varies state by state. There are many considerations that factor into starting a business like the available workforce, the condition of local infrastructure, access to investors, a culture that’s open to business, and so on.
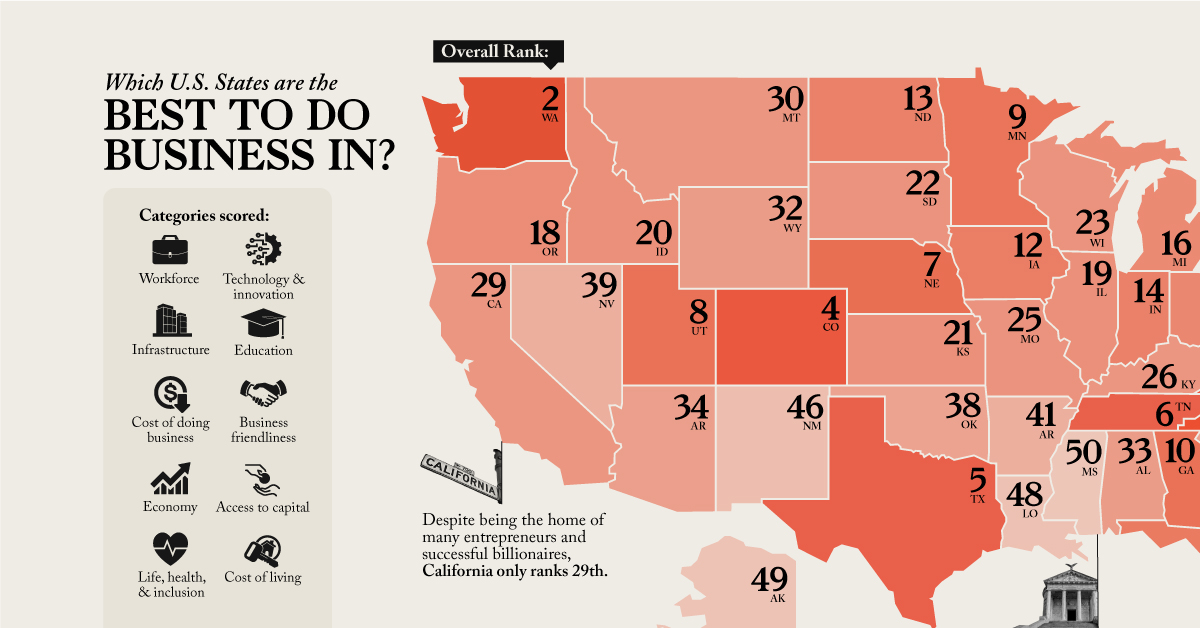
This map ranks America’s best states to do business in based on a study from CNBC which measured 88 factors across 10 broad categories.
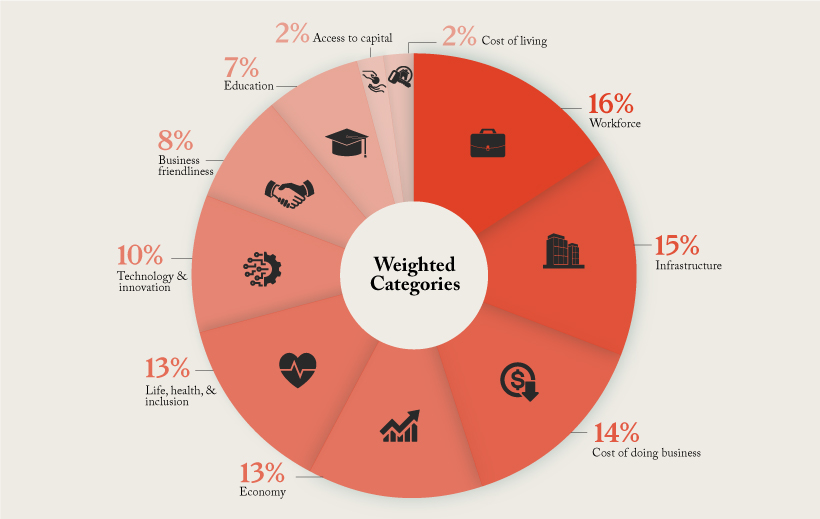
Methodology
Here is a further breakdown of the weight given to each of the 10 categories:
The Most Business Friendly States
North Carolina—coming in first place in the ranking—attracts an extremely talented and innovative workforce, largely thanks to the state’s investment in its Research Triangle Regional Partnership (RTRP).
| Overall Rank | State |
|---|---|
| #1 | North Carolina |
| #2 | Washington |
| #3 | Virginia |
| #4 | Colorado |
| #5 | Texas |
| #6 | Tennessee |
| #7 | Nebraska |
| #8 | Utah |
| #9 | Minnesota |
| #10 | Georgia |
| #11 | Florida |
| #12 | Iowa |
| #13 | North Dakota |
| #14 | Indiana |
| #15 | Ohio |
| #16 | Michigan |
| #17 | Pennsylvania |
| #18 | Oregon |
| #19 | Illinois |
| #20 | Idaho |
| #21 | Kansas |
| #22 | South Dakota |
| #23 | Wisconsin |
| #24 | Massachusetts |
| #25 | Missouri |
| #26 | Kentucky |
| #27 | Maryland |
| #28 | Delaware |
| #29 | California |
| #30 | Montana |
| #31 | Vermont |
| #32 | Wyoming |
| #33 | Alabama |
| #34 | Arizona |
| #35 | New Hampshire |
| #36 | New York |
| #36 | South Carolina |
| #38 | Oklahoma |
| #39 | Connecticut |
| #39 | Nevada |
| #41 | Arkansas |
| #42 | New Jersey |
| #43 | Maine |
| #44 | West Virginia |
| #45 | Rhode Island |
| #46 | Hawaii |
| #46 | New Mexico |
| #48 | Louisiana |
| #49 | Alaska |
| #50 | Mississippi |
Notably, there are three ties in the ranking: New York and South Carolina had the same score, tying for 36th, Connecticut and Nevada tied for 39th, and Hawaii and New Mexico tied for 46th.
Other states ranking high on the list are Washington, Virginia, and Colorado. One of the newest individual metrics CNBC took into consideration was an openness to the cannabis industry, likely playing into Colorado’s move up from 8th to 4th compared to last year.
Some states that perhaps surprisingly don’t crack the top 10 include California and New York, both often considered centers of finance and entrepreneurship. But with the high costs of living and of starting a business in those states, their overall score is reduced.
A Look at the Scoring — North Carolina, California, and Nevada
To better understand how this ranking works we’ve broken down three different states and how they ranked in all 10 categories that gave them their overall spot. Here’s a brief look at their place in each category:
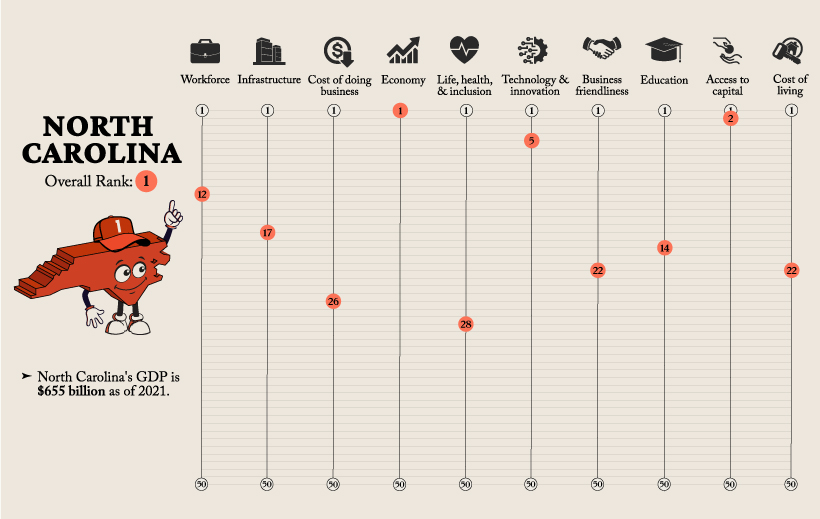
While North Carolina is the number one state to do business in and has an extremely strong economy, they are 26th when it comes to the Cost of Doing Business.
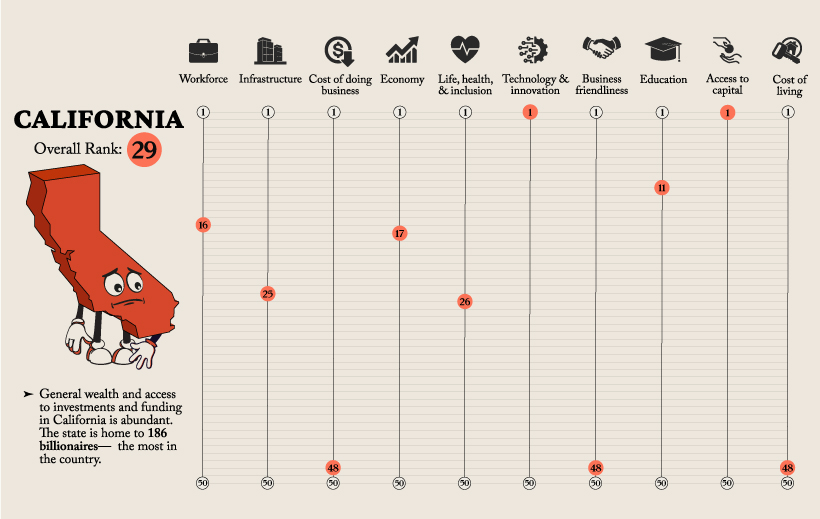
Whereas California ranks low overall, the state ranks first in terms of Technology and Innovation, as well as Access to Capital.
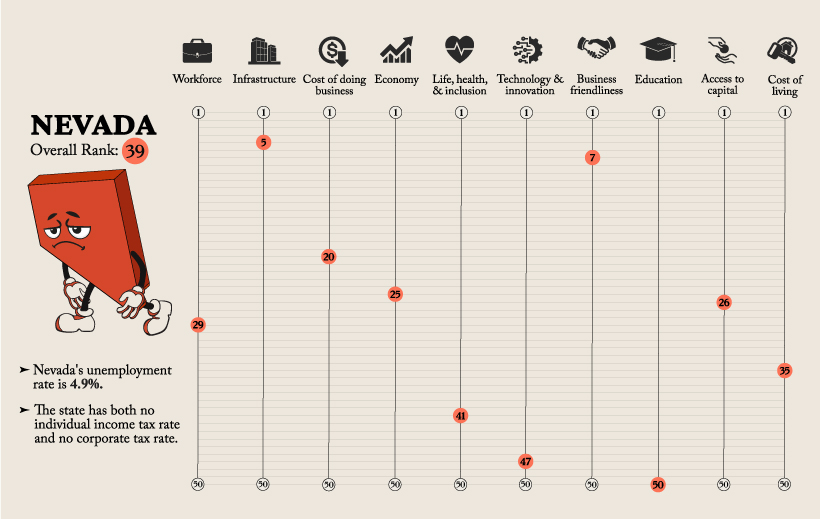
Although Nevada scored highly in the Infrastructure and Business Friendliness categories, the state scored poorly in Technology and Innovation, and was dead last in the Education category.
Doing Business in America
New business applications have actually decreased 4% this year in comparison to the same timeframe in 2021.
Here’s a look at new business applications by region as of July 2022:
- Northeast: 63,058
- Midwest: 70,827
- South: 197,663
- West: 94,150
New business applications in July were the highest in the retail trade industry, numbering around 69,000 new applications, according to the U.S. Census Bureau. Applications for professional service businesses were the second highest at 53,000, followed closely by construction businesses at 43,000.
Here’s a closer look at the industry breakdown:
| Industry | Number of Applications |
|---|---|
| Retail Trade | 68,974 |
| Professional Services | 53,321 |
| Construction | 43,442 |
| Other Services | 38,605 |
| Transportation and Warehousing | 34,952 |
| Administrative and Support | 31,602 |
| Health Care and Social Assistance | 25,725 |
| Accommodation and Food Services | 24,166 |
| Real Estate | 23,953 |
| Finance and Insurance | 18,890 |
| Arts and Entertainment | 12,684 |
| Unclassified | 12,350 |
| Wholesale Trade | 8,893 |
| Information | 7,802 |
| Educational Services | 5,762 |
| Manufacturing | 5,744 |
| Management of Companies | 4,166 |
| Agriculture | 3,703 |
| Mining | 542 |
| Utilities | 421 |
A potential looming recession, alongside rising interest rates and inflation, may be creating a sense of cautiousness among businesspeople, leading to the lower rate of business applications compared to last year. And, at existing companies, the economic situation has lead to cuts in growth forecasts and subsequently, major layoffs.
But overall, the U.S. is a country which values entrepreneurship—even during the pandemic, massive spikes in new business formations were recorded—and certain industries and states will continue to flourish in any business environment.


Economy
Economic Growth Forecasts for G7 and BRICS Countries in 2024
The IMF has released its economic growth forecasts for 2024. How do the G7 and BRICS countries compare?


G7 & BRICS Real GDP Growth Forecasts for 2024
The International Monetary Fund’s (IMF) has released its real gross domestic product (GDP) growth forecasts for 2024, and while global growth is projected to stay steady at 3.2%, various major nations are seeing declining forecasts.
This chart visualizes the 2024 real GDP growth forecasts using data from the IMF’s 2024 World Economic Outlook for G7 and BRICS member nations along with Saudi Arabia, which is still considering an invitation to join the bloc.
Get the Key Insights of the IMF’s World Economic Outlook
Want a visual breakdown of the insights from the IMF’s 2024 World Economic Outlook report?
This visual is part of a special dispatch of the key takeaways exclusively for VC+ members.
Get the full dispatch of charts by signing up to VC+.
Mixed Economic Growth Prospects for Major Nations in 2024
Economic growth projections by the IMF for major nations are mixed, with the majority of G7 and BRICS countries forecasted to have slower growth in 2024 compared to 2023.
Only three BRICS-invited or member countries, Saudi Arabia, the UAE, and South Africa, have higher projected real GDP growth rates in 2024 than last year.
| Group | Country | Real GDP Growth (2023) | Real GDP Growth (2024P) |
|---|---|---|---|
| G7 | 🇺🇸 U.S. | 2.5% | 2.7% |
| G7 | 🇨🇦 Canada | 1.1% | 1.2% |
| G7 | 🇯🇵 Japan | 1.9% | 0.9% |
| G7 | 🇫🇷 France | 0.9% | 0.7% |
| G7 | 🇮🇹 Italy | 0.9% | 0.7% |
| G7 | 🇬🇧 UK | 0.1% | 0.5% |
| G7 | 🇩🇪 Germany | -0.3% | 0.2% |
| BRICS | 🇮🇳 India | 7.8% | 6.8% |
| BRICS | 🇨🇳 China | 5.2% | 4.6% |
| BRICS | 🇦🇪 UAE | 3.4% | 3.5% |
| BRICS | 🇮🇷 Iran | 4.7% | 3.3% |
| BRICS | 🇷🇺 Russia | 3.6% | 3.2% |
| BRICS | 🇪🇬 Egypt | 3.8% | 3.0% |
| BRICS-invited | 🇸🇦 Saudi Arabia | -0.8% | 2.6% |
| BRICS | 🇧🇷 Brazil | 2.9% | 2.2% |
| BRICS | 🇿🇦 South Africa | 0.6% | 0.9% |
| BRICS | 🇪🇹 Ethiopia | 7.2% | 6.2% |
| 🌍 World | 3.2% | 3.2% |
China and India are forecasted to maintain relatively high growth rates in 2024 at 4.6% and 6.8% respectively, but compared to the previous year, China is growing 0.6 percentage points slower while India is an entire percentage point slower.
On the other hand, four G7 nations are set to grow faster than last year, which includes Germany making its comeback from its negative real GDP growth of -0.3% in 2023.
Faster Growth for BRICS than G7 Nations
Despite mostly lower growth forecasts in 2024 compared to 2023, BRICS nations still have a significantly higher average growth forecast at 3.6% compared to the G7 average of 1%.
While the G7 countries’ combined GDP is around $15 trillion greater than the BRICS nations, with continued higher growth rates and the potential to add more members, BRICS looks likely to overtake the G7 in economic size within two decades.
BRICS Expansion Stutters Before October 2024 Summit
BRICS’ recent expansion has stuttered slightly, as Argentina’s newly-elected president Javier Milei declined its invitation and Saudi Arabia clarified that the country is still considering its invitation and has not joined BRICS yet.
Even with these initial growing pains, South Africa’s Foreign Minister Naledi Pandor told reporters in February that 34 different countries have submitted applications to join the growing BRICS bloc.
Any changes to the group are likely to be announced leading up to or at the 2024 BRICS summit which takes place October 22-24 in Kazan, Russia.
Get the Full Analysis of the IMF’s Outlook on VC+
This visual is part of an exclusive special dispatch for VC+ members which breaks down the key takeaways from the IMF’s 2024 World Economic Outlook.
For the full set of charts and analysis, sign up for VC+.

-

 Markets1 week ago
U.S. Debt Interest Payments Reach $1 Trillion
-

 Business2 weeks ago
Charted: Big Four Market Share by S&P 500 Audits
-

 Real Estate2 weeks ago
Ranked: The Most Valuable Housing Markets in America
-

 Money2 weeks ago
Which States Have the Highest Minimum Wage in America?
-

 AI2 weeks ago
Ranked: Semiconductor Companies by Industry Revenue Share
-

 Markets2 weeks ago
Ranked: The World’s Top Flight Routes, by Revenue
-

 Demographics2 weeks ago
Population Projections: The World’s 6 Largest Countries in 2075
-

 Markets2 weeks ago
The Top 10 States by Real GDP Growth in 2023