Energy
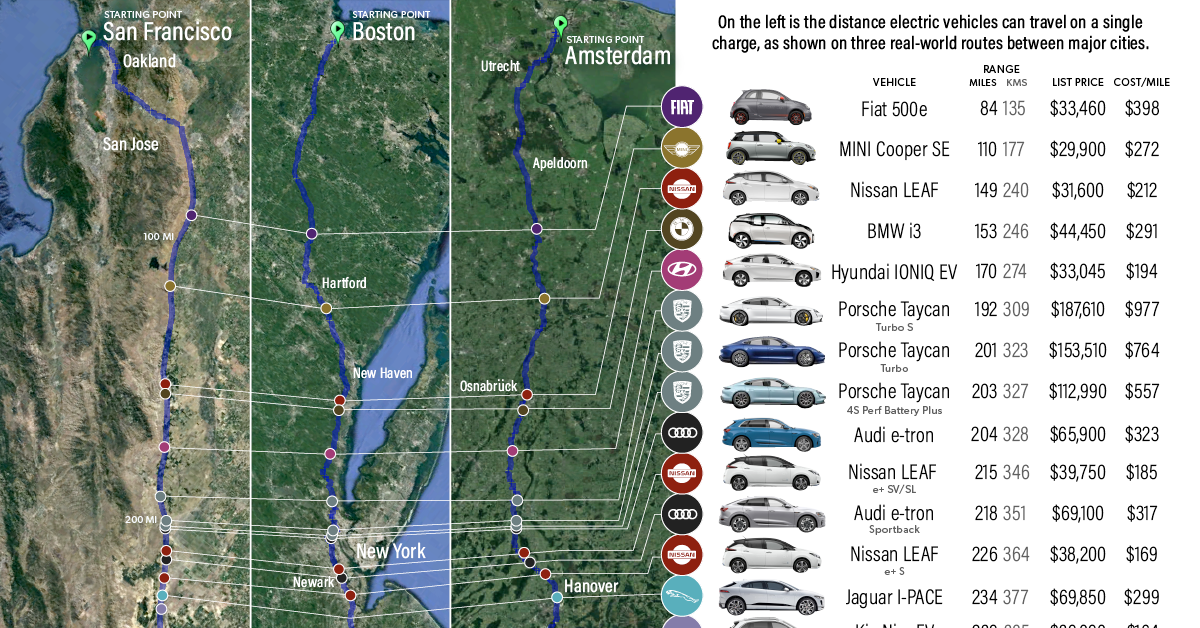
Visualizing the Range of EVs on Major Highway Routes
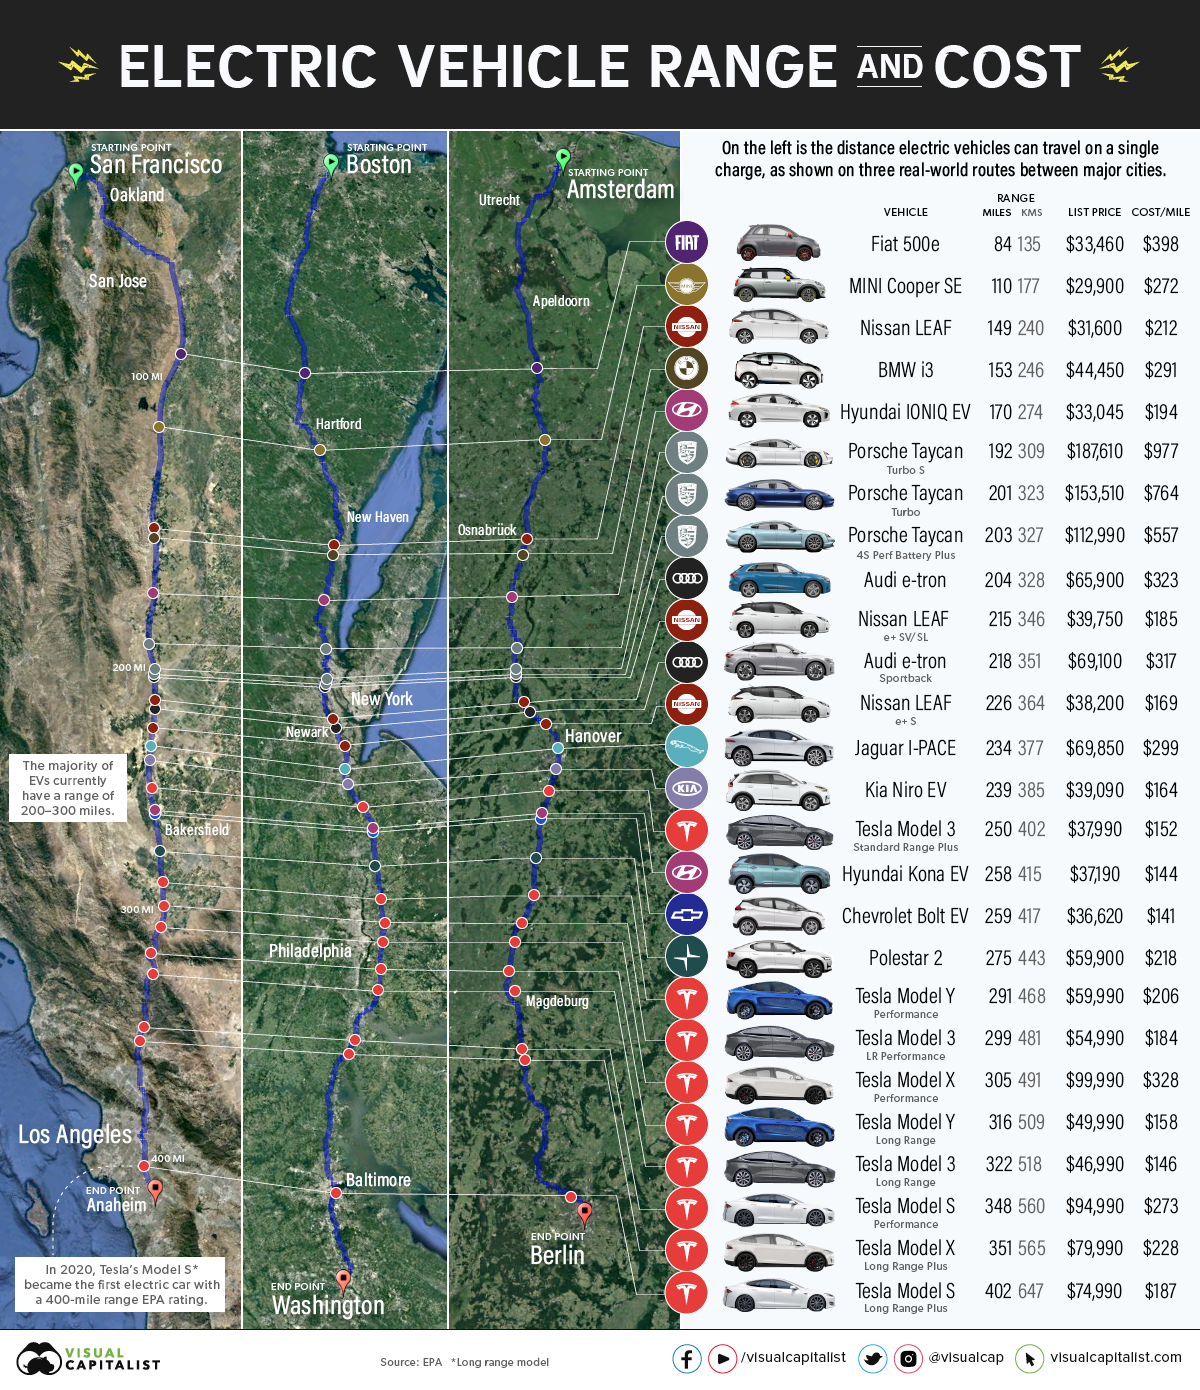


The Range of EVs on Major Highway Routes
Between growing concerns around climate change, new commuting behaviors due to COVID-19, and imminent policy changes, the global transition to electric vehicles (EVs) is well under way.
By the year 2040, sales of electric vehicles are projected to account for 58% of new car sales, up from just 2.7% currently.
But switching from a gasoline car to an electric one is not seamless. With charging and range capacities to consider, and the supporting infrastructure still being slowly rolled out in many parts of the world, understanding the realities of EV transportation is vital.
Above, we highlight 2020 all-electric vehicle range on well-recognized routes, from California’s I-5 in the U.S. to the A2 autobahn in Germany. The data on estimated ranges and costs are drawn from the U.S. EPA as well as directly from manufacturer websites.
The EV Breakdown: Tesla is King of Range
For many consumers, the most important aspect of an electric vehicle is how far they can travel on a single charge.
Whether it’s for long commutes or out-of-city trips, vehicles must meet a minimum threshold to be considered practical for many households. As the table below shows, Tesla’s well-known EVs are far-and-away the best option for long range drivers.
| Vehicle | Range (miles) | Range (km) | MSRP | Cost per mile |
|---|---|---|---|---|
| Tesla Model S Long Range Plus | 402 | 647 | $74,990 | $186.54 |
| Tesla Model X Long Range Plus | 351 | 565 | $79,990 | $227.89 |
| Tesla Model S Performance | 348 | 560 | $94,990 | $272.96 |
| Tesla Model 3 Long Range | 322 | 518 | $46,990 | $145.93 |
| Tesla Model Y Long Range | 316 | 509 | $49,990 | $158.20 |
| Tesla Model X Performance | 305 | 491 | $99,990 | $327.84 |
| Tesla Model 3 LR Performance | 299 | 481 | $54,990 | $183.91 |
| Tesla Model Y Performance | 291 | 468 | $59,990 | $206.15 |
| Polestar 2 | 275 | 443 | $59,900 | $217.82 |
| Chevrolet Bolt EV | 259 | 417 | $36,620 | $141.39 |
| Hyundai Kona Electric | 258 | 415 | $37,190 | $144.15 |
| Tesla Model 3 Standard Range Plus | 250 | 402 | $37,990 | $151.96 |
| Kia Niro EV | 239 | 385 | $39,090 | $163.56 |
| Jaguar I-PACE | 234 | 377 | $69,850 | $298.50 |
| Nissan LEAF e+ S | 226 | 364 | $38,200 | $169.03 |
| Audi e-tron Sportback | 218 | 351 | $69,100 | $316.97 |
| Nissan LEAF e+ SV/SL | 215 | 346 | $39,750 | $184.88 |
| Audi e-tron | 204 | 328 | $65,900 | $323.04 |
| Porsche Taycan 4S Perf Battery Plus | 203 | 327 | $112,990 | $556.60 |
| Porsche Taycan Turbo | 201 | 323 | $153,510 | $763.73 |
| Porsche Taycan Turbo S | 192 | 309 | $187,610 | $977.14 |
| Hyundai IONIQ Electric | 170 | 274 | $33,045 | $194.38 |
| BMW i3 | 153 | 246 | $44,450 | $290.52 |
| Nissan LEAF | 149 | 240 | $31,600 | $212.08 |
| MINI Cooper SE | 110 | 177 | $29,900 | $271.82 |
| Fiat 500e | 84 | 135 | $33,460 | $398.33 |
In an industry where innovation and efficiency are vital, Tesla’s first-mover advantage is evident. From the more affordable Model 3 to the more luxurious Model S, the top eight EVs with the longest ranges are all Tesla vehicles.
At 402 miles (647 km), the range of the number one vehicle (the Tesla Model S Long Range Plus) got 127 miles more per charge than the top non-Tesla vehicle, the Polestar 2—an EV made by Volvo’s standalone performance brand.
Closer Competition in Cost
Though Tesla leads on overall range and battery capacity, accounting for the price of each vehicle shows that cost-efficiency is far more competitive among brands.
By dividing the retail price by the maximum range of each vehicle, we can paint a clearer picture of efficiency. Leading the pack is the Chevrolet Bolt, which had a cost of $141.39/mile of range in 2020 while still placing in the top 10 for range with 259 miles (417 km).
Just behind in second place was the Hyundai Kona electric at $144.15/mile of range, followed by the Tesla Model 3—the most efficient of the automaker’s current lineup. Rounding out the top 10 are the Nissan LEAF and Tesla Model S, but the difference from number one to number ten was minimal, at just over $45/mile.
| Top 10 All-Electric Vehicles by Cost Efficiency | |
|---|---|
| Vehicle | Cost per mile |
| Chevrolet Bolt EV | $141.39 |
| Hyundai Kona Electric | $144.15 |
| Tesla Model 3 Long Range | $145.93 |
| Tesla Model 3 Standard Range Plus | $151.96 |
| Tesla Model Y Long Range | $158.20 |
| Kia Niro EV | $163.56 |
| Nissan LEAF e+ S | $169.03 |
| Tesla Model 3 LR Performance | $183.91 |
| Nissan LEAF e+ SV/SL | $184.88 |
| Tesla Model S Long Range Plus | $186.54 |
Higher Ranges and Lower Costs on the Horizon
The most important thing to consider, however, is that the EV industry is entering a critical stage.
On one hand, the push for electrification and innovation in EVs has driven battery capacity higher and costs significantly lower. As batteries account for the bulk of weight, cost, and performance in EVs, those dividends will pay out in longer ranges and greater efficiencies with newer models.
Equally important is the strengthening global push for electric vehicle adoption. In countries like Norway, EVs are already among the best selling cars on the market, while adoption rates in China and the U.S. are steadily climbing. This is also being impacted by policy decisions, such as California’s recent announcement that it would be banning the sale of gasoline cars by 2035.
Meanwhile, the only thing outpacing the growing network of Tesla superchargers is the company’s rising stock price. Not content to sit on the sidelines, competing automakers are rapidly trying to catch up. Nissan’s LEAF is just behind the Tesla Model 3 as the world’s second-best-selling EV, and Audi recently rolled out a supercharger network that can charge its cars from 0% to 80% at a faster rate than Tesla.
As the tidal wave of electric vehicle demand and adoption continues to pick up steam, consumers can expect increasing innovation to drive up ranges, decrease costs, and open up options.
Correction: A previous version of this graphic showed a European route that was the incorrect distance.


Energy
The World’s Biggest Nuclear Energy Producers
China has grown its nuclear capacity over the last decade, now ranking second on the list of top nuclear energy producers.


The World’s Biggest Nuclear Energy Producers
This was originally posted on our Voronoi app. Download the app for free on Apple or Android and discover incredible data-driven charts from a variety of trusted sources.
Scientists in South Korea recently broke a record in a nuclear fusion experiment. For 48 seconds, they sustained a temperature seven times that of the sun’s core.
But generating commercially viable energy from nuclear fusion still remains more science fiction than reality. Meanwhile, its more reliable sibling, nuclear fission, has been powering our world for many decades.
In this graphic, we visualized the top producers of nuclear energy by their share of the global total, measured in terawatt hours (TWh). Data for this was sourced from the Nuclear Energy Institute, last updated in August 2022.
Which Country Generates the Most Nuclear Energy?
Nuclear energy production in the U.S. is more than twice the amount produced by China (ranked second) and France (ranked third) put together. In total, the U.S. accounts for nearly 30% of global nuclear energy output.
However, nuclear power only accounts for one-fifth of America’s electricity supply. This is in contrast to France, which generates 60% of its electricity from nuclear plants.
| Rank | Country | Nuclear Energy Produced (TWh) | % of Total |
|---|---|---|---|
| 1 | 🇺🇸 U.S. | 772 | 29% |
| 2 | 🇨🇳 China | 383 | 14% |
| 3 | 🇫🇷 France | 363 | 14% |
| 4 | 🇷🇺 Russia | 208 | 8% |
| 5 | 🇰🇷 South Korea | 150 | 6% |
| 6 | 🇨🇦 Canada | 87 | 3% |
| 7 | 🇺🇦 Ukraine | 81 | 3% |
| 8 | 🇩🇪 Germany | 65 | 2% |
| 9 | 🇯🇵 Japan | 61 | 2% |
| 10 | 🇪🇸 Spain | 54 | 2% |
| 11 | 🇸🇪 Sweden | 51 | 2% |
| 12 | 🇧🇪 Belgium | 48 | 2% |
| 13 | 🇬🇧 UK | 42 | 2% |
| 14 | 🇮🇳 India | 40 | 2% |
| 15 | 🇨🇿 Czech Republic | 29 | 1% |
| N/A | 🌐 Other | 219 | 8% |
| N/A | 🌍 Total | 2,653 | 100% |
Another highlight is how China has rapidly grown its nuclear energy capabilities in the last decade. Between 2016 and 2021, for example, it increased its share of global nuclear energy output from less than 10% to more than 14%, overtaking France for second place.
On the opposite end, the UK’s share has slipped to 2% over the same time period.
Meanwhile, Ukraine has heavily relied on nuclear energy to power its grid. In March 2022, it lost access to its key Zaporizhzhia Nuclear Power Station after Russian forces wrested control of the facility. With six 1,000 MW reactors, the plant is one of the largest in Europe. It is currently not producing any power, and has been the site of recent drone attacks.

-

 Markets2 weeks ago
Visualizing America’s Shortage of Affordable Homes
-

 Technology1 week ago
Ranked: Semiconductor Companies by Industry Revenue Share
-

 Money1 week ago
Which States Have the Highest Minimum Wage in America?
-

 Real Estate1 week ago
Ranked: The Most Valuable Housing Markets in America
-

 Business2 weeks ago
Charted: Big Four Market Share by S&P 500 Audits
-

 AI2 weeks ago
The Stock Performance of U.S. Chipmakers So Far in 2024
-

 Misc2 weeks ago
Almost Every EV Stock is Down After Q1 2024
-

 Money2 weeks ago
Where Does One U.S. Tax Dollar Go?