Technology
How Much Radiation is Emitted by Popular Smartphones?


Radiation Emissions of Popular Smartphones
Smartphones have become an integral part of our everyday lives. From work and school to daily tasks, these handheld devices have brought everything into the palm of our hands.
Most people spend 5-6 hours on their phones each day. And, given that our phones emit a tiny amount of radiation, we’re exposing ourselves to radiation for hours each day.
But different phones emit different amounts of radiation.
With the help of data collected by the German Federal Office of Radiation Protection, we visualize the radiation emissions of some popular smartphones in the market today.
Radiation and SAR Values of Smartphones
Smartphones and other mobile devices emit tiny amounts of radiofrequency (RF) radiation. Humans can absorb this radiation when the smartphone is being used or is lying dormant anywhere near their bodies.
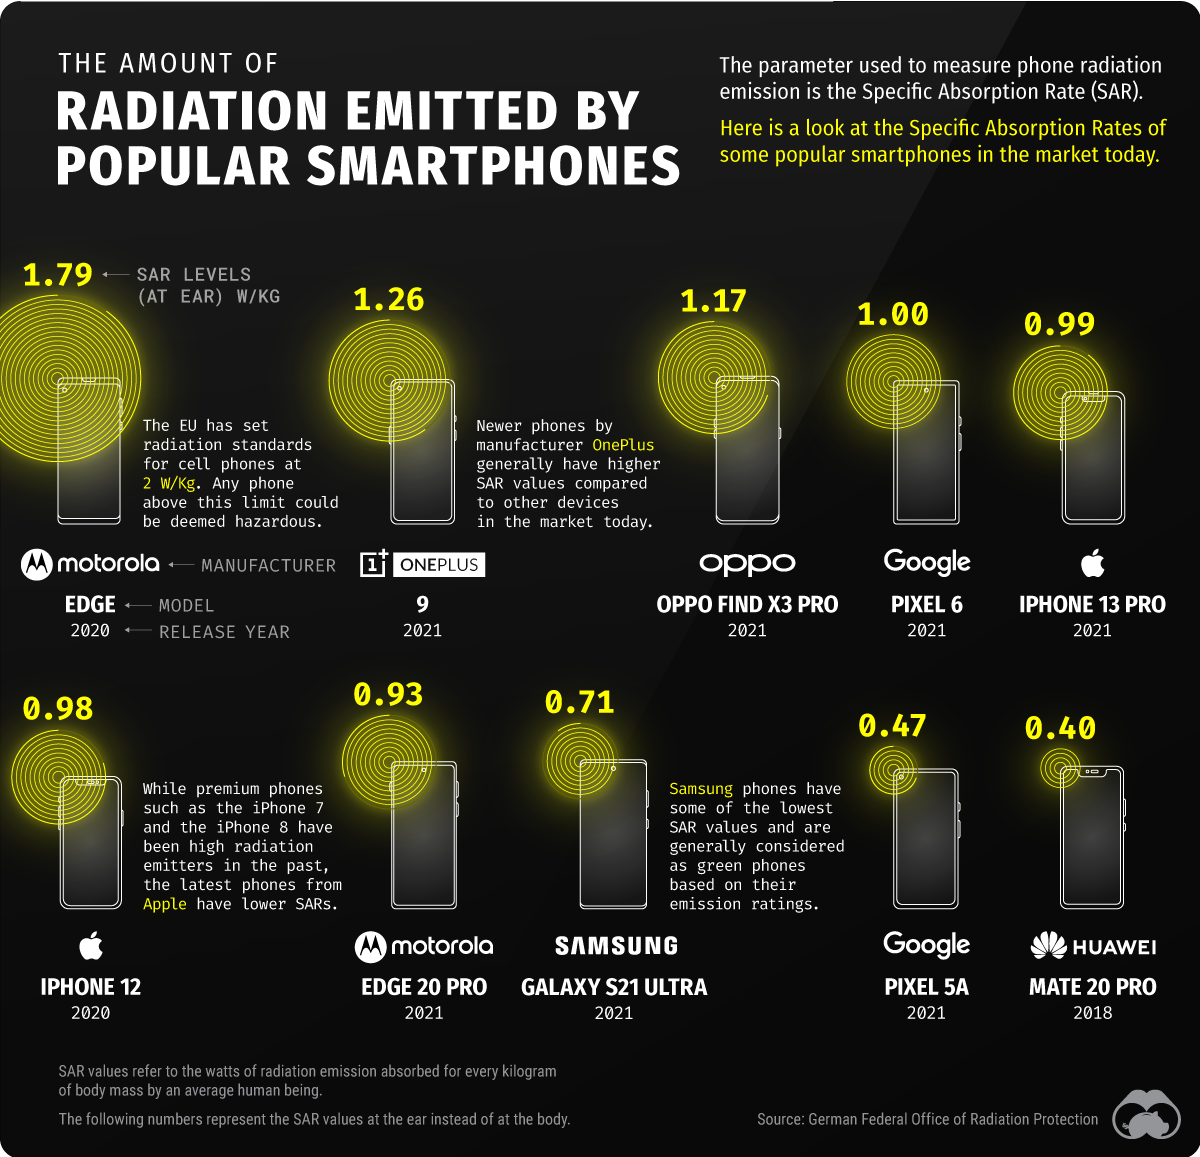
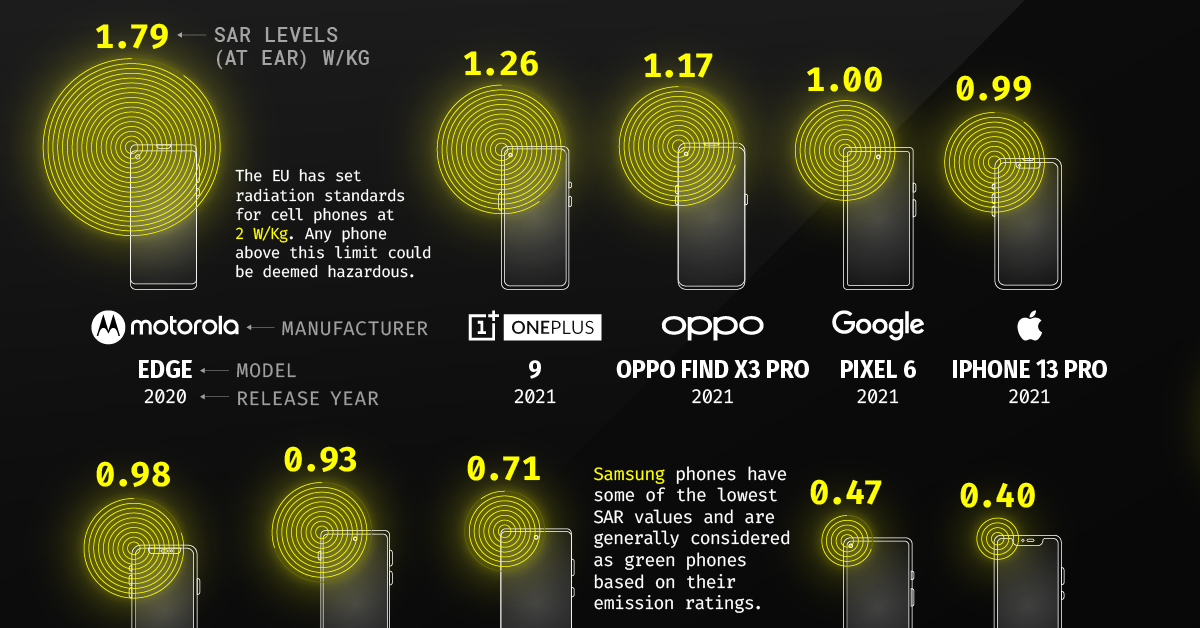
The parameter used to measure phone radiation emissions is the Specific Absorption Rate (SAR). It is the unit of measurement that represents the quantity of electromagnetic energy absorbed by the body when using a mobile device.
The Council of the European Union has set radiation standards for cell phones at 2 watts per kilogram, measured over the 10 grams of tissue that is absorbing the most signal.
SAR values are calculated at the ear (speaking on the phone) and at the body (kept in your pocket). For the purposes of this article, we’ve used the former calculations.
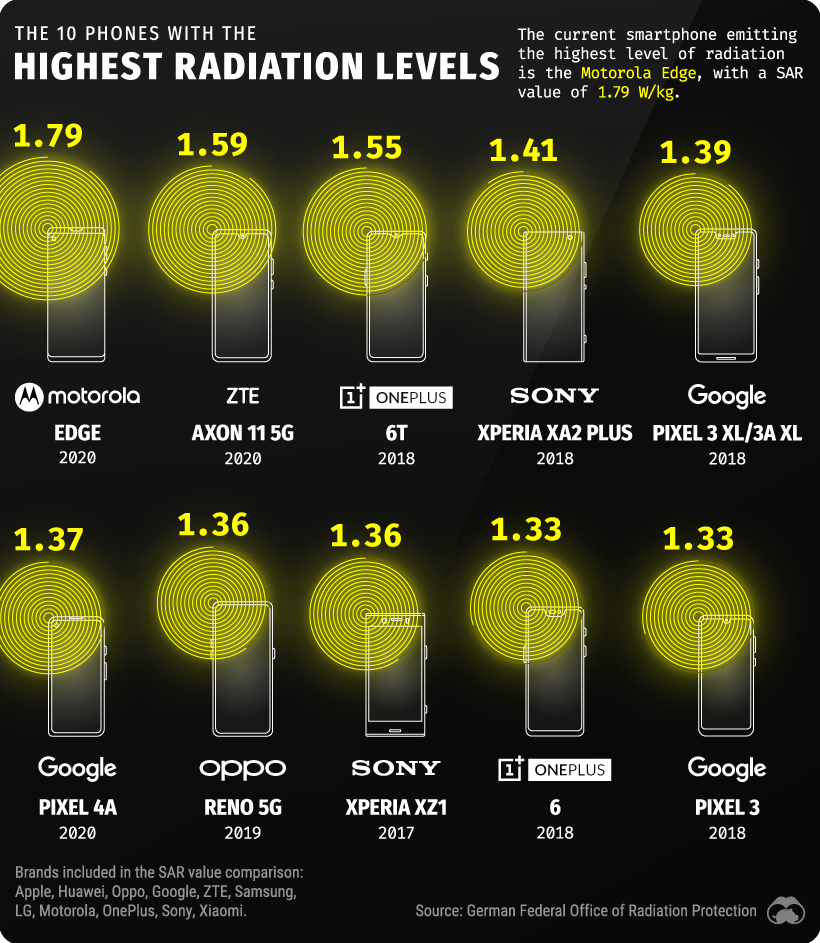
Smartphones With the Highest Levels of Radiation Emissions
The Motorola Edge has the highest radiation emission with a SAR value of 1.79 watts of radiation per kilogram. That’s significantly higher than most other smartphone models in the market today and close to the limits set by the EU for cellphones.
Coming in second is the Axon 11 5G by ZTE with 1.59, followed by the OnePlus 6T at a close third with 1.55 W/kg. The Sony Experia AX2 Plus with 1.41 and the Google Pixel 3 XL and 3A XL at 1.39 round out the top five.
Here is a look at the 10 smartphones that emit the highest level of radiation:
Now that we have detailed the worst offenders let’s look at the smartphones with the lowest levels of radiation emissions.
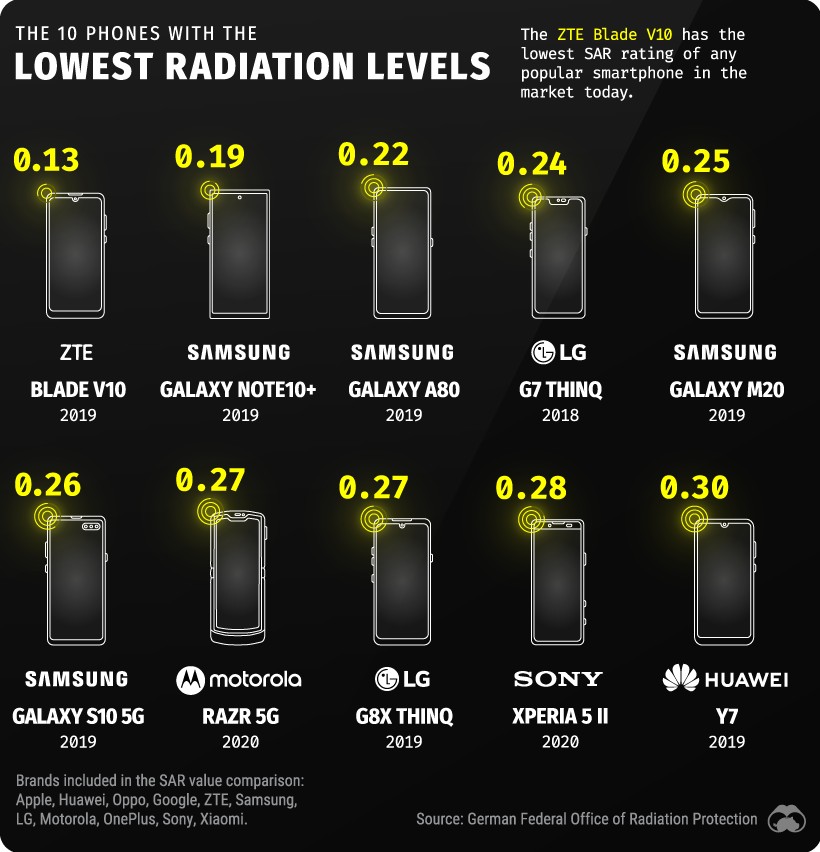
Smartphones With the Lowest Levels of Radiation Emissions
The smartphone with the lowest SAR value is the ZTE Blade V10, with 0.13 watts of radiation per kilogram.
Mobile devices by Samsung carry some of the least radiation risks. The company has four phones considered to be the best in the category. The Galaxy Note 10+ is the best model in their line-up, emitting a meager 0.19 watts per kilogram.
Here is a look at the 10 smartphones that emit the lowest levels of radiation:
There is currently no significant research proving the harmful effects of phone radiation.
Despite this, people who are in contact with their devices for extended periods can at least quantify their radiation exposure and make choices about which brands serve their needs.


Technology
Ranked: Semiconductor Companies by Industry Revenue Share
Nvidia is coming for Intel’s crown. Samsung is losing ground. AI is transforming the space. We break down revenue for semiconductor companies.


Semiconductor Companies by Industry Revenue Share
This was originally posted on our Voronoi app. Download the app for free on Apple or Android and discover incredible data-driven charts from a variety of trusted sources.
Did you know that some computer chips are now retailing for the price of a new BMW?
As computers invade nearly every sphere of life, so too have the chips that power them, raising the revenues of the businesses dedicated to designing them.
But how did various chipmakers measure against each other last year?
We rank the biggest semiconductor companies by their percentage share of the industry’s revenues in 2023, using data from Omdia research.
Which Chip Company Made the Most Money in 2023?
Market leader and industry-defining veteran Intel still holds the crown for the most revenue in the sector, crossing $50 billion in 2023, or 10% of the broader industry’s topline.
All is not well at Intel, however, with the company’s stock price down over 20% year-to-date after it revealed billion-dollar losses in its foundry business.
| Rank | Company | 2023 Revenue | % of Industry Revenue |
|---|---|---|---|
| 1 | Intel | $51B | 9.4% |
| 2 | NVIDIA | $49B | 9.0% |
| 3 | Samsung Electronics | $44B | 8.1% |
| 4 | Qualcomm | $31B | 5.7% |
| 5 | Broadcom | $28B | 5.2% |
| 6 | SK Hynix | $24B | 4.4% |
| 7 | AMD | $22B | 4.1% |
| 8 | Apple | $19B | 3.4% |
| 9 | Infineon Tech | $17B | 3.2% |
| 10 | STMicroelectronics | $17B | 3.2% |
| 11 | Texas Instruments | $17B | 3.1% |
| 12 | Micron Technology | $16B | 2.9% |
| 13 | MediaTek | $14B | 2.6% |
| 14 | NXP | $13B | 2.4% |
| 15 | Analog Devices | $12B | 2.2% |
| 16 | Renesas Electronics Corporation | $11B | 1.9% |
| 17 | Sony Semiconductor Solutions Corporation | $10B | 1.9% |
| 18 | Microchip Technology | $8B | 1.5% |
| 19 | Onsemi | $8B | 1.4% |
| 20 | KIOXIA Corporation | $7B | 1.3% |
| N/A | Others | $126B | 23.2% |
| N/A | Total | $545B | 100% |
Note: Figures are rounded. Totals and percentages may not sum to 100.
Meanwhile, Nvidia is very close to overtaking Intel, after declaring $49 billion of topline revenue for 2023. This is more than double its 2022 revenue ($21 billion), increasing its share of industry revenues to 9%.
Nvidia’s meteoric rise has gotten a huge thumbs-up from investors. It became a trillion dollar stock last year, and broke the single-day gain record for market capitalization this year.
Other chipmakers haven’t been as successful. Out of the top 20 semiconductor companies by revenue, 12 did not match their 2022 revenues, including big names like Intel, Samsung, and AMD.
The Many Different Types of Chipmakers
All of these companies may belong to the same industry, but they don’t focus on the same niche.
According to Investopedia, there are four major types of chips, depending on their functionality: microprocessors, memory chips, standard chips, and complex systems on a chip.
Nvidia’s core business was once GPUs for computers (graphics processing units), but in recent years this has drastically shifted towards microprocessors for analytics and AI.
These specialized chips seem to be where the majority of growth is occurring within the sector. For example, companies that are largely in the memory segment—Samsung, SK Hynix, and Micron Technology—saw peak revenues in the mid-2010s.

-

 Technology2 weeks ago
Ranked: The Most Popular Smartphone Brands in the U.S.
-

 Automotive1 week ago
Almost Every EV Stock is Down After Q1 2024
-

 Money1 week ago
Where Does One U.S. Tax Dollar Go?
-

 Green2 weeks ago
Ranked: Top Countries by Total Forest Loss Since 2001
-

 Real Estate2 weeks ago
Visualizing America’s Shortage of Affordable Homes
-

 Maps2 weeks ago
Mapped: Average Wages Across Europe
-

 Mining2 weeks ago
Charted: The Value Gap Between the Gold Price and Gold Miners
-

 Demographics2 weeks ago
Visualizing the Size of the Global Senior Population