Money
The Racial Wealth Gap in America: Asset Types Held by Race
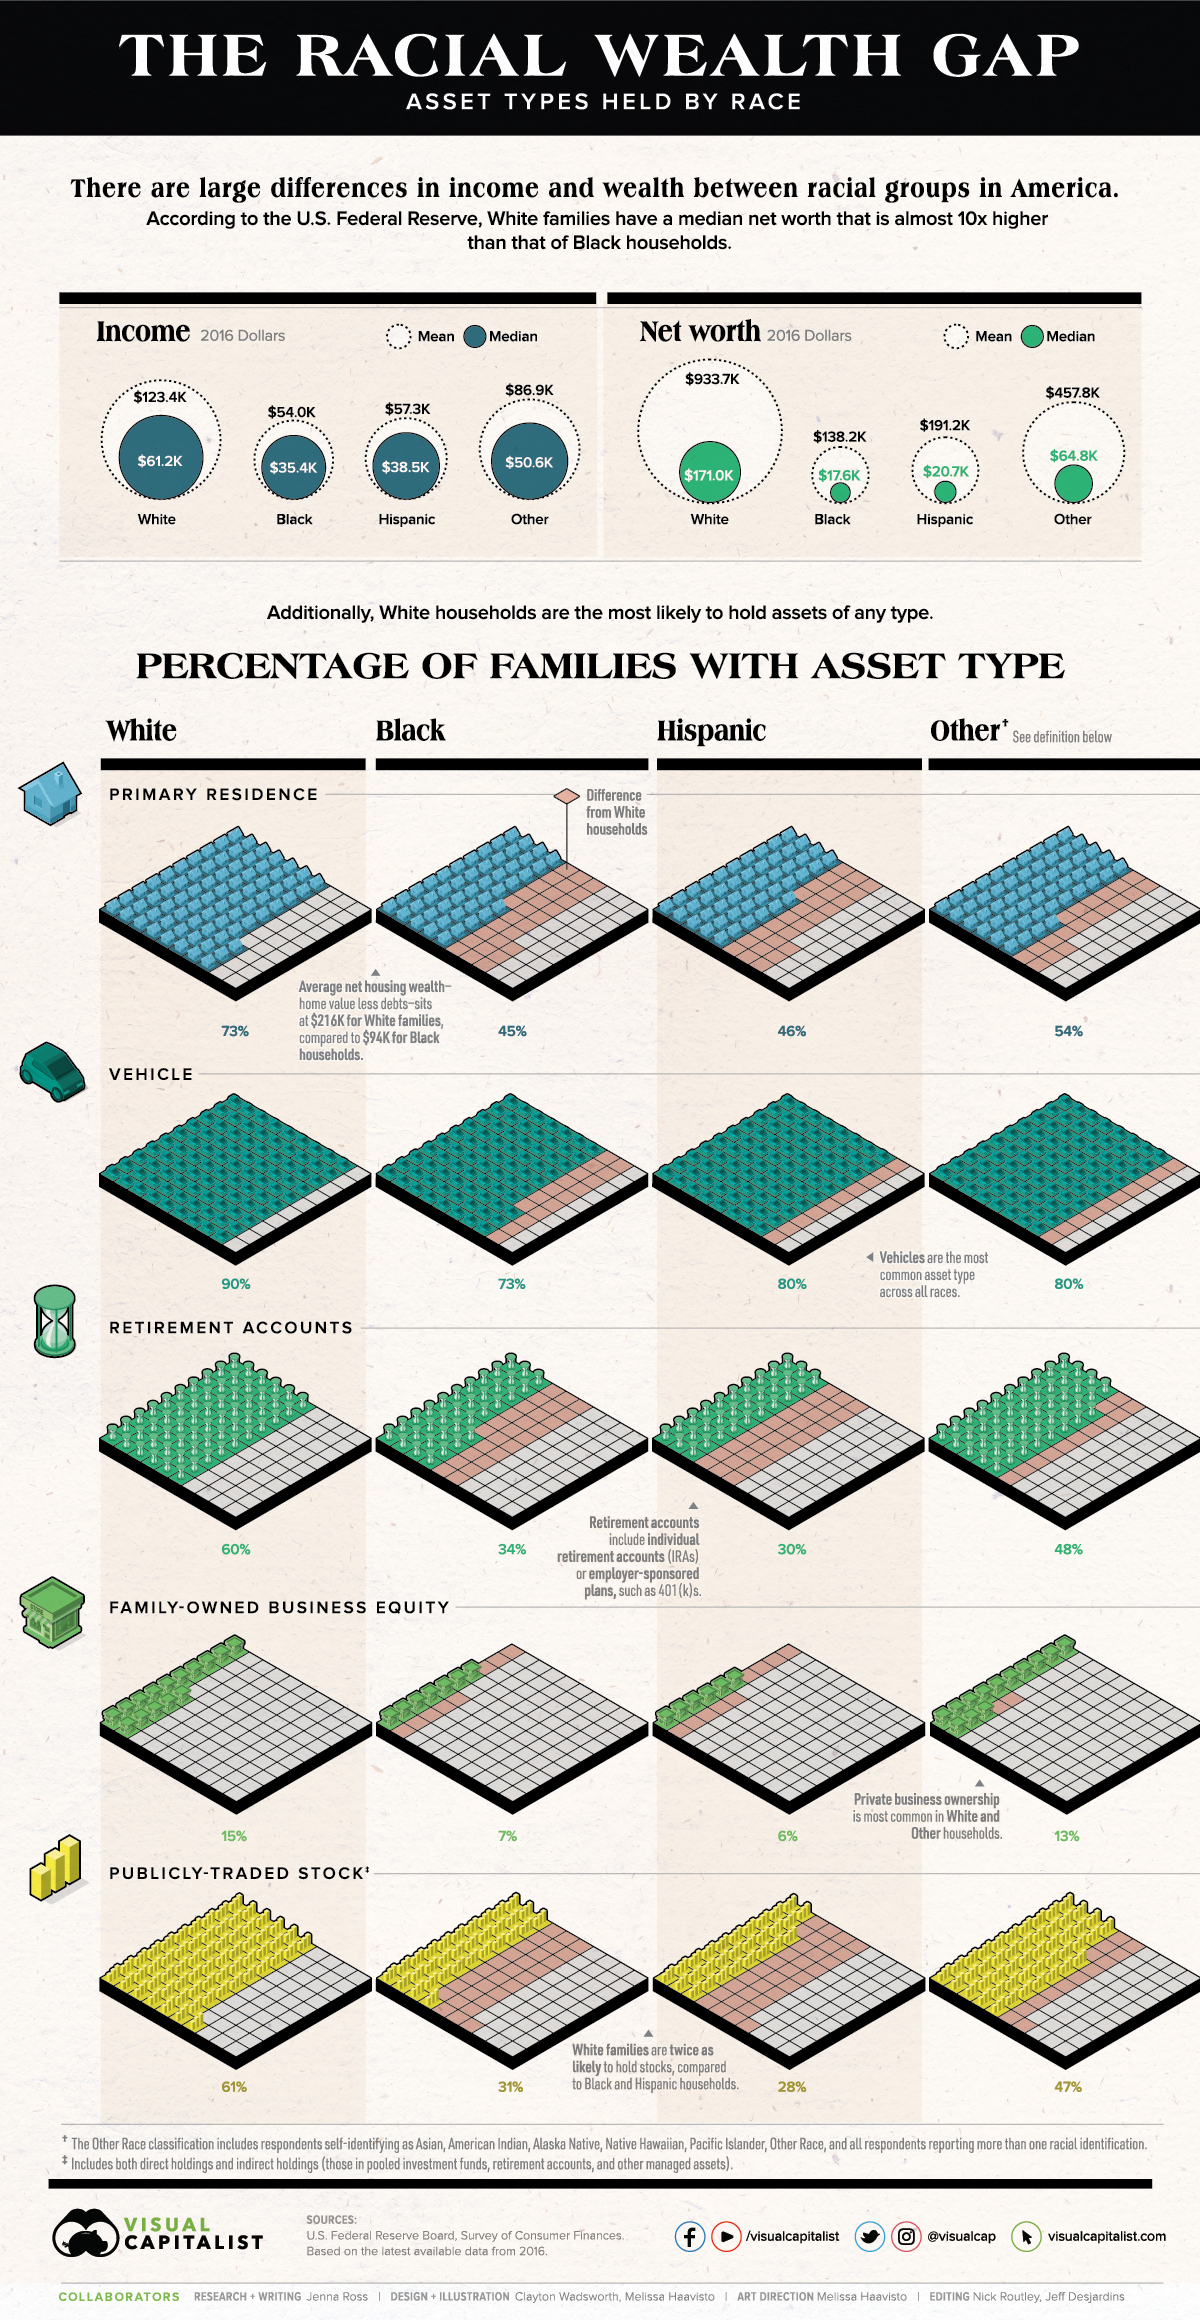


The Racial Wealth Gap
People of color have faced economic inequality for generations, and the recent wave of Black Lives Matter protests has renewed discussions on these disparities.
Compared to White families, other races have lower levels of income and net worth. They are also less likely to hold assets of any type. In fact, 19% of Black families have zero or negative net worth, while only 9% of White households have no wealth.
Today’s chart uses data from the U.S. Federal Reserve’s triennial Survey of Consumer Finances to highlight the racial wealth gap, and the proportion of households that own different kinds of assets by racial group.
Asset Types Held By Race
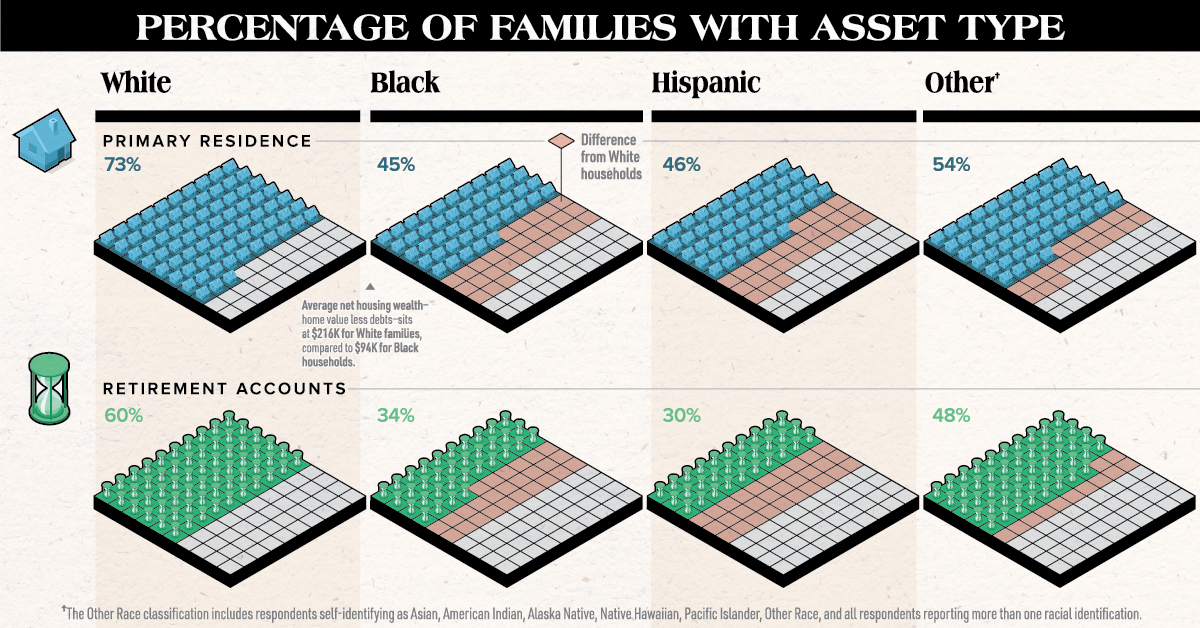
The financial profile between racial groups varies widely. Below is the percentage of U.S. families with each type of asset, according to the most recent survey from 2016.
| White | Black | Hispanic | Other | |
|---|---|---|---|---|
| Primary Residence | 73% | 45% | 46% | 54% |
| Vehicle | 90% | 73% | 80% | 80% |
| Retirement Accounts | 60% | 34% | 30% | 48% |
| Family-owned Business Equity | 15% | 7% | 6% | 13% |
| Publicly-traded Stocks | 61% | 31% | 28% | 47% |
Vehicles are the most common asset across all racial groups, followed by a primary residence.
However, the level of equity—or home value less debts—families have in their houses differs by race. White families have equity of $215,800, whereas Black and Hispanic households have net housing wealth of $94,400 and $129,800 respectively.
In addition, White households are more likely to hold financial assets such as retirement accounts, family businesses, and stocks. These assets are instrumental in building wealth, and are prominent in the wealth composition of America’s richest families.
With fewer people of color holding these assets, they miss out on higher average returns than low-risk assets, as well as the power of compound interest. These portfolio differences are striking, but they are not the most important contributing factor in the racial wealth gap.
Demographic and Economic Variations
White households are also more likely to have demographic characteristics that are associated with wealth. According to the U.S. Federal Reserve, they are:
- Older, with more than half of households age 55 and up
- More highly educated, with 51% having some type of degree
- Less likely to have a single parent
- More likely to have received an inheritance
For example, 39% of White heads of households have a bachelor’s degree or higher, compared to 23% and 17% for Black and Hispanic household heads, respectively. However, education doesn’t fully explain the wealth inequities.
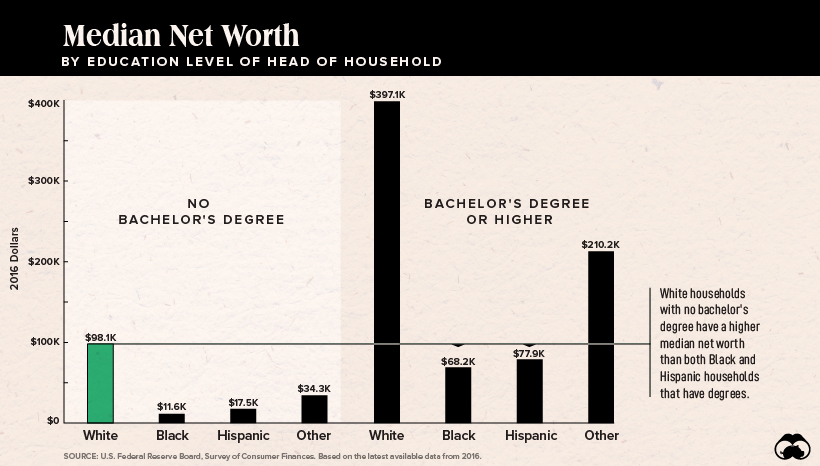
Enormous wealth disparities exist between families with the same education level. Even in cases where Black and Hispanic household heads have obtained a bachelor’s degree, their families’ median wealth of $68,000 and $78,000 respectively is still lower than the $98,000 median wealth for White families where the head has no bachelor’s degree.
After accounting for demographic factors, researchers still found there were considerable inequities. What, then, could be primarily responsible for the racial wealth gap?
The Income Gap
While previous research found that the wealth gap is “too big” to be explained by a difference in income, a recent study from the Federal Reserve Bank of Cleveland offers a new perspective. Focusing on White and Black U.S. households only, researchers analyzed the dynamics of wealth accumulation over time, as opposed to previous studies that considered short time periods.
They found that income inequality was the primary contributor to the racial wealth gap. According to the model, if Black and White households had earned the same labor income from 1962 onwards, the Black-to-White wealth ratio would have reached 0.9 by 2007.
Moving forward, the study concludes that policy changes will likely have a positive impact if they address issues contributing to income gaps. This includes reducing racial discrimination in the labor market, and creating programs, such as mentorships, that improve environments for specific racial subgroups.


Money
Charted: Who Has Savings in This Economy?
Older, better-educated adults are winning the savings game, reveals a January survey by the National Opinion Research Center at the University of Chicago.


Who Has Savings in This Economy?
This was originally posted on our Voronoi app. Download the app for free on iOS or Android and discover incredible data-driven charts from a variety of trusted sources.
Two full years of inflation have taken their toll on American households. In 2023, the country’s collective credit card debt crossed $1 trillion for the first time. So who is managing to save money in the current economic environment?
We visualize the percentage of respondents to the statement “I have money leftover at the end of the month” categorized by age and education qualifications. Data is sourced from a National Endowment for Financial Education (NEFE) report, published last month.
The survey for NEFE was conducted from January 12-14, 2024, by the National Opinion Research Center at the University of Chicago. It involved 1,222 adults aged 18+ and aimed to be representative of the U.S. population.
Older Americans Save More Than Their Younger Counterparts
General trends from this dataset indicate that as respondents get older, a higher percentage of them are able to save.
| Age | Always/Often | Sometimes | Rarely/Never |
|---|---|---|---|
| 18–29 | 29% | 33% | 38% |
| 30–44 | 36% | 27% | 37% |
| 45–59 | 39% | 23% | 38% |
| Above 60 | 49% | 28% | 23% |
| All Adults | 39% | 33% | 27% |
Note: Percentages are rounded and may not sum to 100.
Perhaps not surprisingly, those aged 60+ are the age group with the highest percentage saying they have leftover money at the end of the month. This age group spent the most time making peak earnings in their careers, are more likely to have investments, and are more likely to have paid off major expenses like a mortgage or raising a family.
The Impact of Higher Education on Earnings and Savings
Based on this survey, higher education dramatically improves one’s ability to save. Shown in the table below, those with a bachelor’s degree or higher are three times more likely to have leftover money than those without a high school diploma.
| Education | Always/Often | Sometimes | Rarely/Never |
|---|---|---|---|
| No HS Diploma | 18% | 26% | 56% |
| HS Diploma | 28% | 33% | 39% |
| Associate Degree | 33% | 31% | 36% |
| Bachelor/Higher Degree | 59% | 21% | 20% |
| All Adults | 39% | 33% | 27% |
Note: Percentages are rounded and may not sum to 100.
As the Bureau of Labor Statistics notes, earnings improve with every level of education completed.
For example, those with a high school diploma made 25% more than those without in 2022. And as the qualifications increase, the effects keep stacking.
Meanwhile, a Federal Reserve study also found that those with more education tended to make financial decisions that contributed to building wealth, of which the first step is to save.

-

 Markets1 week ago
U.S. Debt Interest Payments Reach $1 Trillion
-

 Markets2 weeks ago
Ranked: The Most Valuable Housing Markets in America
-

 Money2 weeks ago
Which States Have the Highest Minimum Wage in America?
-

 AI2 weeks ago
Ranked: Semiconductor Companies by Industry Revenue Share
-

 Markets2 weeks ago
Ranked: The World’s Top Flight Routes, by Revenue
-

 Countries2 weeks ago
Population Projections: The World’s 6 Largest Countries in 2075
-

 Markets2 weeks ago
The Top 10 States by Real GDP Growth in 2023
-

 Money2 weeks ago
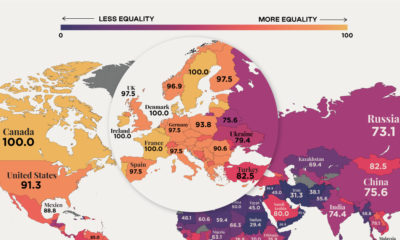
The Smallest Gender Wage Gaps in OECD Countries