Datastream
Purchasing Power of the U.S. Dollar Over Time


The Briefing
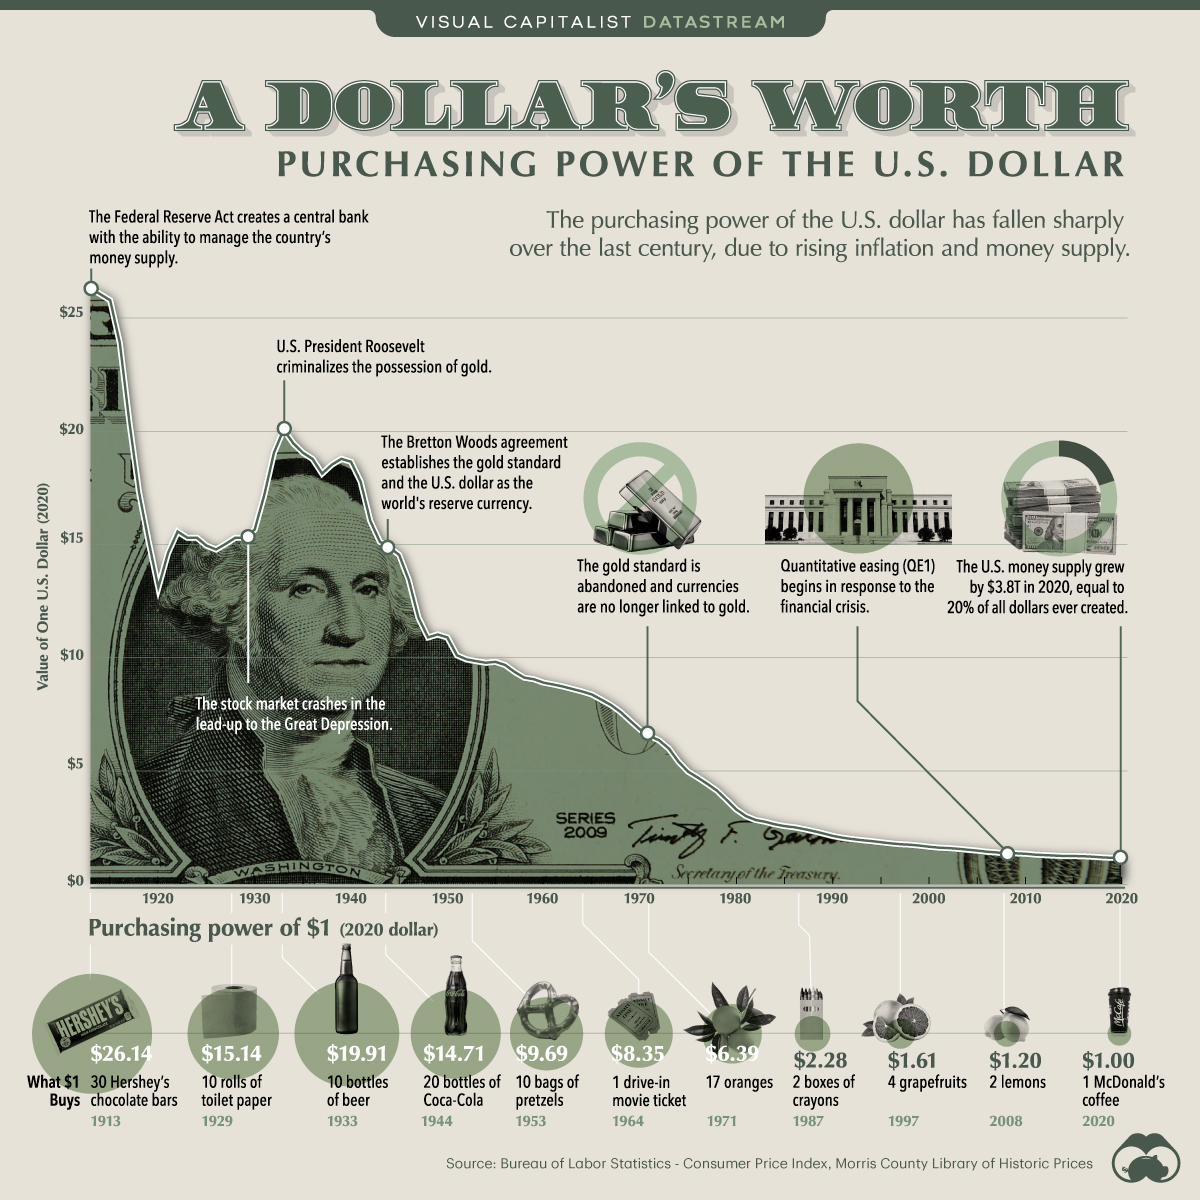
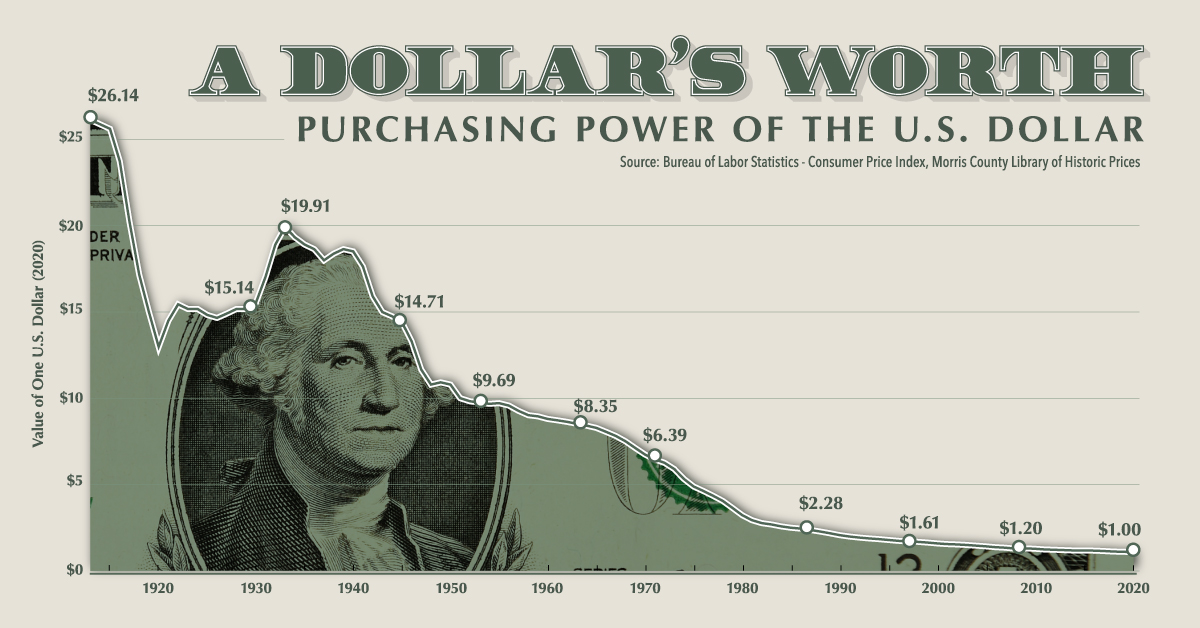
- The purchasing power of the U.S. dollar has fallen over time, as money supply has grown
- In fact, $1 in 1913 had the same purchasing power as $26 in 2020
What is Purchasing Power?
The purchasing power of a currency is the amount of goods and services that can be bought with one unit of the currency.
For example, one U.S. dollar could buy 10 bottles of beer in 1933. Today, it’s the cost of a small McDonald’s coffee. In other words, the purchasing power of the dollar—its value in terms of what it can buy—has decreased over time as price levels have risen.
Tracking the Purchasing Power of the Dollar
In 1913, the Federal Reserve Act granted Federal Reserve banks the ability to manage the money supply in order to ensure economic stability. Back then, a dollar could buy 30 Hershey’s chocolate bars.
As more dollars came into circulation, average prices of goods and services increased while the purchasing power of the dollar fell. By 1929, the value of the Consumer Price Index (CPI) was 73% higher than in 1913, but a dollar was now enough only for 10 rolls of toilet paper.
| Year | Event | Purchasing Power of $1 | What a Dollar Buys |
|---|---|---|---|
| 1913 | Creation of the Federal Reserve System | $26.14 | 30 Hershey’s chocolate bars |
| 1929 | Stock market crash | $15.14 | 10 rolls of toilet paper |
| 1933 | Gold possession criminalized | $19.91 | 10 bottles of beer |
| 1944 | Bretton Woods agreement | $14.71 | 20 bottles of Coca-Cola |
| 1953 | End of the Korean War | $9.69 | 10 bags of pretzels |
| 1964 | Escalation of the Vietnam War | $8.35 | 1 drive-in movie ticket |
| 1971 | End of the gold standard | $6.39 | 17 oranges |
| 1987 | "Black Monday" stock market crash | $2.28 | 2 boxes of crayons |
| 1997 | Asian financial crisis | $1.61 | 4 grapefruits |
| 2008 | Global Financial crisis | $1.20 | 2 lemons |
| 2020 | COVID-19 pandemic | $1.00 | 1 McDonald’s coffee |
Between 1929-1933, the purchasing power of the dollar actually increased due to deflation and a 31% contraction in money supply before eventually declining again. Fast forward to 1944 and the U.S. dollar, fixed to gold at a rate of $35/oz, became the world’s reserve currency under the Bretton Woods agreement.
Meanwhile, the U.S. increased its money supply in order to finance the deficits of World War II followed by the Korean war and the Vietnam war. Hence, the buying power of the dollar reduced from 20 bottles of Coca-Cola in 1944 to a drive-in movie ticket in 1964.
By the late 1960s, the number of dollars in circulation was too high to be backed by U.S. gold reserves. President Nixon ceased direct convertibility of U.S. dollars to gold in 1971. This ended both the gold standard and the limit on the amount of currency that could be printed.
More Dollars in the System
Money supply (M2) in the U.S. has skyrocketed over the last two decades, up from $4.6 trillion in 2000 to $19.5 trillion in 2021.
The effects of the rise in money supply were amplified by the financial crisis of 2008 and more recently by the COVID-19 pandemic. In fact, around 20% of all U.S. dollars in the money supply, $3.4 trillion, were created in 2020 alone.
How will the purchasing power of the dollar evolve going forward?
Where does this data come from?
Source: Bureau of Labor Statistics – Consumer Price Index, Morris County Library of Historic Prices
Details: Purchasing power is based on average annual CPI values from 1913-2020 (not seasonally adjusted). Reference base for the CPI is 1982-84 = 100.


Datastream
Can You Calculate Your Daily Carbon Footprint?
Discover how the average person’s carbon footprint impacts the environment and learn how carbon credits can offset your carbon footprint.


The Briefing
- A person’s carbon footprint is substantial, with activities such as food consumption creating as much as 4,500 g of CO₂ emissions daily.
- By purchasing carbon credits from Carbon Streaming Corporation, you can offset your own emissions and fund positive climate action.
Your Everyday Carbon Footprint
While many large businesses and countries have committed to net-zero goals, it is essential to acknowledge that your everyday activities also contribute to global emissions.
In this graphic, sponsored by Carbon Streaming Corporation, we will explore how the choices we make and the products we use have a profound impact on our carbon footprint.
Carbon Emissions by Activity
Here are some of the daily activities and products of the average person and their carbon footprint, according to Clever Carbon.
| Household Activities & Products | CO2 Emissions (g) |
|---|---|
| 💡 Standard Light Bulb (100 watts, four hours) | 172 g |
| 📱 Mobile Phone Use (195 minutes per day)* | 189 g |
| 👕 Washing Machine (0.63 kWh) | 275 g |
| 🔥 Electric Oven (1.56 kWh) | 675 g |
| ♨️ Tumble Dryer (2.5 kWh) | 1,000 g |
| 🧻 Toilet Roll (2 ply) | 1,300 g |
| 🚿 Hot Shower (10 mins) | 2,000 g |
| 🚙 Daily Commute (one hour, by car) | 3,360 g |
| 🍽️ Average Daily Food Consumption (three meals of 600 calories) | 4,500 g |
| *Phone use based on yearly use of 69kg per the source, Reboxed | |
Your choice of transportation plays a crucial role in determining your carbon footprint. For instance, a 15 km daily commute to work on public transport generates an average of 1,464 g of CO₂ emissions. Compared to 3,360 g—twice the volume for a journey the same length by car.
By opting for more sustainable modes of transport, such as cycling, walking, or public transportation, you can significantly reduce your carbon footprint.
Addressing Your Carbon Footprint
One way to compensate for your emissions is by purchasing high-quality carbon credits.
Carbon credits are used to help fund projects that avoid, reduce or remove CO₂ emissions. This includes nature-based solutions such as reforestation and improved forest management, or technology-based solutions such as the production of biochar and carbon capture and storage (CCS).
While carbon credits offer a potential solution for individuals to help reduce global emissions, public awareness remains a significant challenge. A BCG-Patch survey revealed that only 34% of U.S. consumers are familiar with carbon credits, and only 3% have purchased them in the past.
About Carbon Streaming
By financing the creation or expansion of carbon projects, Carbon Streaming Corporation secures the rights to future carbon credits generated by these sustainable projects. You can then purchase these carbon credits to help fund climate solutions around the world and compensate for your own emissions.
Ready to get involved?
>> Learn more about purchasing carbon credits at Carbon Streaming

-

 Maps2 weeks ago
Mapped: Average Wages Across Europe
-

 Money1 week ago
Which States Have the Highest Minimum Wage in America?
-

 Real Estate1 week ago
Ranked: The Most Valuable Housing Markets in America
-

 Markets1 week ago
Charted: Big Four Market Share by S&P 500 Audits
-

 AI1 week ago
The Stock Performance of U.S. Chipmakers So Far in 2024
-

 Automotive2 weeks ago
Almost Every EV Stock is Down After Q1 2024
-

 Money2 weeks ago
Where Does One U.S. Tax Dollar Go?
-

 Green2 weeks ago
Ranked: Top Countries by Total Forest Loss Since 2001