Misc
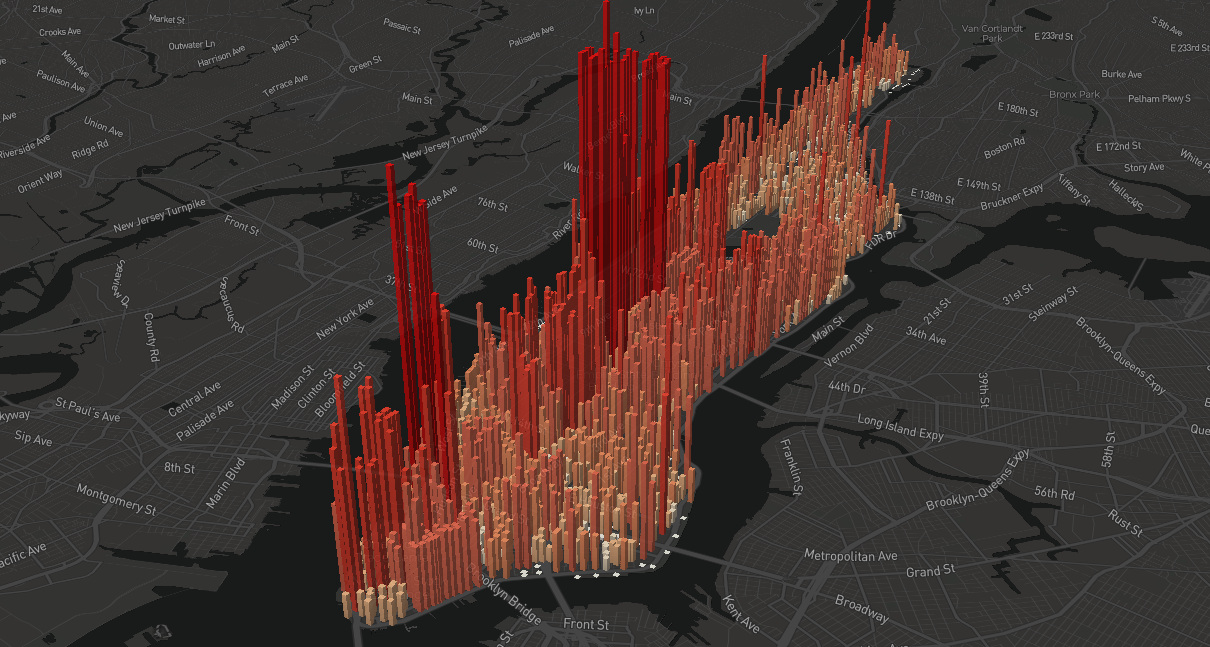
Animation: The Population Pulse of a Manhattan Workday
In cities around the world, the offices and storefronts of the downtown core fill up with people during the workday to keep the wheels of commerce turning.
Nowhere is this phenomenon as pronounced as in Manhattan, which swells to an incredible four million people during work hours. Today’s animation, created by Justin Fung, is a dramatic, eye-opening look at the “pulse” of America’s largest city.
Also, check out the fancy interactive version of this visualization.
This dramatic shift in population on a daily basis is made possible by Manhattan’s unparalleled carrying capacity, or its ability to facilitate an inflow of millions of people who come for all sorts of reasons. Many of the metropolises with the most dramatic daytime population spikes, such as Washington, D.C. and New York, also have much higher rates of transit ridership than the average city.
Not surprisingly, three surrounding boroughs have the largest daytime population decreases in the entire country.
| Borough | Daytime Population Change |
|---|---|
| Queens | -366,000 |
| Brooklyn | -297,000 |
| Bronx | -162,000 |
Outside the Big Apple
While many parts of Manhattan remain lively in the evening, many downtown cores around the country simply empty out.
This stark contrast is particularly noticeable in low-rise communities with large employment hubs such as Redmond, Washington or Palo Alto, California, both of which are home to sprawling tech campuses.
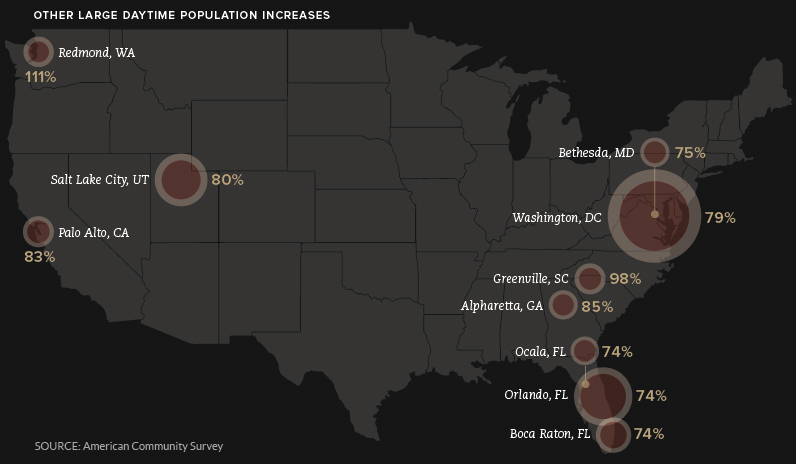
In the case of the nation’s capital, the city is a powerful magnet for talent. As well, Washington’s unique position between state lines means that people have the option of residing in Virginia or Maryland and easily commuting in.
Higher Resting Heartbeat
Thanks to a renewed interest in urban living, many cities are starting to see an uptick in the number of residents who choose to skip the long commute and just live where the action is.
This trend is particularly pronounced in Canadian cities such as Vancouver and Toronto. The latter city’s downtown population is expected to double over the next 25 years, while Vancouver’s sustained real estate boom has added tens of thousands of residents to the downtown area.
In the U.S., Seattle has demonstrated significant urban residential growth. Since 2010, the population of downtown and surrounding neighborhoods has grown by an impressive 18%, and 1-in-5 people moving to the city choose to live in the downtown area.
The 2020 U.S. Census will provide a much better clearer picture of how this trend is playing out.


Misc
How Hard Is It to Get Into an Ivy League School?
We detail the admission rates and average annual cost for Ivy League schools, as well as the median SAT scores required to be accepted.


How Hard Is It to Get Into an Ivy League School?
This was originally posted on our Voronoi app. Download the app for free on iOS or Android and discover incredible data-driven charts from a variety of trusted sources.
Ivy League institutions are renowned worldwide for their academic excellence and long-standing traditions. But how hard is it to get into one of the top universities in the U.S.?
In this graphic, we detail the admission rates and average annual cost for Ivy League schools, as well as the median SAT scores required to be accepted. The data comes from the National Center for Education Statistics and was compiled by 24/7 Wall St.
Note that “average annual cost” represents the net price a student pays after subtracting the average value of grants and/or scholarships received.
Harvard is the Most Selective
The SAT is a standardized test commonly used for college admissions in the United States. It’s taken by high school juniors and seniors to assess their readiness for college-level academic work.
When comparing SAT scores, Harvard and Dartmouth are among the most challenging universities to gain admission to. The median SAT scores for their students are 760 for reading and writing and 790 for math. Still, Harvard has half the admission rate (3.2%) compared to Dartmouth (6.4%).
| School | Admission rate (%) | SAT Score: Reading & Writing | SAT Score: Math | Avg Annual Cost* |
|---|---|---|---|---|
| Harvard University | 3.2 | 760 | 790 | $13,259 |
| Columbia University | 3.9 | 750 | 780 | $12,836 |
| Yale University | 4.6 | 760 | 780 | $16,341 |
| Brown University | 5.1 | 760 | 780 | $26,308 |
| Princeton University | 5.7 | 760 | 780 | $11,080 |
| Dartmouth College | 6.4 | 760 | 790 | $33,023 |
| University of Pennsylvania | 6.5 | 750 | 790 | $14,851 |
| Cornell University | 7.5 | 750 | 780 | $29,011 |
*Costs after receiving federal financial aid.
Additionally, Dartmouth has the highest average annual cost at $33,000. Princeton has the lowest at $11,100.
While student debt has surged in the United States in recent years, hitting $1.73 trillion in 2023, the worth of obtaining a degree from any of the schools listed surpasses mere academics. This is evidenced by the substantial incomes earned by former students.
Harvard grads, for example, have the highest average starting salary in the country, at $91,700.

-

 Mining2 weeks ago
Charted: The Value Gap Between the Gold Price and Gold Miners
-

 Real Estate1 week ago
Ranked: The Most Valuable Housing Markets in America
-

 Business1 week ago
Charted: Big Four Market Share by S&P 500 Audits
-

 AI1 week ago
The Stock Performance of U.S. Chipmakers So Far in 2024
-

 Misc1 week ago
Almost Every EV Stock is Down After Q1 2024
-

 Money2 weeks ago
Where Does One U.S. Tax Dollar Go?
-

 Green2 weeks ago
Ranked: Top Countries by Total Forest Loss Since 2001
-

 Real Estate2 weeks ago
Visualizing America’s Shortage of Affordable Homes