Datastream
Poll: Inflation is the Top Financial Concern for Americans
The Briefing
- Inflation has quickly become the top financial concern for American families
- Compared to 2021, far fewer Americans believe their financial situation is improving
Poll: Inflation is the Top Financial Concern for Americans
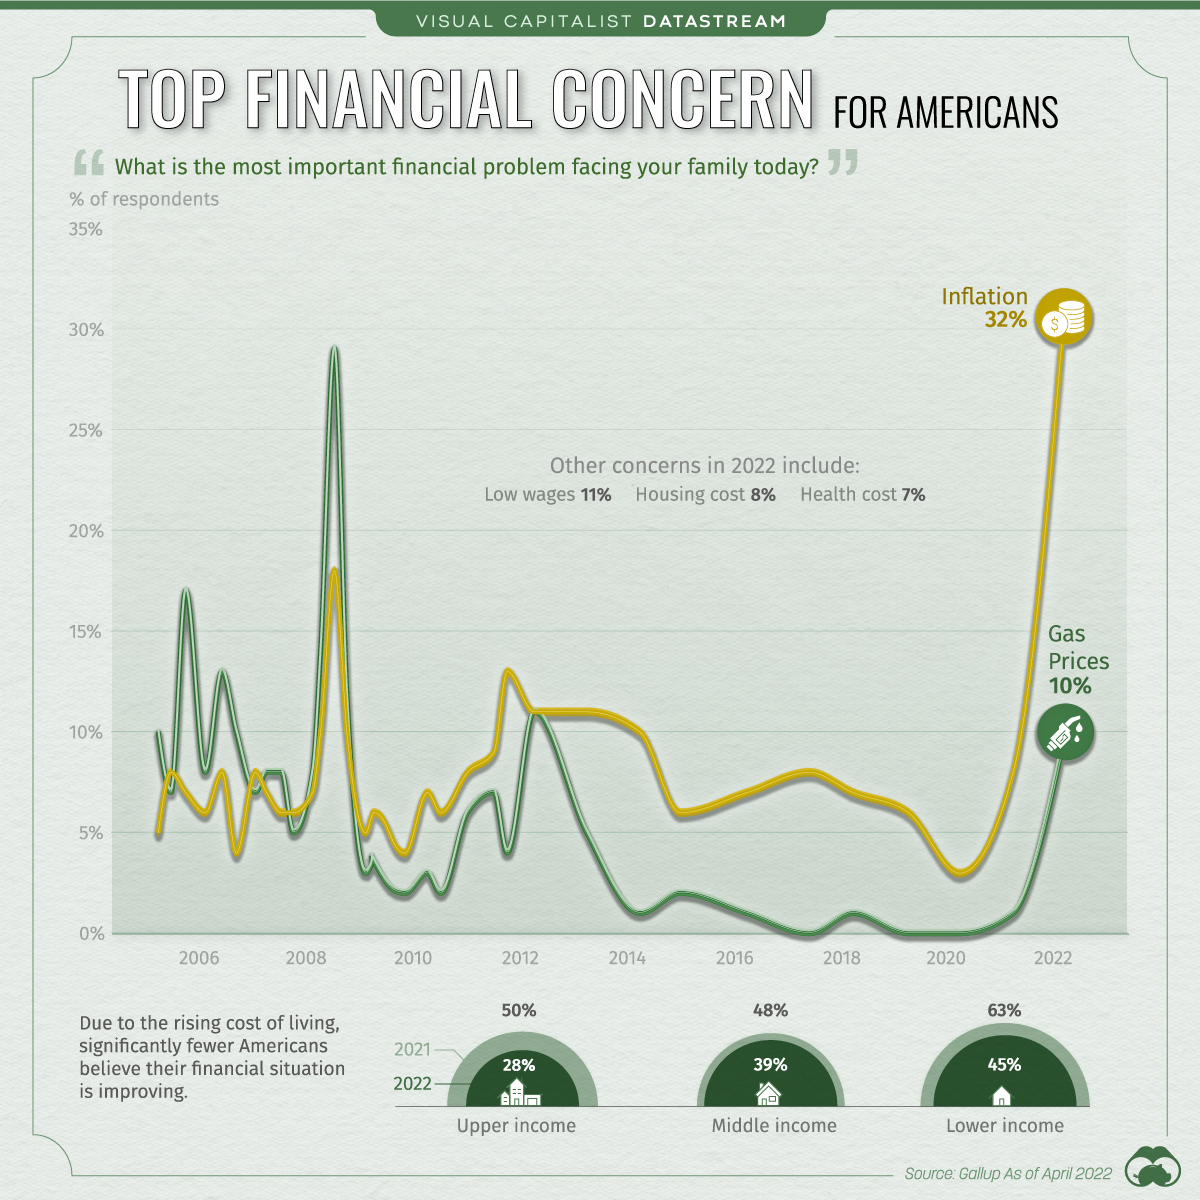
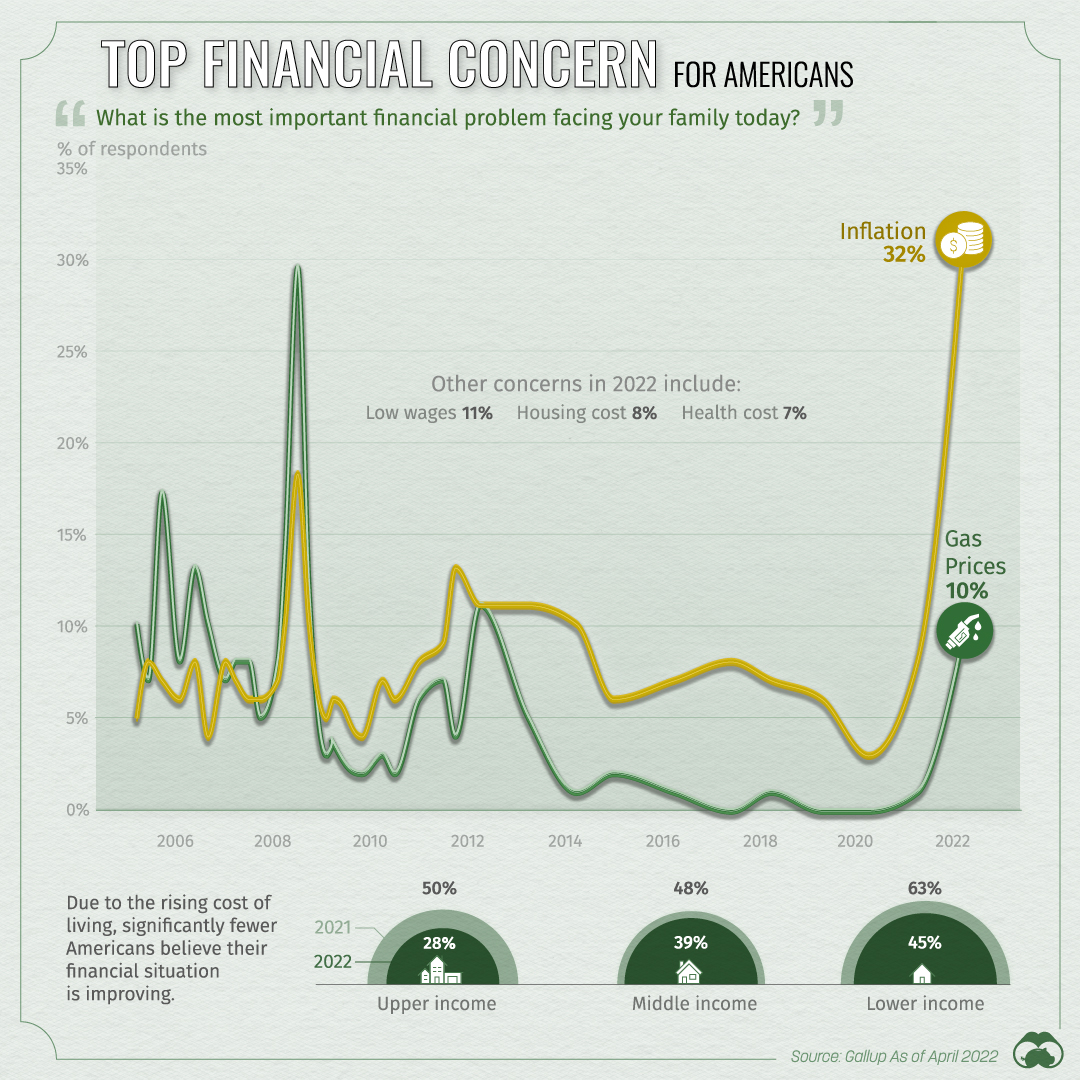
A recent survey by Gallup discovered that inflation has become the top financial concern for Americans, surpassing other issues like low wages and housing costs.
While this result may not be too surprising, it is interesting to see how today’s concerns compare to that of previous years. For reference, the Consumer Price Index (CPI) has grown 8.3% between April 2021 and April 2022, representing a near 40-year high.
Poll Results
Results were collected in April 2022 and are based on the responses of over 1,000 U.S. adults. In this case, the specific question was: What is the most important financial problem facing your family today?
| Trend | April 2022 | April 2021 | April 2020 | April 2019 |
|---|---|---|---|---|
| Inflation | 32% | 8% | 3% | 6% |
| Low wages | 11% | 10% | 11% | 11% |
| Gas prices | 10% | 1% | -- | -- |
| Housing costs | 8% | 9% | 9% | 8% |
| Health care costs | 7% | 8% | 8% | 17% |
Percentage of respondents. Includes the top five categories, based on April 2022 results.
Based on these results, we can see that inflation began to gain momentum in early 2021. Rising gas prices, which are a significant contributor to overall inflation, also popped up in 2021.
Implications
Significantly fewer Americans feel confident about their financial situation due to the rising cost of living. This was captured in the same Gallup survey referenced above.
| Income Group | 2022 | 2021 | Percentage point decrease |
|---|---|---|---|
| Upper | 50% | 28% | -22 |
| Middle | 48% | 39% | -9 |
| Lower | 63% | 45% | -18 |
Percentage of respondents who say their personal financial situation is improving.
The largest decreases were seen among the upper and lower income groups.
Upper income families tend to own more financial assets like stocks and bonds. An inflationary environment, especially when combined with rising interest rates, can eat away at the returns generated by these assets, which could explain this cohort’s drop in optimism.
Lower income families, on the other hand, are more likely to be struggling already. In fact, a 2017 report found that six in 10 Americans don’t have $500 in savings. With this in mind, it’s easy to see how an increase in the price of food or gas could cause worry.
Where does this data come from?
Source: Gallup
Notes: Interviews conducted April 1-19, 2022, with a random sample of 1,018 adults, aged 18 and older, living in all 50 U.S. states and the District of Columbia. For results based on the total sample of national adults, the margin of sampling error is ±4 percentage points at the 95% confidence level.


Datastream
Can You Calculate Your Daily Carbon Footprint?
Discover how the average person’s carbon footprint impacts the environment and learn how carbon credits can offset your carbon footprint.


The Briefing
- A person’s carbon footprint is substantial, with activities such as food consumption creating as much as 4,500 g of CO₂ emissions daily.
- By purchasing carbon credits from Carbon Streaming Corporation, you can offset your own emissions and fund positive climate action.
Your Everyday Carbon Footprint
While many large businesses and countries have committed to net-zero goals, it is essential to acknowledge that your everyday activities also contribute to global emissions.
In this graphic, sponsored by Carbon Streaming Corporation, we will explore how the choices we make and the products we use have a profound impact on our carbon footprint.
Carbon Emissions by Activity
Here are some of the daily activities and products of the average person and their carbon footprint, according to Clever Carbon.
| Household Activities & Products | CO2 Emissions (g) |
|---|---|
| 💡 Standard Light Bulb (100 watts, four hours) | 172 g |
| 📱 Mobile Phone Use (195 minutes per day)* | 189 g |
| 👕 Washing Machine (0.63 kWh) | 275 g |
| 🔥 Electric Oven (1.56 kWh) | 675 g |
| ♨️ Tumble Dryer (2.5 kWh) | 1,000 g |
| 🧻 Toilet Roll (2 ply) | 1,300 g |
| 🚿 Hot Shower (10 mins) | 2,000 g |
| 🚙 Daily Commute (one hour, by car) | 3,360 g |
| 🍽️ Average Daily Food Consumption (three meals of 600 calories) | 4,500 g |
| *Phone use based on yearly use of 69kg per the source, Reboxed | |
Your choice of transportation plays a crucial role in determining your carbon footprint. For instance, a 15 km daily commute to work on public transport generates an average of 1,464 g of CO₂ emissions. Compared to 3,360 g—twice the volume for a journey the same length by car.
By opting for more sustainable modes of transport, such as cycling, walking, or public transportation, you can significantly reduce your carbon footprint.
Addressing Your Carbon Footprint
One way to compensate for your emissions is by purchasing high-quality carbon credits.
Carbon credits are used to help fund projects that avoid, reduce or remove CO₂ emissions. This includes nature-based solutions such as reforestation and improved forest management, or technology-based solutions such as the production of biochar and carbon capture and storage (CCS).
While carbon credits offer a potential solution for individuals to help reduce global emissions, public awareness remains a significant challenge. A BCG-Patch survey revealed that only 34% of U.S. consumers are familiar with carbon credits, and only 3% have purchased them in the past.
About Carbon Streaming
By financing the creation or expansion of carbon projects, Carbon Streaming Corporation secures the rights to future carbon credits generated by these sustainable projects. You can then purchase these carbon credits to help fund climate solutions around the world and compensate for your own emissions.
Ready to get involved?
>> Learn more about purchasing carbon credits at Carbon Streaming

-

 Green2 weeks ago
Ranked: Top Countries by Total Forest Loss Since 2001
-

 Travel1 week ago
Ranked: The World’s Top Flight Routes, by Revenue
-

 Technology2 weeks ago
Ranked: Semiconductor Companies by Industry Revenue Share
-

 Money2 weeks ago
Which States Have the Highest Minimum Wage in America?
-

 Real Estate2 weeks ago
Ranked: The Most Valuable Housing Markets in America
-

 Markets2 weeks ago
Charted: Big Four Market Share by S&P 500 Audits
-

 AI2 weeks ago
The Stock Performance of U.S. Chipmakers So Far in 2024
-

 Automotive2 weeks ago
Almost Every EV Stock is Down After Q1 2024