Technology
Visualized: A Snapshot of the Global Personal Tech Market


A Snapshot of the Global Personal Tech Market
For many, it’s become difficult to function in day-to-day life without the use of a mobile phone. The average American checks their phone 96 times a day—that’s once every 10 minutes.
But it’s not just mobile phones that have become increasingly intertwined with our everyday lives. A plethora of accessories and devices, known as smartphone multipliers, have surged in popularity—this market is set to generate $459 billion in revenue by the end of 2020.
Which brands are capitalizing on this lucrative market? Today’s graphic provides a snapshot of the leading tech brands currently dominating the personal tech space, based on the most recent global market share data on shipments and installs.
How the Brands Stack Up, by Personal Tech Device
Though far from exhaustive, we’ve selected a few popular devices to hone in on, providing key insights on some of the top players in the personal tech space as of 2020.
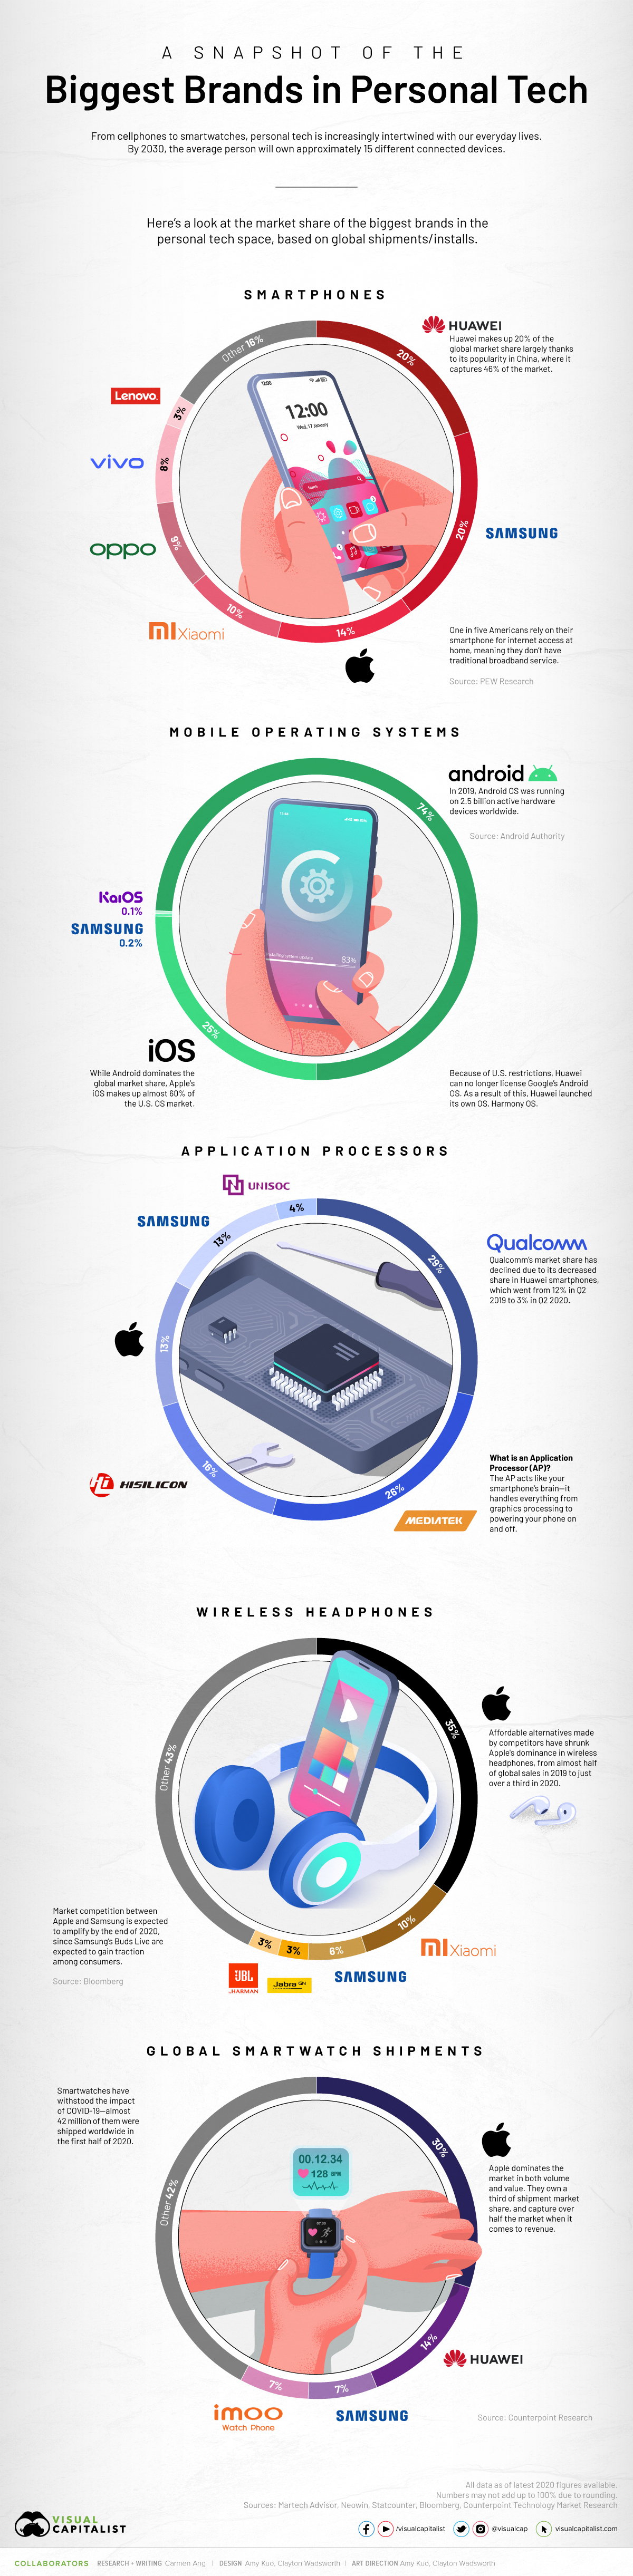
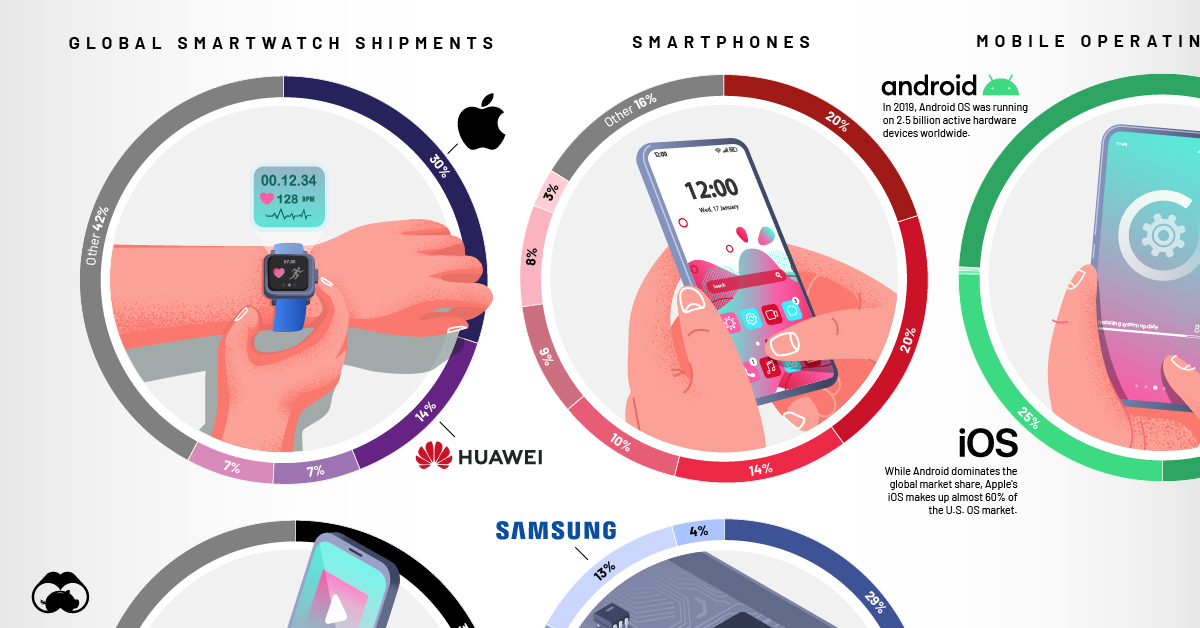
Smartphones
Smartphones are an essential part of the personal tech conversation—by 2025, there will be an estimated 5.8 billion smartphone users worldwide, or roughly 70% of the global population.
| Brand | Global Smartphone Shipments Market Share |
|---|---|
| Huawei | 20% |
| Samsung | 20% |
| Apple | 14% |
| Xiaomi | 10% |
| Oppo | 9% |
| Vivo | 8% |
| Lenovo | 3% |
| Other | 16% |
Currently, Huawei and Samsung hold the largest share of the global market, at 20% each. Chinese company Huawei’s dominance is concentrated in its home country, where it captures almost half of smartphone sales. Like Huawei, Samsung’s market dominance is amplified in its home country South Korea, where it makes up 67% of the market.
While Apple lags slightly behind Huawei and Samsung in global sales, the company rules in the U.S., where it captures 46% of market share.
Why isn’t Apple as successful in other parts of the world? A big factor is price. For instance, 90% of smartphones in India cost around $300, while iPhones start at $999.
Smartphone Operating Systems
Of course, smartphones are useless without an operating system (OS). Each smartphone OS essentially acts as your phone’s nervous system, running all applications and programs, as well as managing network and WiFi connectivity.
| Brand | Global Market Share (by units) |
|---|---|
| Android | 74.3% |
| iOS | 25.2% |
| Samsung | 0.2% |
| KaiOS | 0.1% |
| Unknown | 0.1% |
When it comes to the OS market, Google-owned Android dominates by a landslide, making up 74% of global market share. This makes sense, considering that both the leading smartphone companies, Huawei and Samsung, use Android OS on a number of their devices.
However, it’s important to note that newer Huawei phones won’t operate on Android. When the Chinese tech giant was blacklisted in the U.S., it was no longer able to license Android’s OS. As a result, Huawei launched its own HarmonyOS to fill the gap.
Smartphone Application Processors
If a smartphone’s OS acts like its nervous system, then the application processor (AP) functions like a brain. APs handle everything from image processing and graphics to powering your phone on and off.
| Brand | Global Market Share (by units) |
|---|---|
| Qualcomm | 29% |
| MediaTek | 26% |
| HiSilicon | 16% |
| Apple | 13% |
| Samsung | 13% |
| Unisoc | 4% |
Qualcomm is currently the largest provider of application processors, capturing almost 30% of the global market share. While it currently holds the top spot, its market share has declined since 2019, largely due to a decrease in usage in Huawei products.
After being banned in the U.S., Huawei shifted suppliers for this crucial part. Instead of buying from Qualcomm—an American company—it now relies on HiSilicon, which is based in China.
Wireless Headphones
The wireless headphone market is growing fast—in 2019, it was valued at $2.5 billion. Between 2020 to 2027, it’s set to increase at a compound annual growth rate (CAGR) of 20.3%.
| Brand | Global Sales Units Market Share |
|---|---|
| Apple | 35% |
| Xiaomi | 10% |
| Samsung | 6% |
| Jabra | 3% |
| JBL | 3% |
| Other | 43% |
Apple currently dominates the wireless headphone space, making up over a third of global market share. The company is expected to sell 82 million units by the end of 2020.
Despite this, it’s important to note that Apple’s dominance has decreased significantly in 2020 compared to 2019, when it captured over 50% of the global market. Apple’s decline is likely due to the emergence of cheaper alternatives from companies like Lypertek Tevi or 1More, which offer comparable products at about half the cost of Apple’s AirPods.
Smartwatches
Health and wellness have been top priorities among consumers recently, which has had a positive impact on the global smartwatch market—in the first half of 2020, it’s shown a 20% growth in revenue, compared to a year prior.
| Brand | Global Smartwatch Shipments Market Share |
|---|---|
| Apple | 30% |
| Huawei | 14% |
| Samsung | 7% |
| imoo | 7% |
| Other | 42% |
Like wireless headphones, Apple dominates the smartwatch market, in both volume and value. When looking at global shipments in Q2 2020, the company makes up 30% of the market share—however, in terms of revenue, Apple’s piece of the pie rises to 50%.
The Only Constant is Change
It’s clear that no matter who leads the list for each type of personal tech, these spots are never static—there’s always room for disruption.
How long will Apple hold its top spot in the wireless headphone market? Will Qualcomm’s dominance of the AP market continue to shrink?
Things are certain to change—the only question is, how?


Technology
Visualizing AI Patents by Country
See which countries have been granted the most AI patents each year, from 2012 to 2022.


Visualizing AI Patents by Country
This was originally posted on our Voronoi app. Download the app for free on iOS or Android and discover incredible data-driven charts from a variety of trusted sources.
This infographic shows the number of AI-related patents granted each year from 2010 to 2022 (latest data available). These figures come from the Center for Security and Emerging Technology (CSET), accessed via Stanford University’s 2024 AI Index Report.
From this data, we can see that China first overtook the U.S. in 2013. Since then, the country has seen enormous growth in the number of AI patents granted each year.
| Year | China | EU and UK | U.S. | RoW | Global Total |
|---|---|---|---|---|---|
| 2010 | 307 | 137 | 984 | 571 | 1,999 |
| 2011 | 516 | 129 | 980 | 581 | 2,206 |
| 2012 | 926 | 112 | 950 | 660 | 2,648 |
| 2013 | 1,035 | 91 | 970 | 627 | 2,723 |
| 2014 | 1,278 | 97 | 1,078 | 667 | 3,120 |
| 2015 | 1,721 | 110 | 1,135 | 539 | 3,505 |
| 2016 | 1,621 | 128 | 1,298 | 714 | 3,761 |
| 2017 | 2,428 | 144 | 1,489 | 1,075 | 5,136 |
| 2018 | 4,741 | 155 | 1,674 | 1,574 | 8,144 |
| 2019 | 9,530 | 322 | 3,211 | 2,720 | 15,783 |
| 2020 | 13,071 | 406 | 5,441 | 4,455 | 23,373 |
| 2021 | 21,907 | 623 | 8,219 | 7,519 | 38,268 |
| 2022 | 35,315 | 1,173 | 12,077 | 13,699 | 62,264 |
In 2022, China was granted more patents than every other country combined.
While this suggests that the country is very active in researching the field of artificial intelligence, it doesn’t necessarily mean that China is the farthest in terms of capability.
Key Facts About AI Patents
According to CSET, AI patents relate to mathematical relationships and algorithms, which are considered abstract ideas under patent law. They can also have different meaning, depending on where they are filed.
In the U.S., AI patenting is concentrated amongst large companies including IBM, Microsoft, and Google. On the other hand, AI patenting in China is more distributed across government organizations, universities, and tech firms (e.g. Tencent).
In terms of focus area, China’s patents are typically related to computer vision, a field of AI that enables computers and systems to interpret visual data and inputs. Meanwhile America’s efforts are more evenly distributed across research fields.
Learn More About AI From Visual Capitalist
If you want to see more data visualizations on artificial intelligence, check out this graphic that shows which job departments will be impacted by AI the most.

-

 Markets1 week ago
U.S. Debt Interest Payments Reach $1 Trillion
-

 Business2 weeks ago
Charted: Big Four Market Share by S&P 500 Audits
-

 Real Estate2 weeks ago
Ranked: The Most Valuable Housing Markets in America
-

 Money2 weeks ago
Which States Have the Highest Minimum Wage in America?
-

 AI2 weeks ago
Ranked: Semiconductor Companies by Industry Revenue Share
-

 Markets2 weeks ago
Ranked: The World’s Top Flight Routes, by Revenue
-

 Demographics2 weeks ago
Population Projections: The World’s 6 Largest Countries in 2075
-

 Markets2 weeks ago
The Top 10 States by Real GDP Growth in 2023