Stocks
Penny Stocks 101
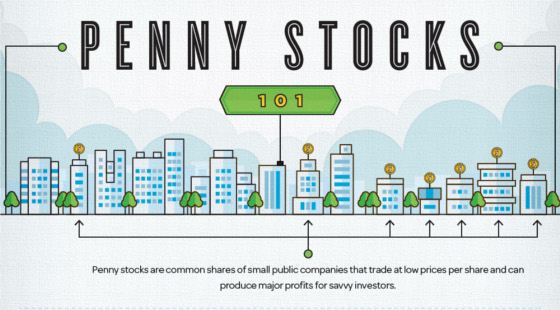
Penny Stocks 101
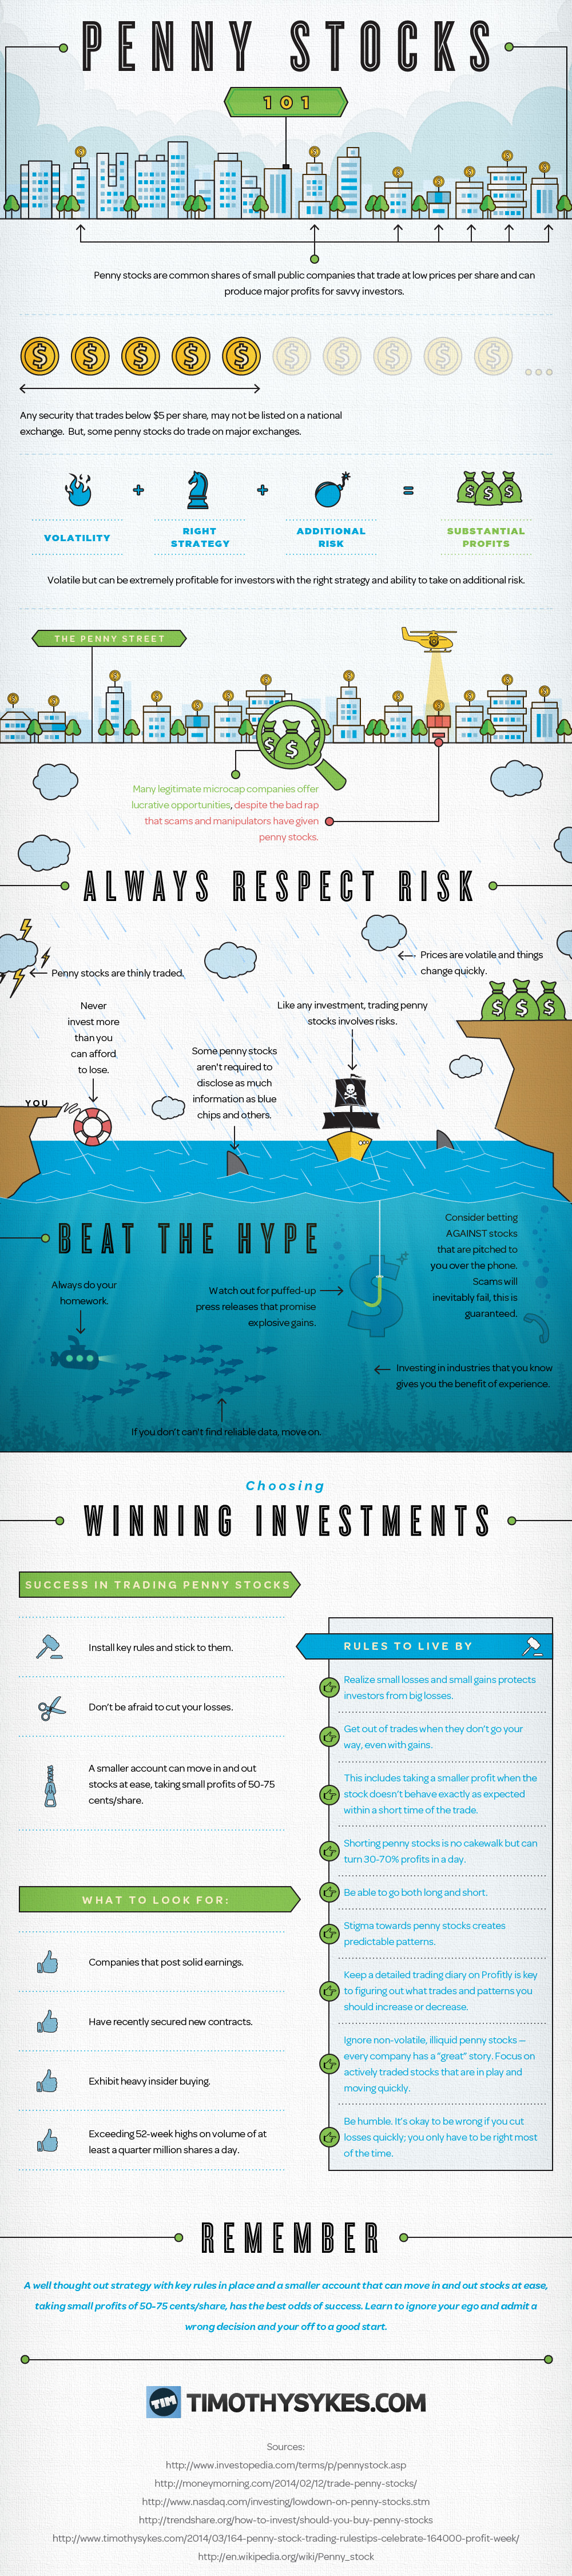
Microcap stocks, also known as penny stocks, are stocks that are trading at less than $5 each with small market capitalizations typically under $300 million. More specifically, as Doug Casey defines it here, many of these types of stocks are more accurately defined as speculations rather than investments. They have no earnings or predictable cash flow, and can’t be evaluated in the ways that Benjamin Graham or Warren Buffett may value a company.
Casey, a legendary speculator, is also well known for saying that he would rather risk 10% of his portfolio for a potential 100% gain, rather than 100% of his portfolio for a 10% gain. The above infographic covers some of the ins and outs of trading such stocks, and many of the ideas presented can apply to junior mining, energy, and technology stocks.
From a potential downside perspective, many of the companies in this category can be risky, unpredictable, and thinly traded. However, for savvy speculators, these same stocks can provide upside that is hard to match. It is all about the approach.
Microcap stocks are inherently volatile, but for those that can stomach it, there is a big profit opportunity. Furthermore, hidden in the market are companies that do have game changing plans or discoveries that could see their valuations rise more than 10x (a ten-bagger, as industry people call it). The key is being able to put in the time, due diligence, and using the right strategy to discover these companies. Being able to let go of opportunities that did not work out by cutting losses early can also be a key.
Original graphic from: Timothy Sykes


Markets
Visualizing the Biggest Companies on Major Stock Exchanges
With trillion dollar valuations becoming more common, we’ve compared the five biggest companies by stock exchange.
Comparing the Top Five Companies on Major Stock Exchanges
This was originally posted on our Voronoi app. Download the app for free on iOS or Android and discover incredible data-driven charts from a variety of trusted sources.
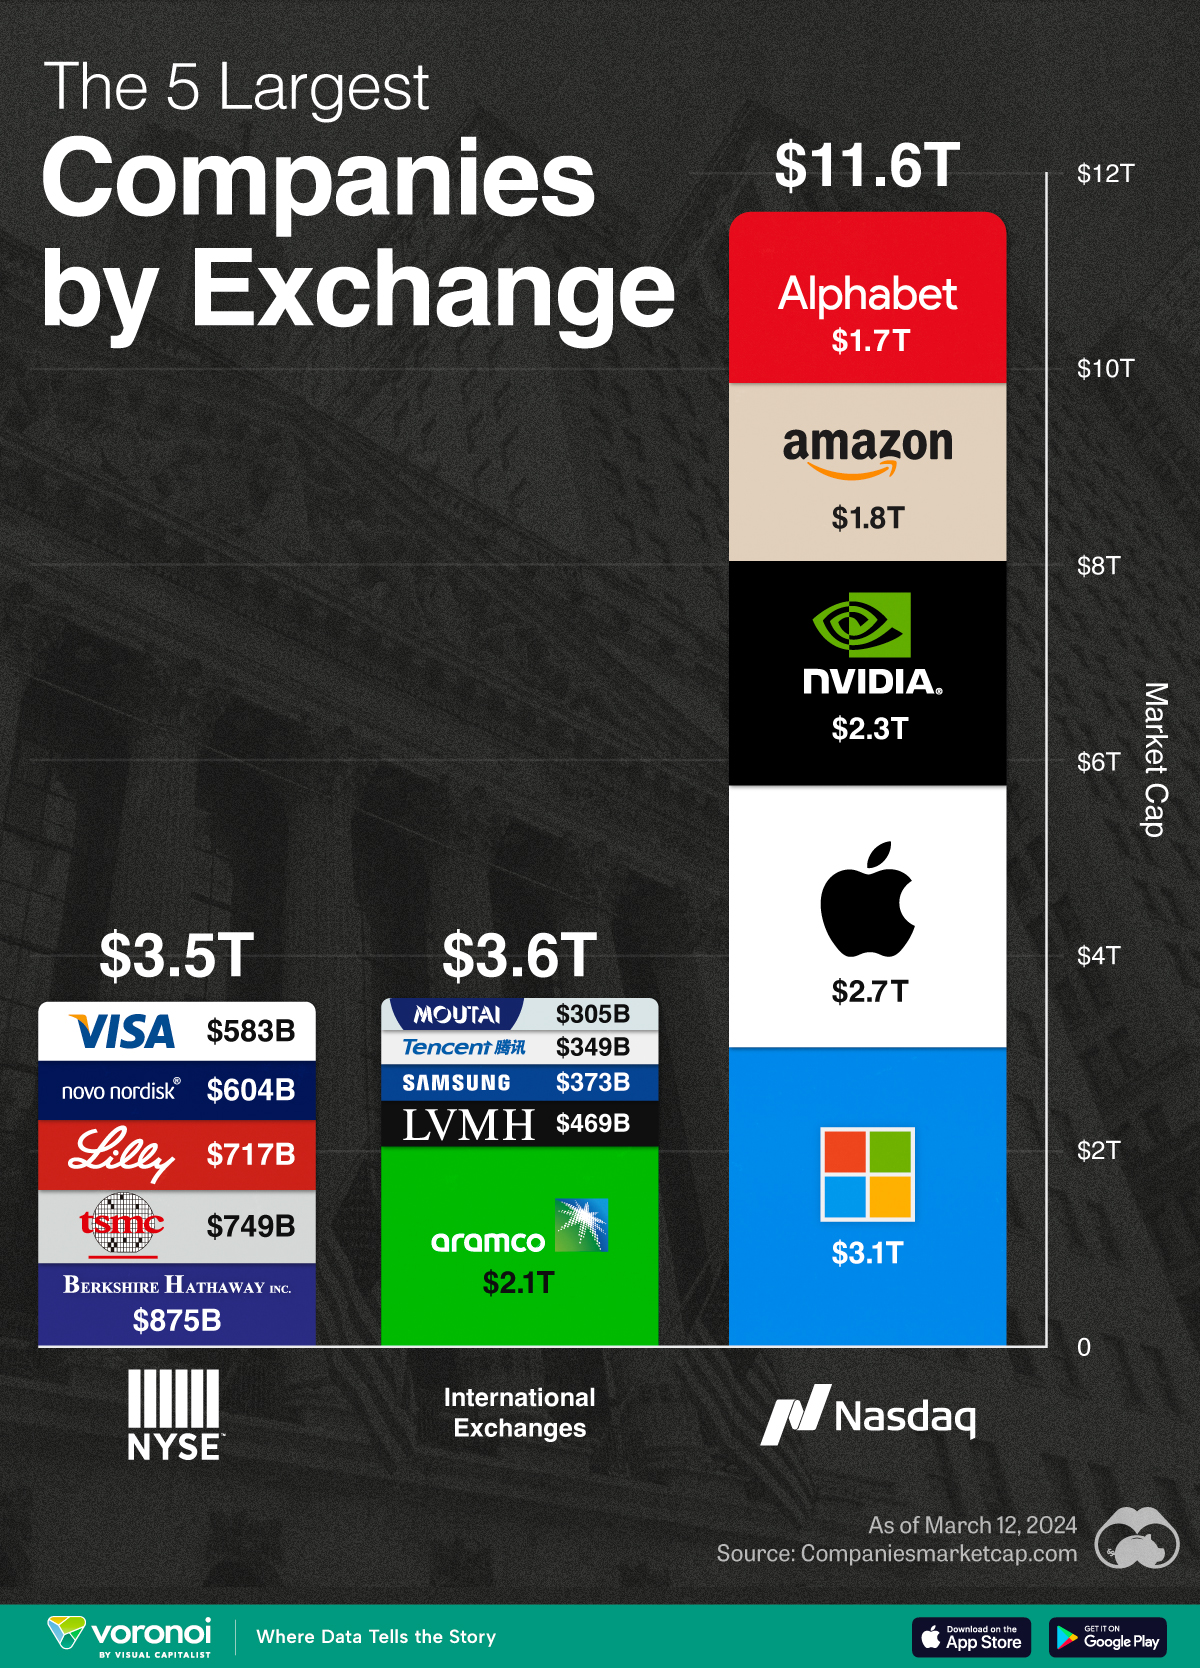
With many companies nearing or surpassing the $1 trillion market capitalization milestone, we’ve put together a graphic that visualizes the five largest companies trading on the Nasdaq, New York Stock Exchange (NYSE), and international exchanges.
These figures come from Companiesmarketcap.com, and are as of March 12, 2024.
Biggest Companies on the Nasdaq
The Nasdaq is largely dominated by the tech industry, with all of its top five companies belonging to the Magnificent Seven group of U.S. tech stocks.
| Company | Market Cap (USD) |
|---|---|
| 🇺🇸 Microsoft | $3.1T |
| 🇺🇸 Apple | $2.7T |
| 🇺🇸 Nvidia | $2.3T |
| 🇺🇸 Amazon | $1.8T |
| $1.7T |
Altogether, these five companies have a combined market capitalization of nearly $12 trillion. To put this figure into context, the entire U.S. equity market is worth around $53 trillion.
Biggest Companies on the NYSE
The NYSE’s largest companies are more diversified, with a combination of tech, financial services, and healthcare names present. Among this list, Warren Buffett’s Berkshire Hathaway is the closest to becoming the next trillion dollar company.
| Company | Market Cap (USD) |
|---|---|
| 🇺🇸 Berkshire Hathaway | $875B |
| 🇹🇼 TSMC | $749B |
| 🇺🇸 Eli Lilly | $717B |
| 🇩🇰 Novo Nordisk | $604B |
| 🇺🇸 Visa | $583B |
Biggest Companies on International Exchanges
Saudi Aramco is the largest public company listed outside of the U.S., with a mammoth $2.1 trillion valuation.
| Company | Market Cap (USD) |
|---|---|
| 🇸🇦 Saudi Aramco | $2.1T |
| 🇫🇷 LVMH | $469B |
| 🇰🇷 Samsung | $373B |
| 🇨🇳 Tencent | $349B |
| 🇨🇳 Kweichow Moutai | $305B |
It should be noted, however, that the Saudi government directly owns 90% of the company, while another 8% is held by the country’s sovereign wealth fund.
This means that only 2% of shares are actually available to the public, prompting one Bloomberg columnist to call the firm’s valuation an “illusion”.

-

 Green2 weeks ago
Ranked: Top Countries by Total Forest Loss Since 2001
-

 Travel1 week ago
Ranked: The World’s Top Flight Routes, by Revenue
-

 Technology1 week ago
Ranked: Semiconductor Companies by Industry Revenue Share
-

 Money2 weeks ago
Which States Have the Highest Minimum Wage in America?
-

 Real Estate2 weeks ago
Ranked: The Most Valuable Housing Markets in America
-

 Markets2 weeks ago
Charted: Big Four Market Share by S&P 500 Audits
-

 AI2 weeks ago
The Stock Performance of U.S. Chipmakers So Far in 2024
-

 Automotive2 weeks ago
Almost Every EV Stock is Down After Q1 2024