
This graphic visualizes the most valuable brands by country in 12 major economies, from tech and energy giants to automakers...


click for more →


Scan with your phone's camera or QR code app to view
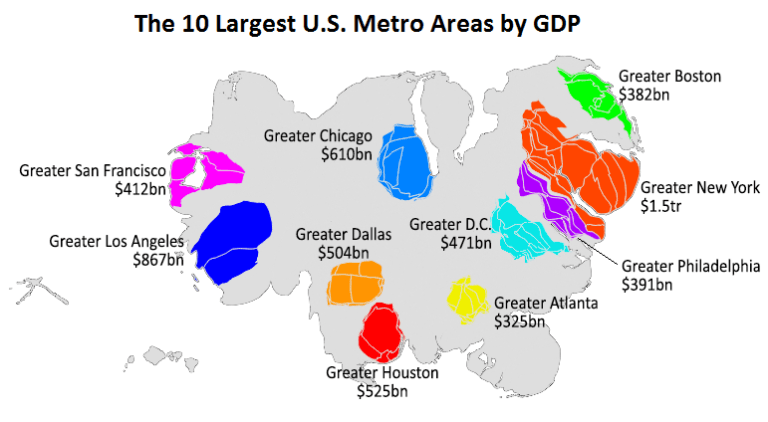
This animation uses county-level GDP data to re-size a U.S. map based on the economic contributions at a local level.
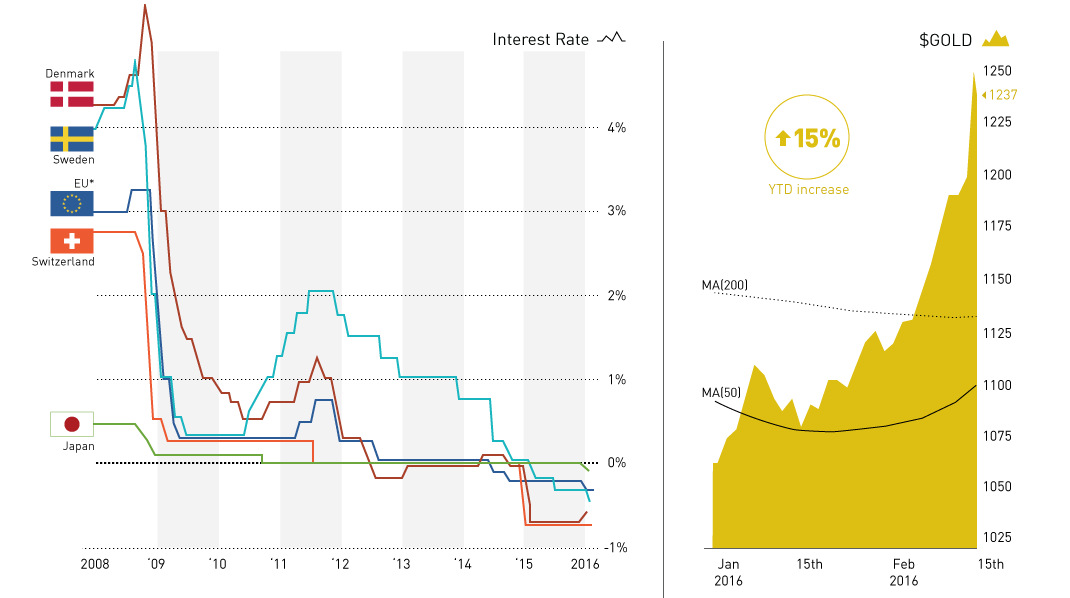
The BoJ describes Peter Pan as the inspiration behind their unprecedented monetary policy. Central bankers are following, but the market disagrees.
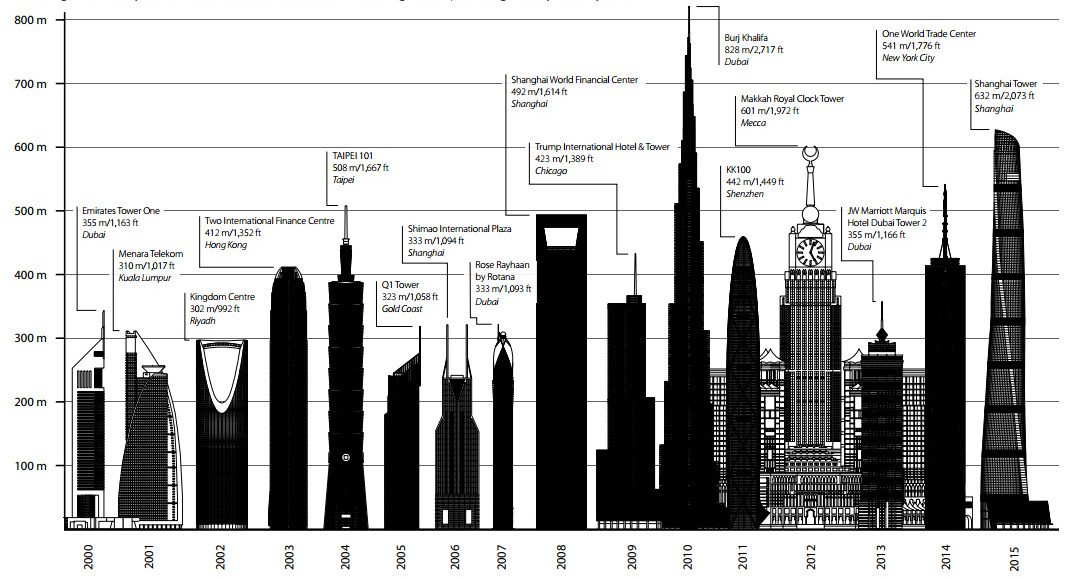
These visualizations show how the tallest skyscraper of 2015 compares to other years, as well as other buildings completed last year.
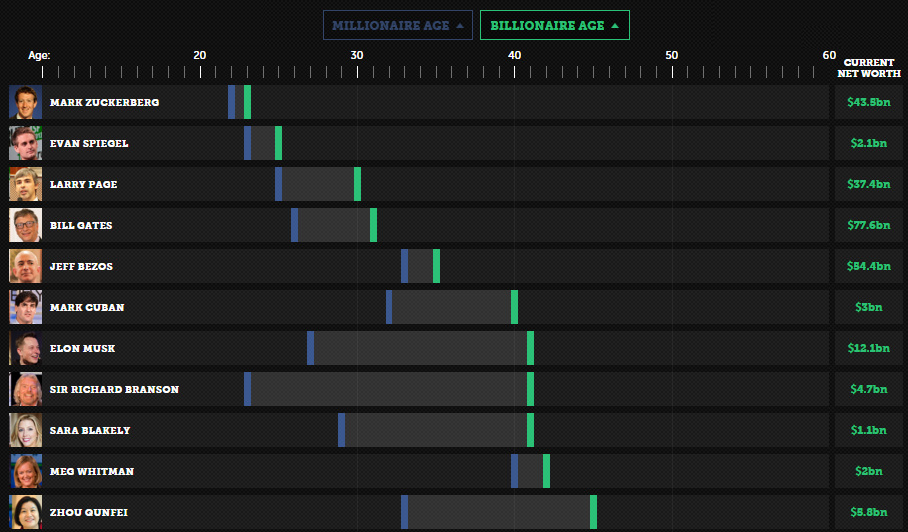
Is it the first million or billion that is the hardest? See how long it took these entrepreneurs to go from millionaire to billionaire.
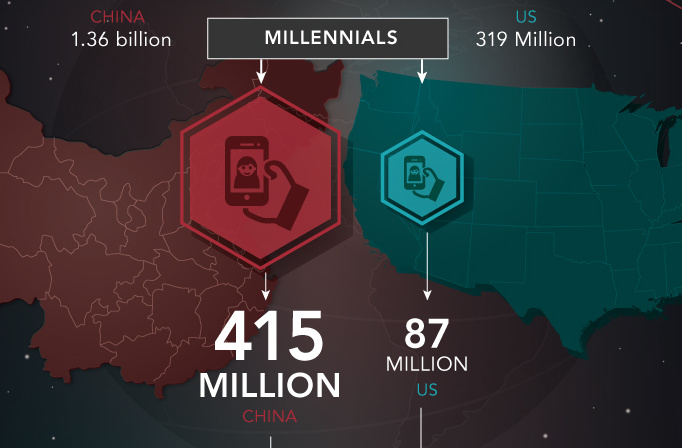
A new generation of spenders is taking over emerging markets. Learn how to profit from the ripple effects this will have on our economy, energy, &...
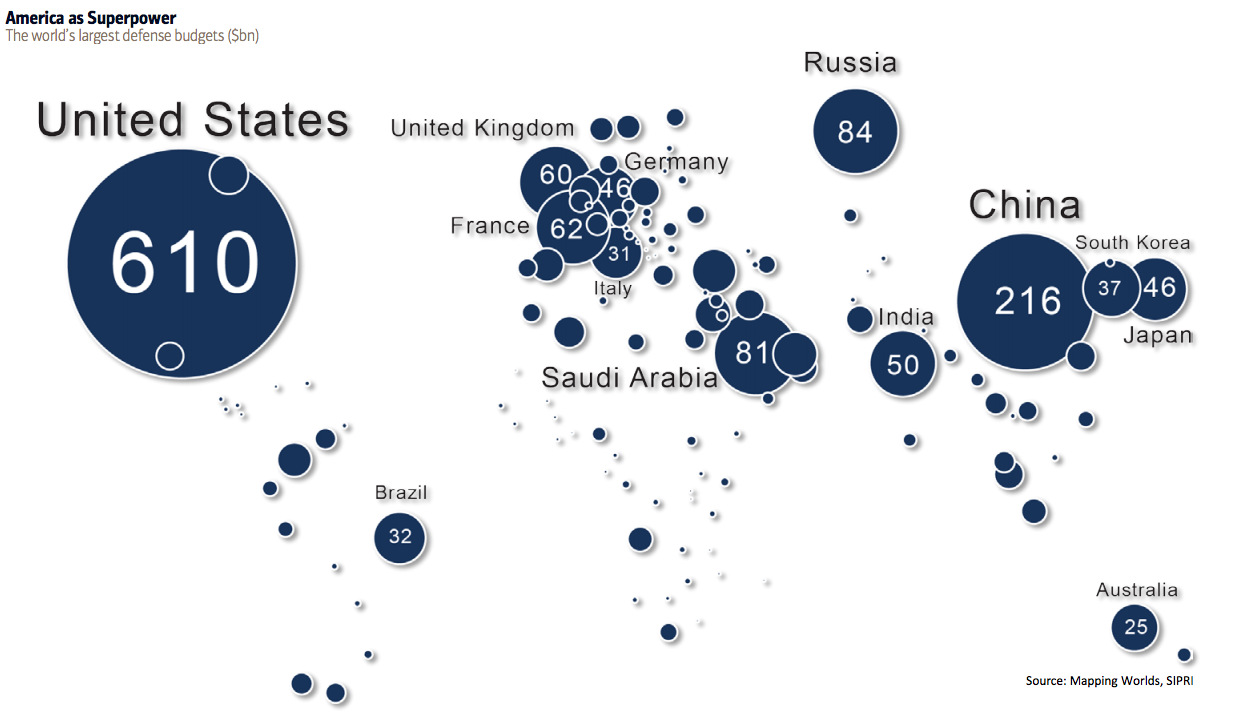
This map shows global defense spending by country - and it puts U.S. military spending into perspective.

The Great Depression was the most severe economic depression ever experienced by the Western world. It was also the most famous case of deflation.
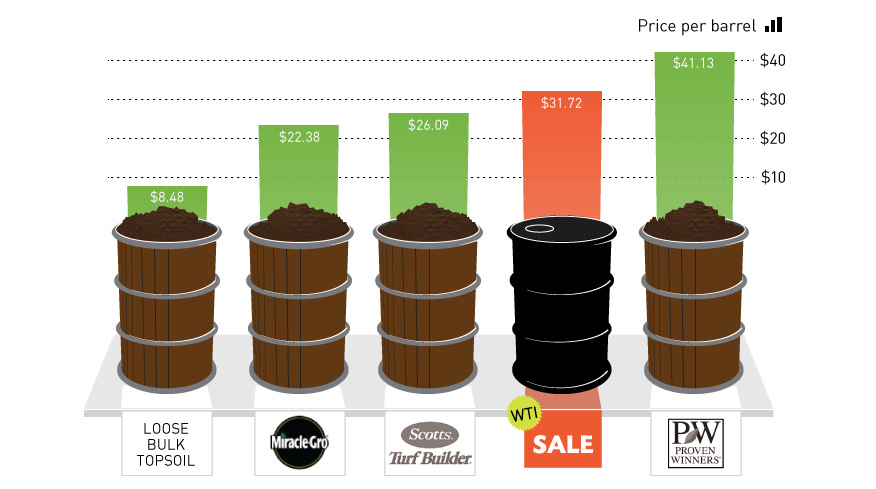
It costs the same amount as a barrel of Scotts Turf Builder.
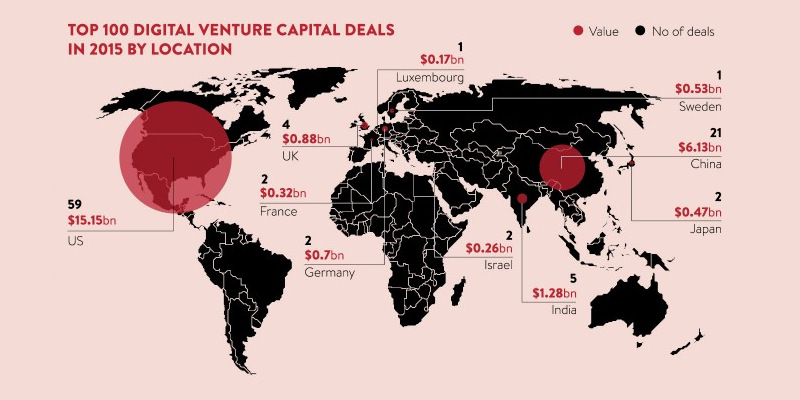
While 2015 was a record-setting year for venture capital, there is a devil in the details.
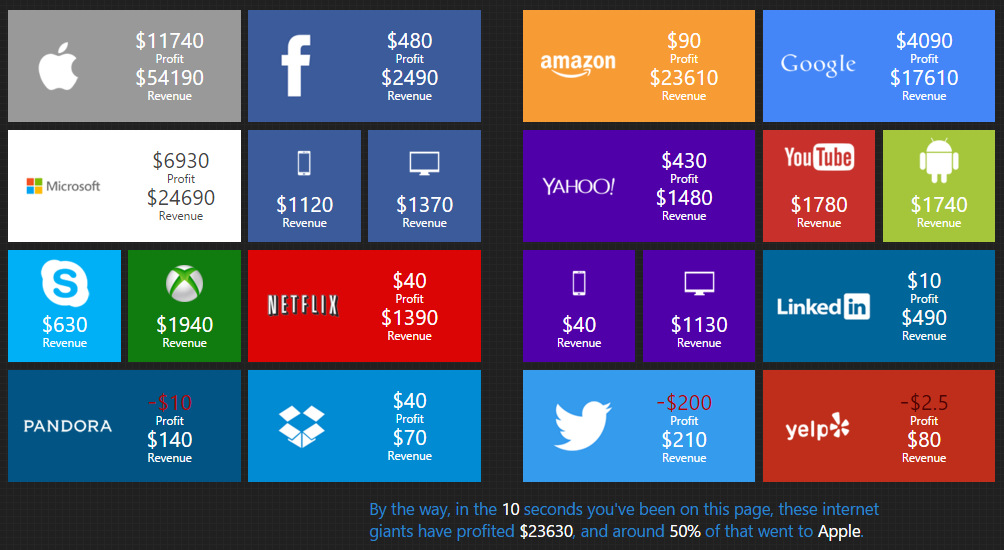
How much money do world's tech giants like Facebook, Google, and Amazon make every 10 seconds?
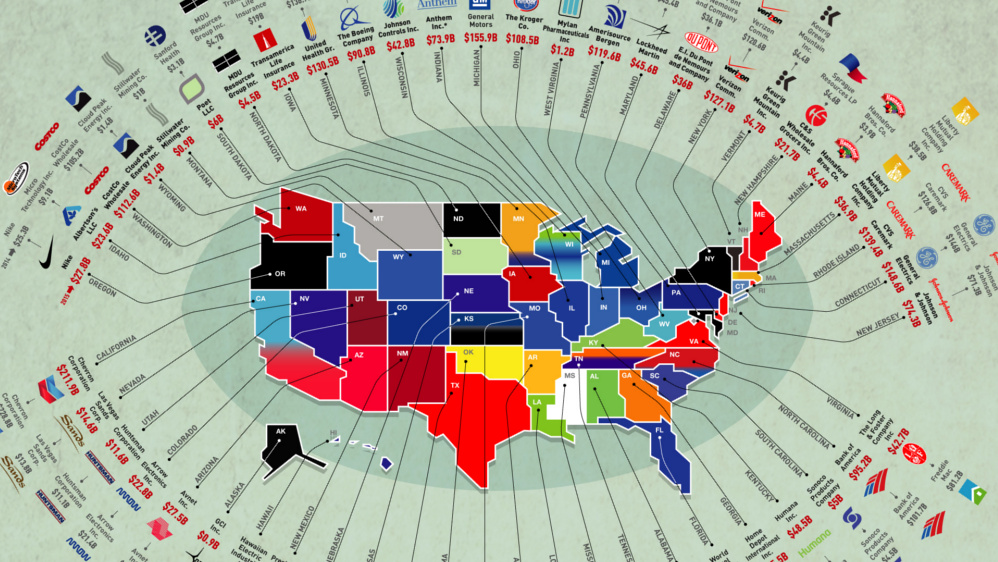
The biggest businesses in the U.S. range from oil producers to retail giants. Here's a list showing the largest company in each state by revenue.
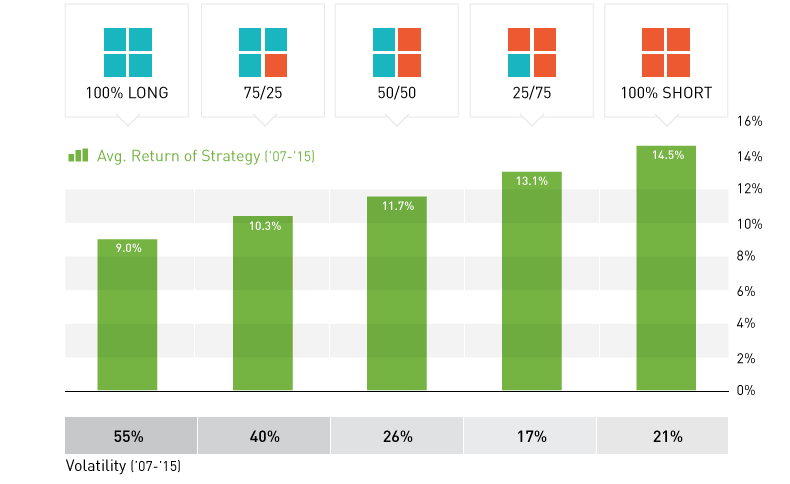
To short or not to short commodities? We take a look at the hypothetical success of a Dogs of the Dow inspired strategy to go long/short...
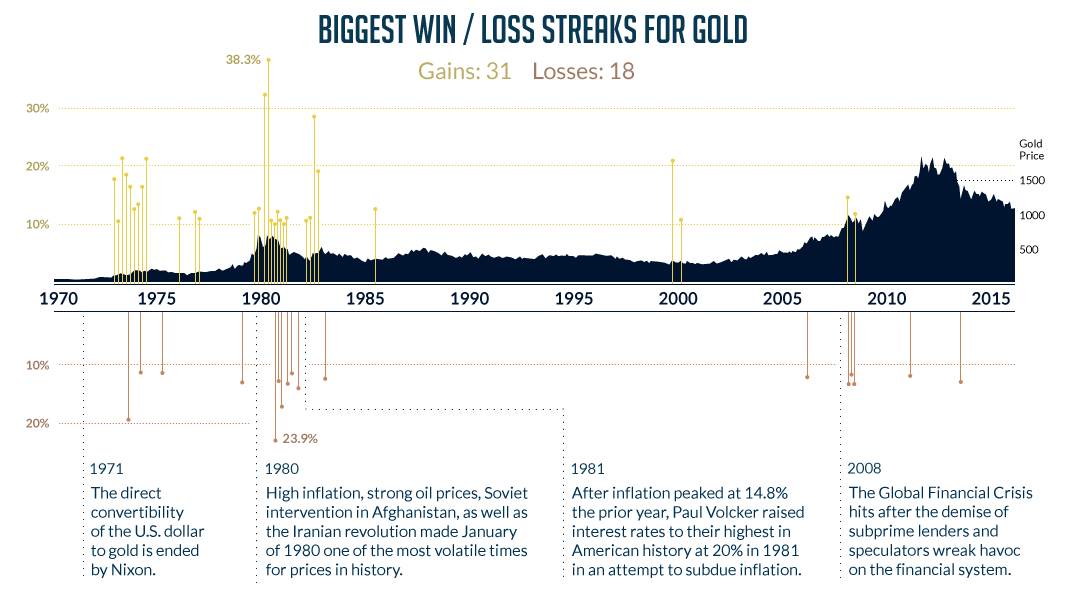
Gold is up 5% so far in 2016, but historically this barely even scratches the surface. Here's gold's biggest streaks since it became freely traded in...
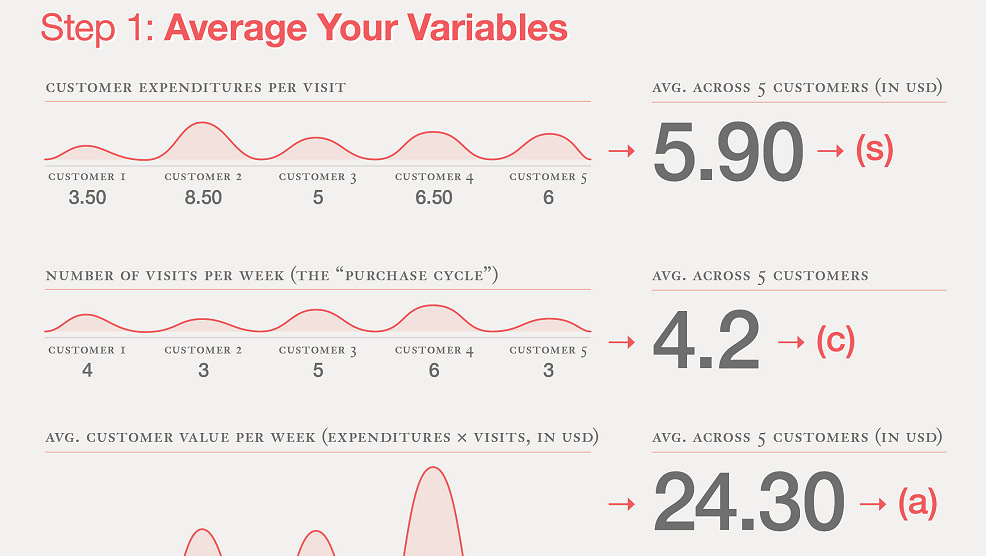
How much is one new customer worth to a business? This infographic shows how to calculate lifetime value of a customer.

We look at 3 major themes that may suggest it is worth owning gold in 2016, ranging from the end of two-term US presidential terms to...
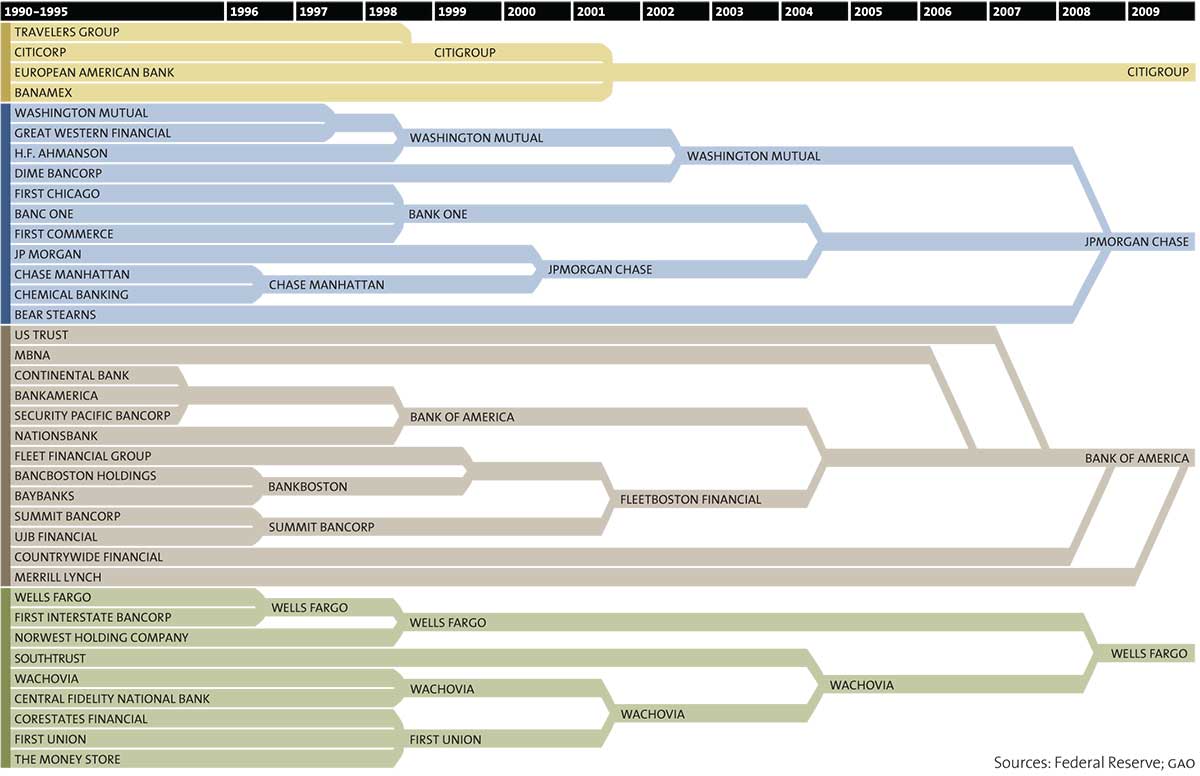
The Big Four retail banks in the United States hold 45%, or $4.6 trillion, of all customer bank deposits. This chart shows consolidation in banking.
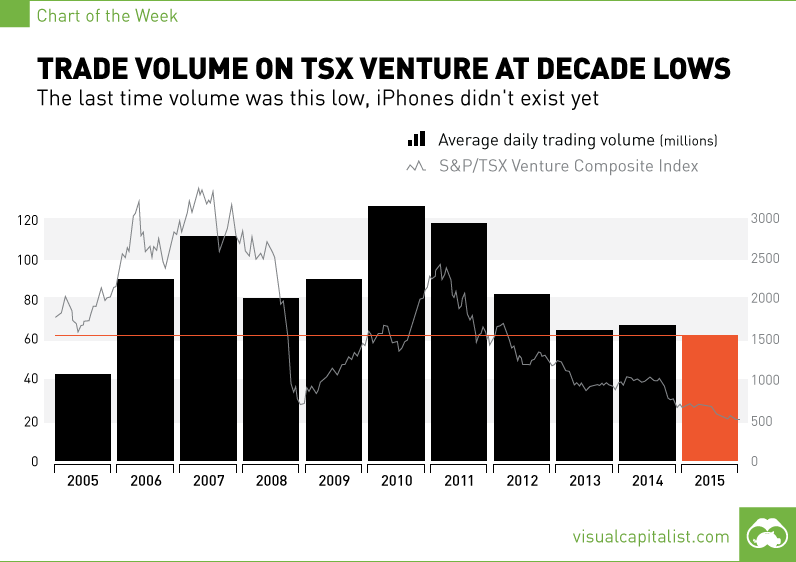
The last time volume was this low, the iPhone did not exist yet.


