
This graphic visualizes the most valuable brands by country in 12 major economies, from tech and energy giants to automakers...


click for more →


Scan with your phone's camera or QR code app to view

Over 700 million iPhones have now been sold, but the iPhone would not exist if it were not for the raw materials that make the technology...

The Model S has been lauded for its safety, range, and design. Equally impressive, however, are the raw materials that go into a Tesla Model S.
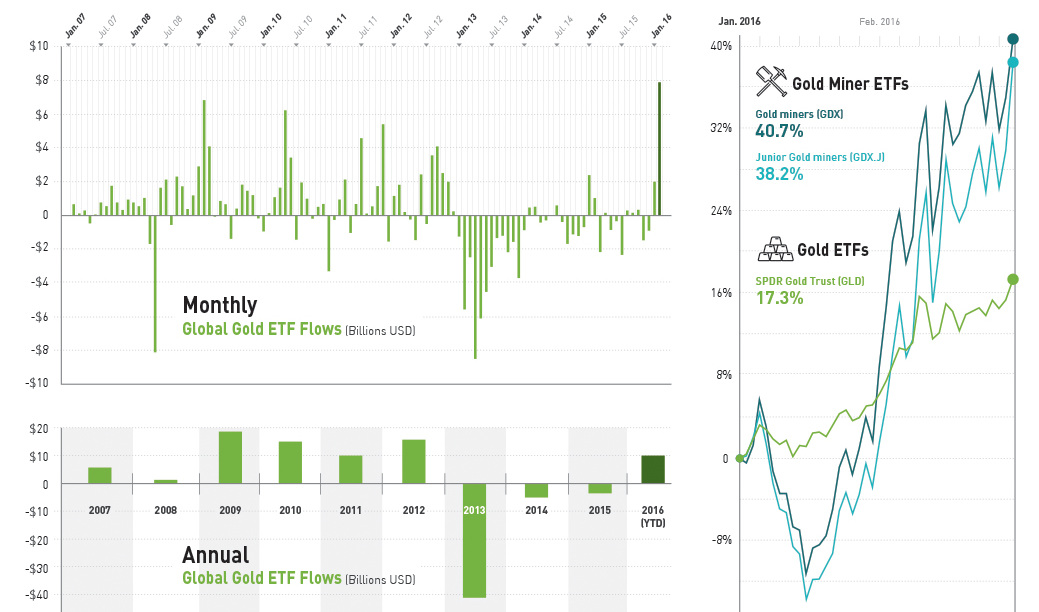
Investors bought gold ETFs at a record pace, with inflows of $7.9 billion - the highest in 8 years - in the month of February.
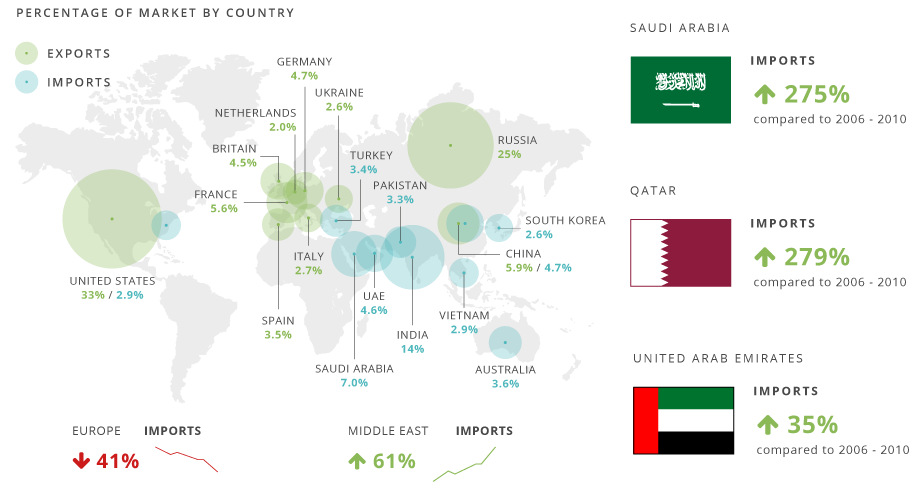
The global arms trade is huge. Estimated to be at least $76 billion in 2013, here's who is trading arms to who.
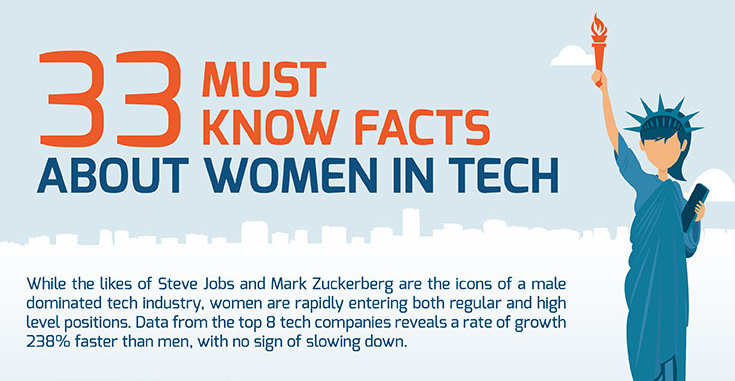
The most successful women in Silicon Valley, as well as dozens of other facts about women in technology, startups, and venture capital.

The U.S. has run a trade deficit for 40 years now. Where does that net foreign spending go? This map visualizes the data from 2015.
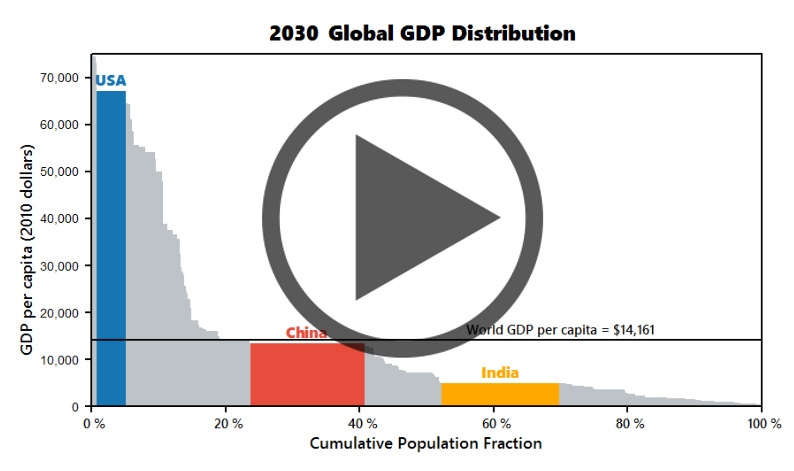
Watch the economies of the United States, China, and India evolve before your eyes from 1970 until 2030 (projected).
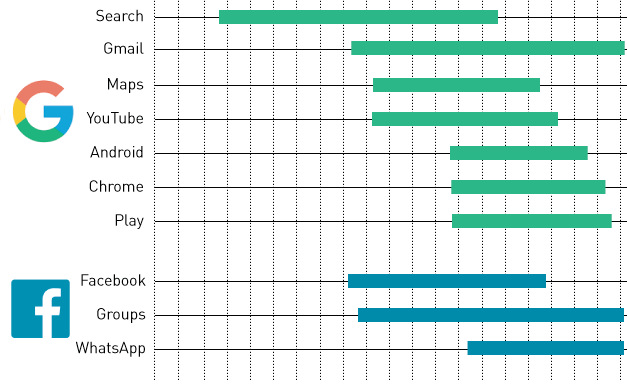
Only 12 apps have ever reached the coveted 1 billion active user mark. This timeline visualization shows how long it took each one to get there.

The first Oscar was given out at the 1929 Academy Awards, but the statuette has undergone changes in construction ever since. Here's how an Oscar is...
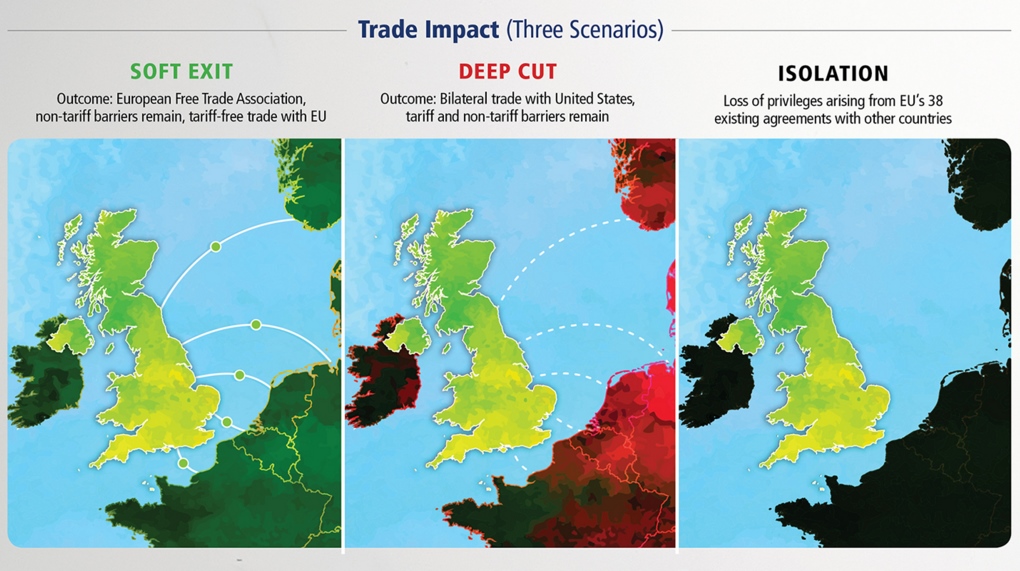
A potential British exit from the European Union, or Brexit, could have big ramifications for investors. Here's the view from one think tank why a Brexit...
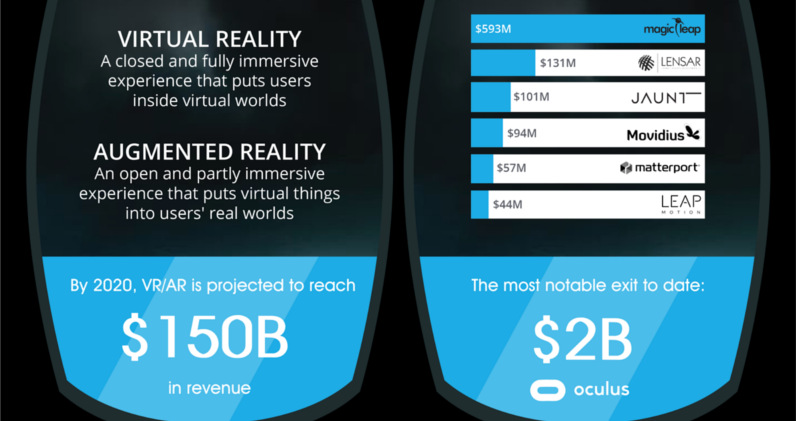
Virtual and augmented reality have come into focus as some of the most exciting technologies. Here's the major players in the space and what to expect...
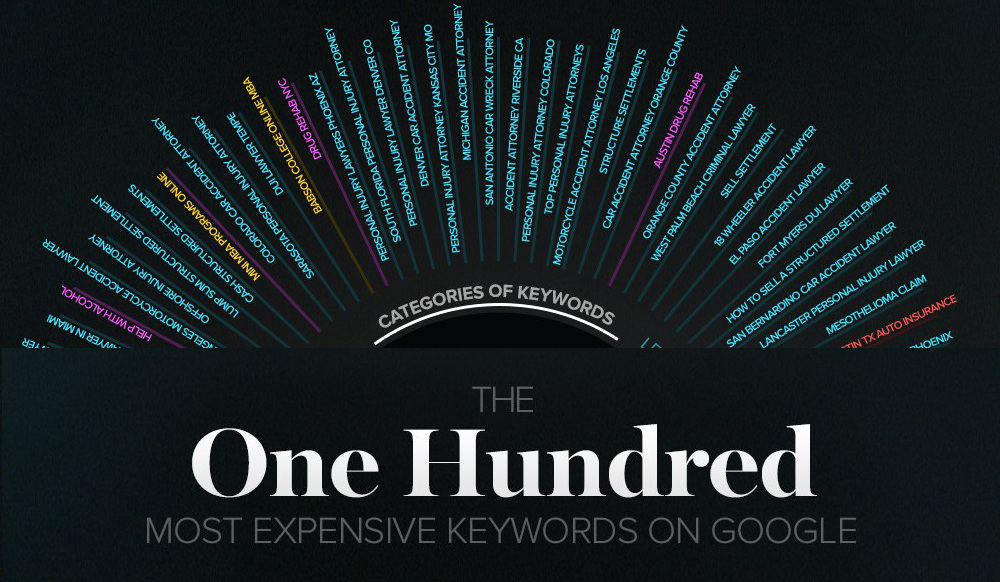
Ever wonder what lawyers use all of their legal fees for? Apparently it is to cover cost-per-click advertising on Google. Today's infographic looks at the most...

How currency debasement, soaring costs, and overtaxing helped lead to the collapse of Ancient Rome's economy and empire.
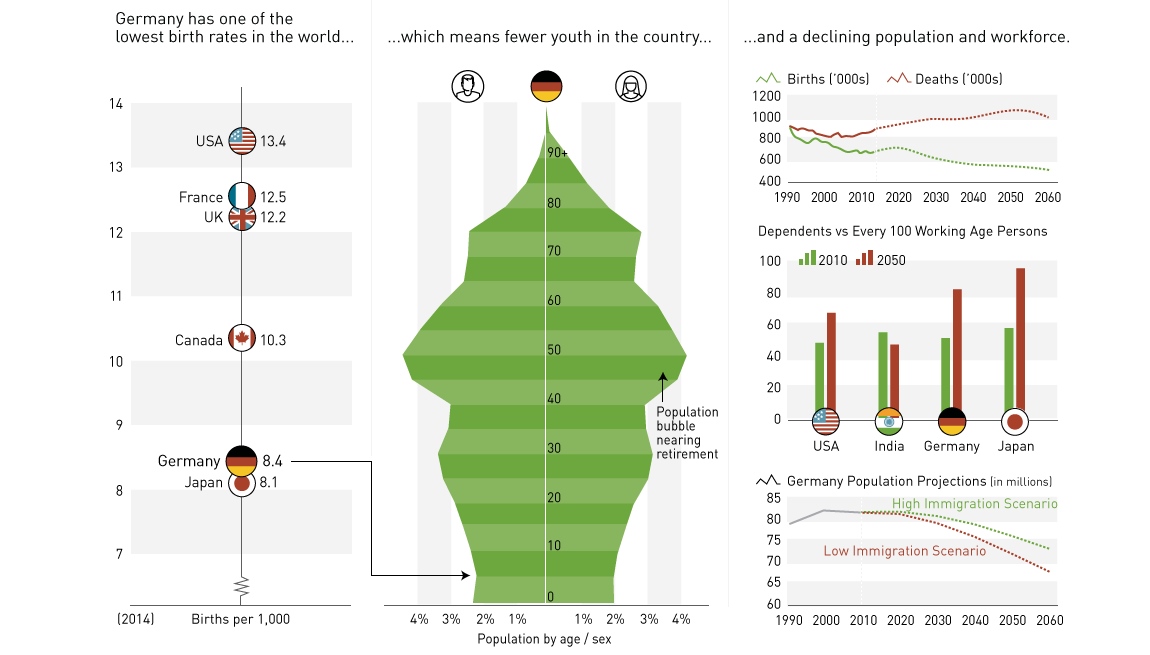
Germany's demographic cliff, and why Europe's largest economy could be destined to be the next Japan.
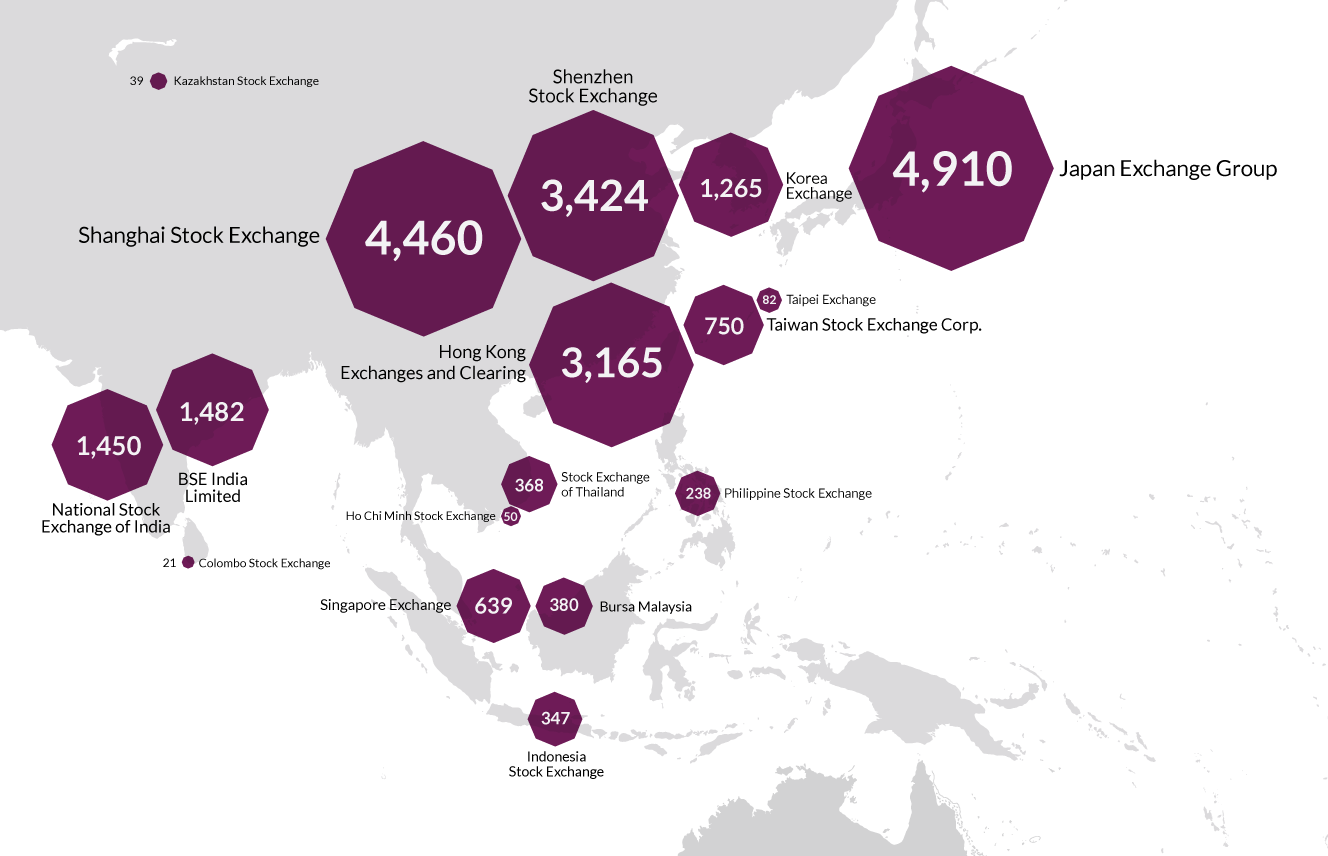
There's 60 major stock exchanges in the world, ranging from the mighty NYSE to the tiny Bermuda stock market. Here they all are visualized by size...
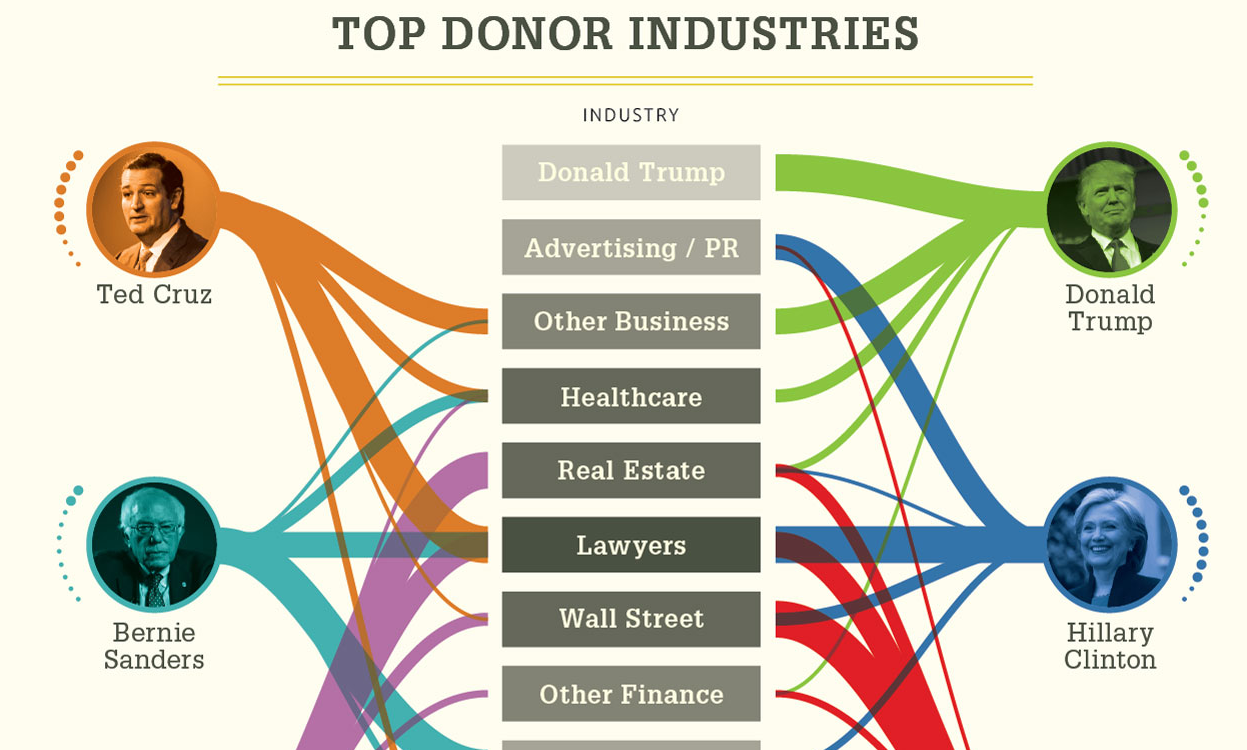
What if politicians displayed their donors on their uniforms like NASCAR drivers?
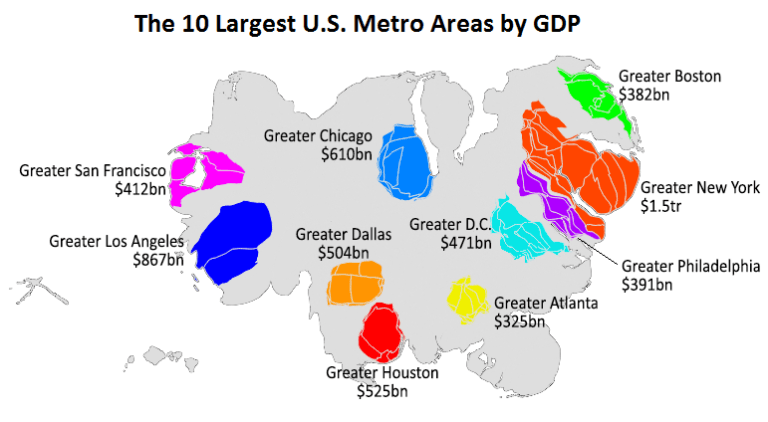
This animation uses county-level GDP data to re-size a U.S. map based on the economic contributions at a local level.


