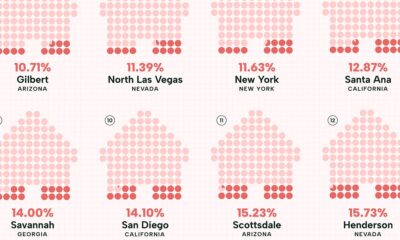
Visualizing the least affordable U.S. cities for renters by the percentage of affordable rentals available on an average salary.


click for more →


Scan with your phone's camera or QR code app to view
Despite only being around for thousands of years, human technological progress has been pretty incredible. See the history of technology in this infographic.
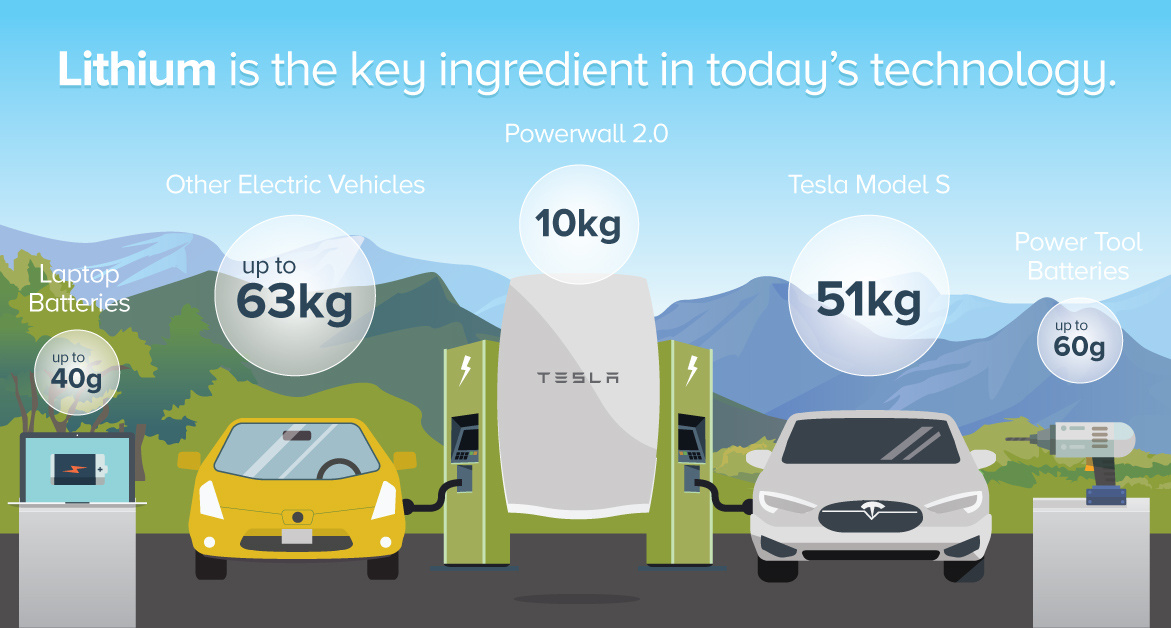
How is lithium-ion powered battery technology fueling the green revolution? See how much of the metal is in various everyday devices in this infographic.
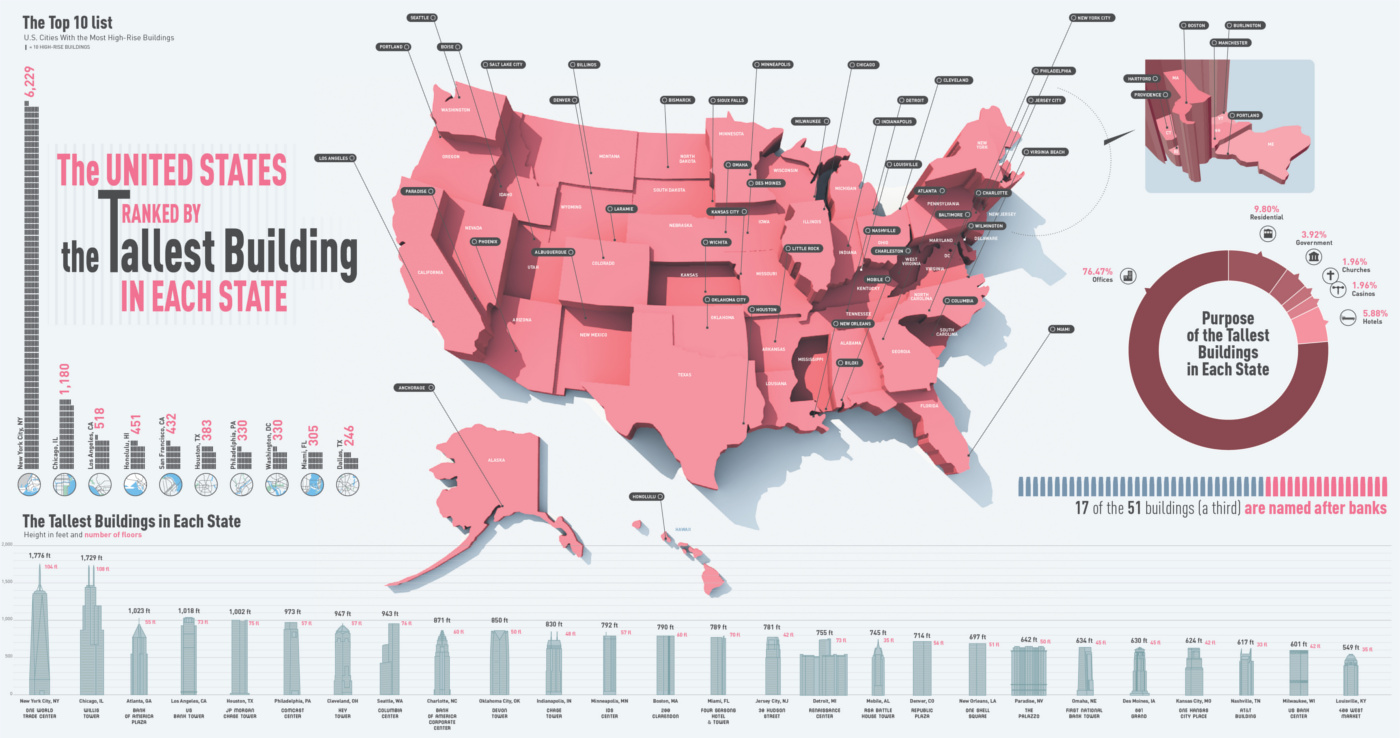
This infographic shows the tallest building in each state, ranging from the 1,776 ft tall One World Trade Center in NYC to the 124 ft Decker...
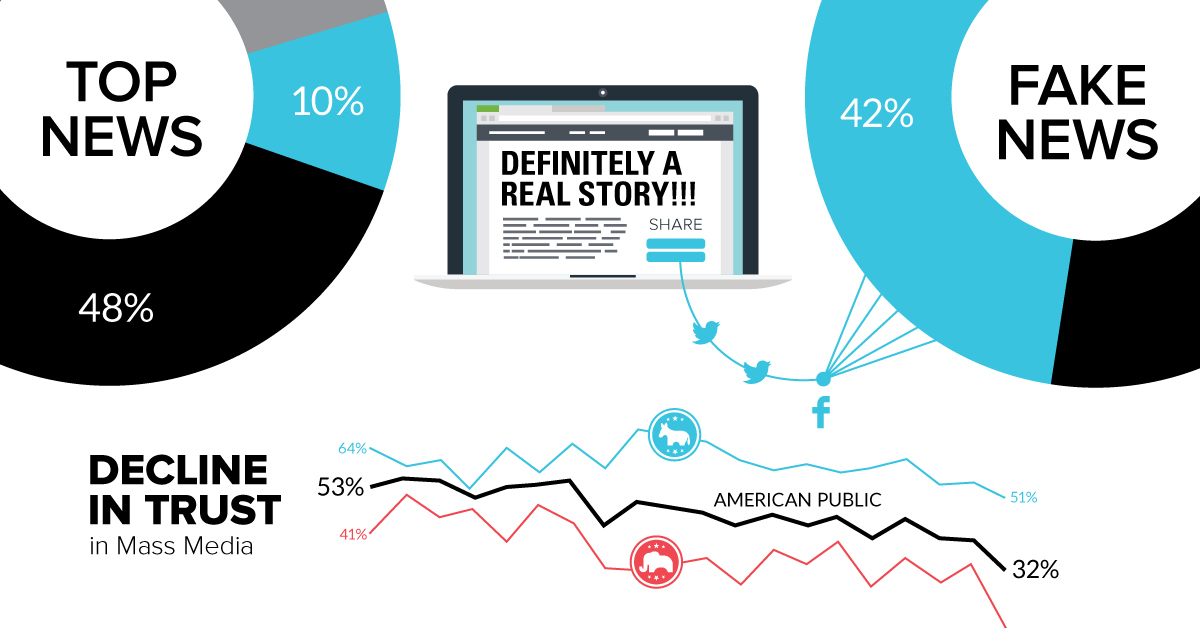
Social media isn't solely to blame for so-called fake news. The rapid decline in the trust of mass media and other institutions are factors as well.
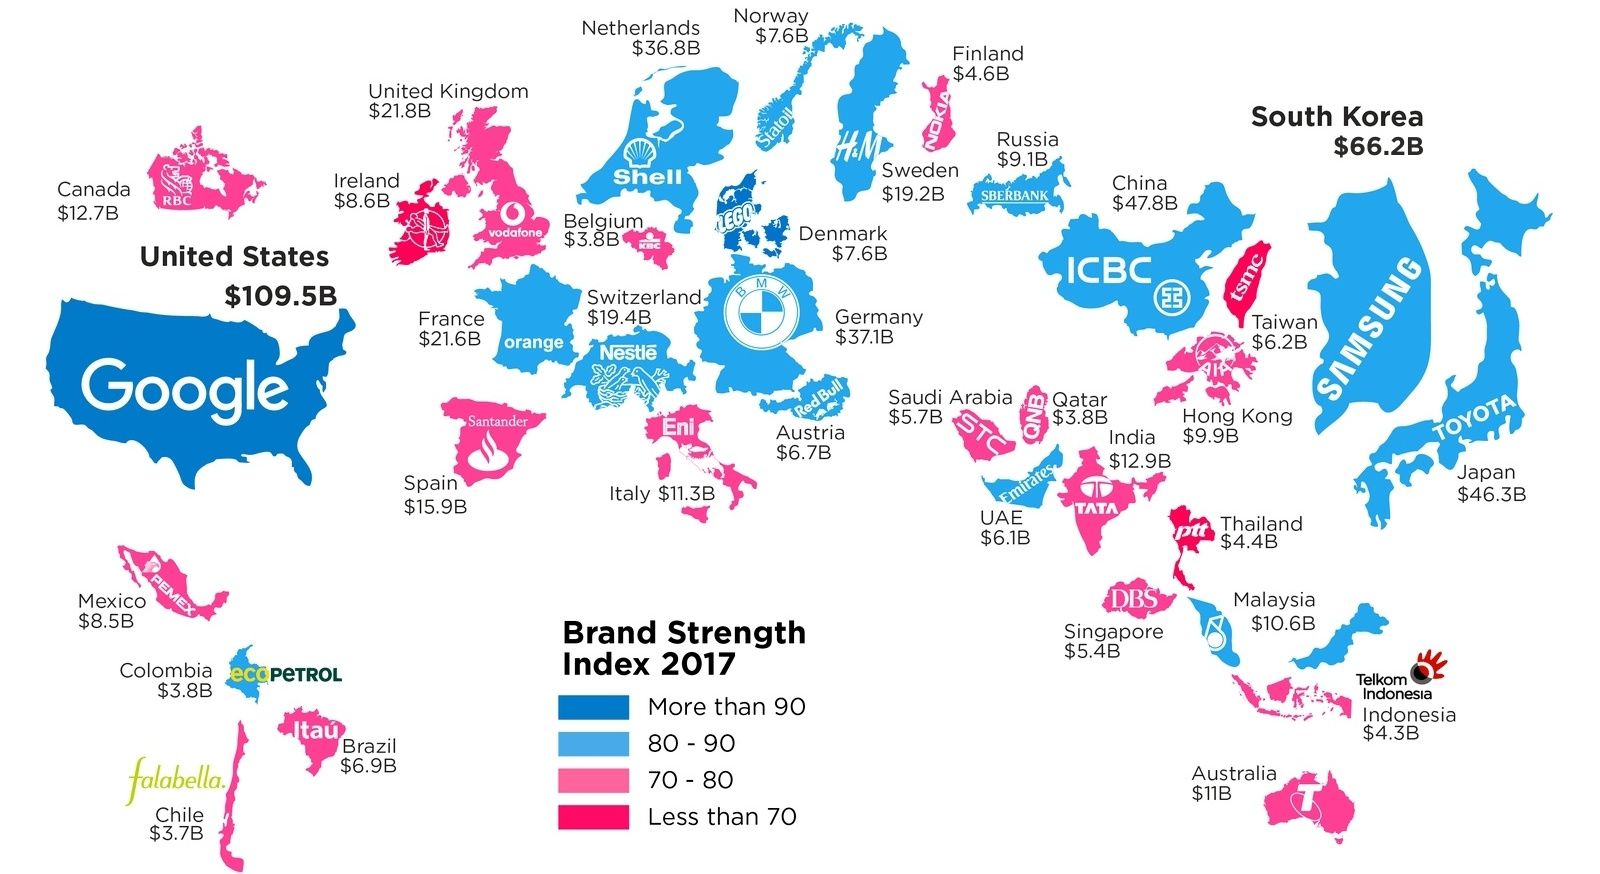
What is a top brand worth? This infographic highlights the most valuable brand in each country, according to the 2017 Brand Finance report.
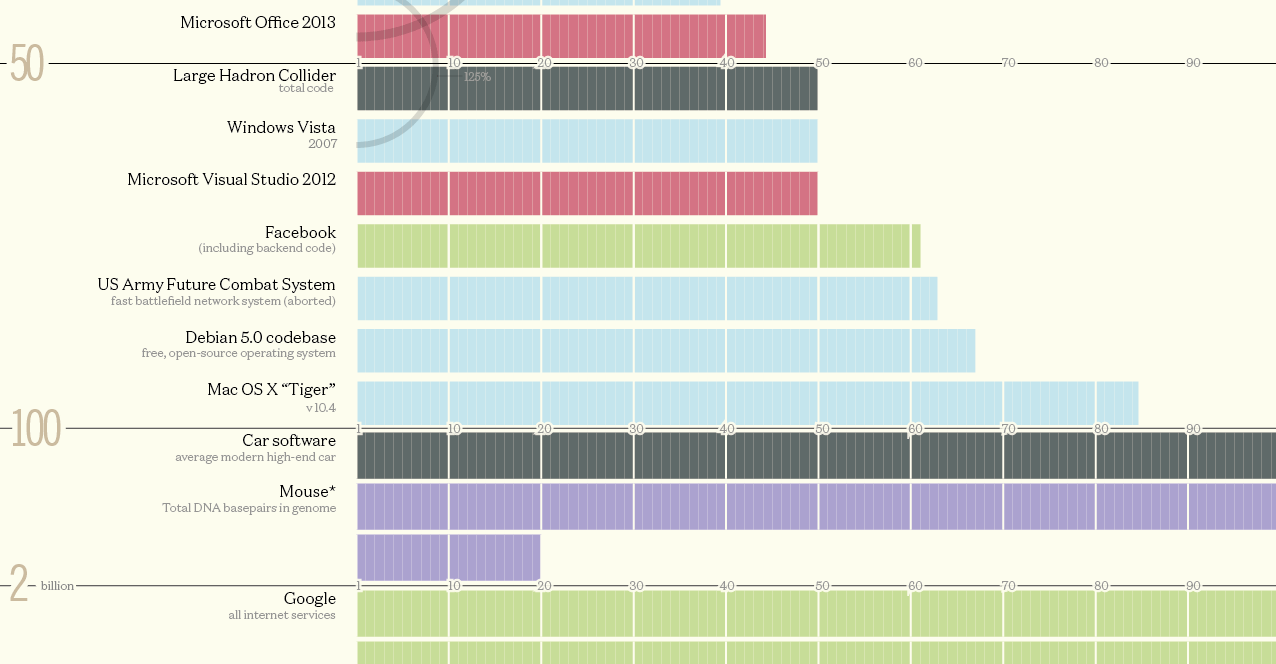
How many lines of code does it take to run a fighter jet, the Large Hadron Collider, a web browser, or Facebook? See the amounts compared...
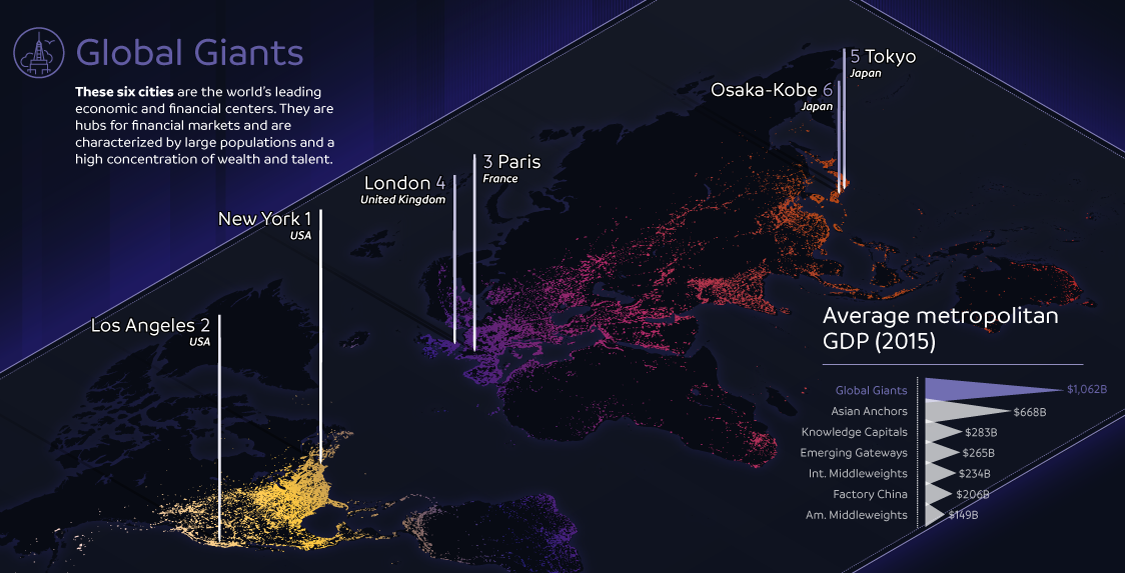
The world's largest 123 cities generate an astonishing $36 trillion in GDP per year. This infographic breaks these global cities down into seven typologies.
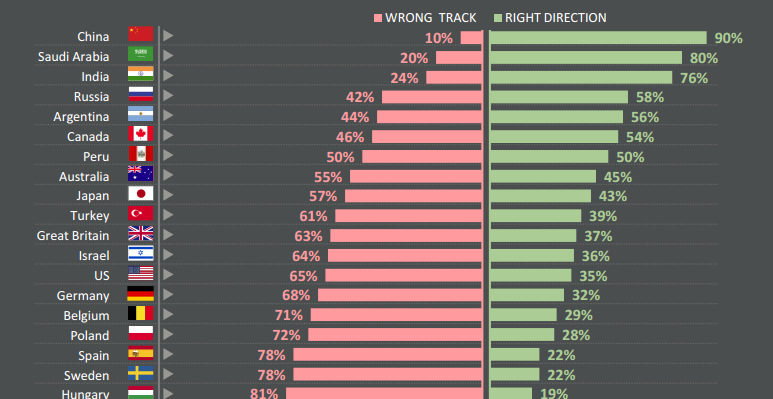
Do citizens think that their countries are heading in the right direction - or are they going down the wrong path? See survey results for 25...
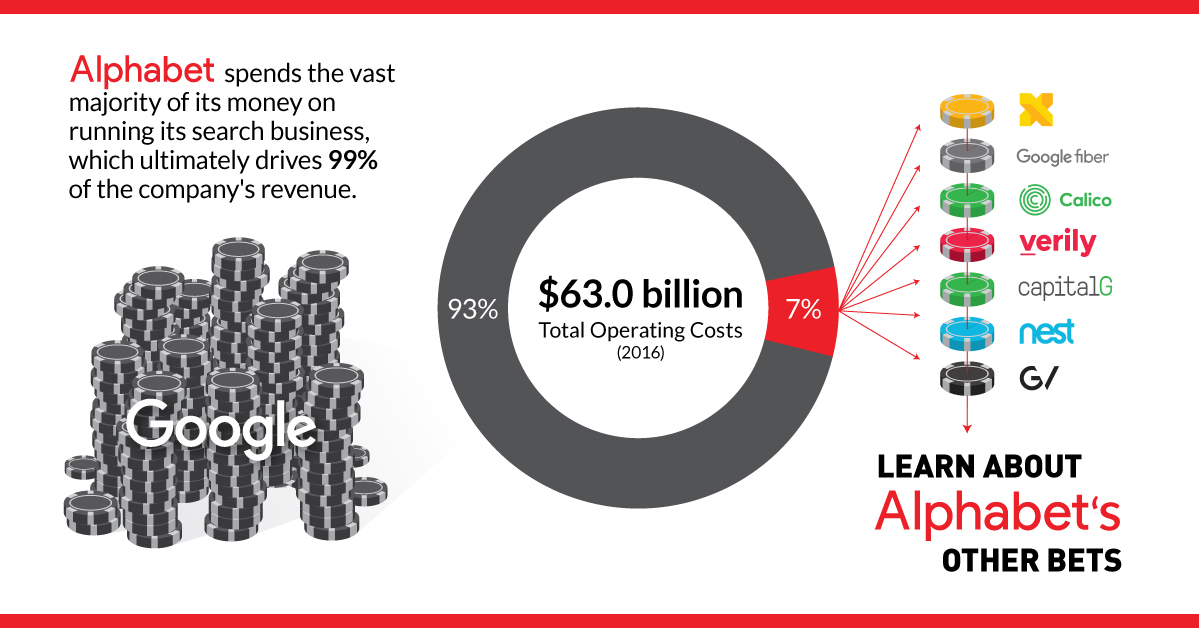
Google's parent company Alphabet spent $4.4 billion in 2016 on 'other bets' - see the new ideas the company is betting on, and if they are...
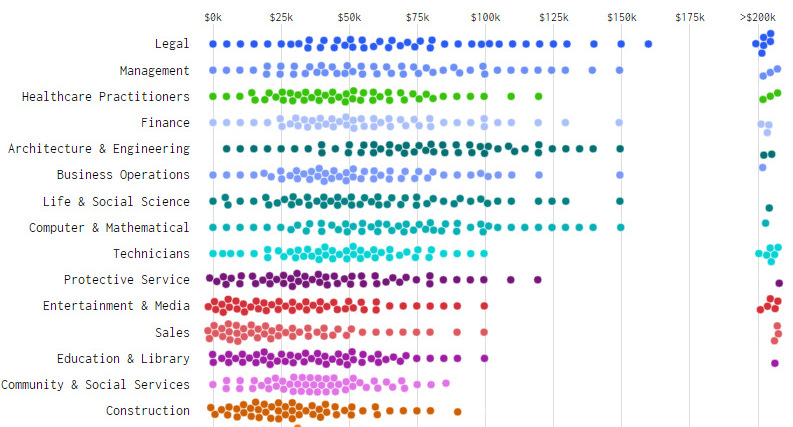
What does income distribution look like for different types of jobs - and how's it changed over time? These charts show the drastic change from 1960...
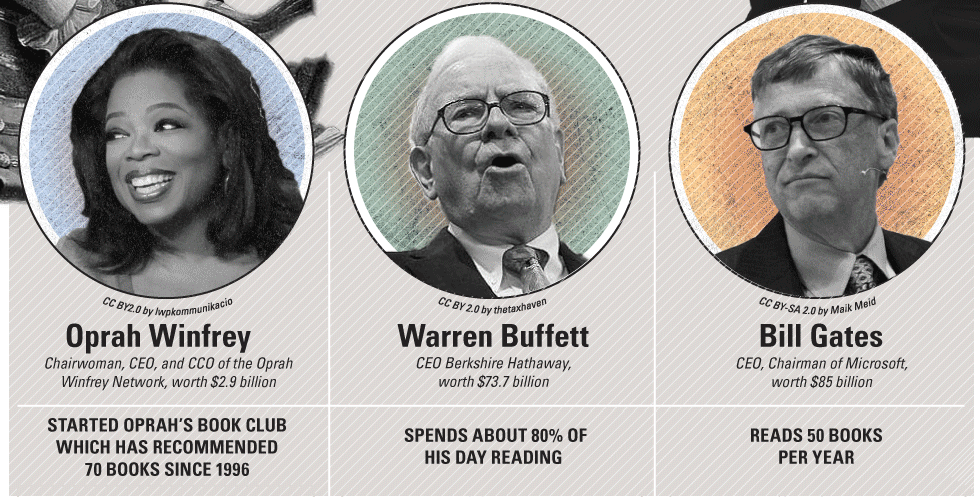
Timeless advice from highly successful entrepreneurs on how to build a business and personal habits that will lead to making a big impact.
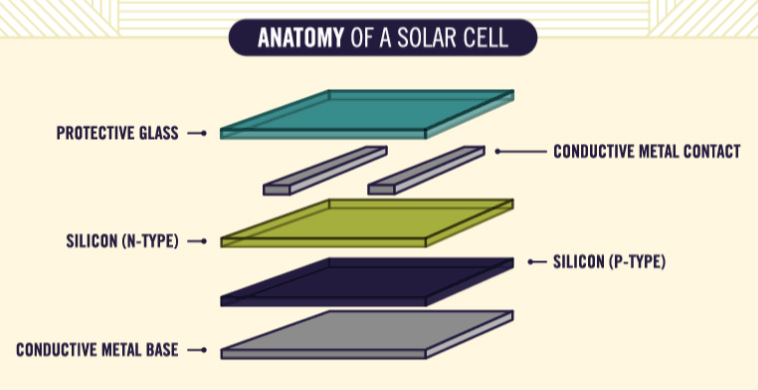
Ever wonder how solar panels work to generate electricity? This animated infographic explains the science behind it, making it easy to understand for anyone.
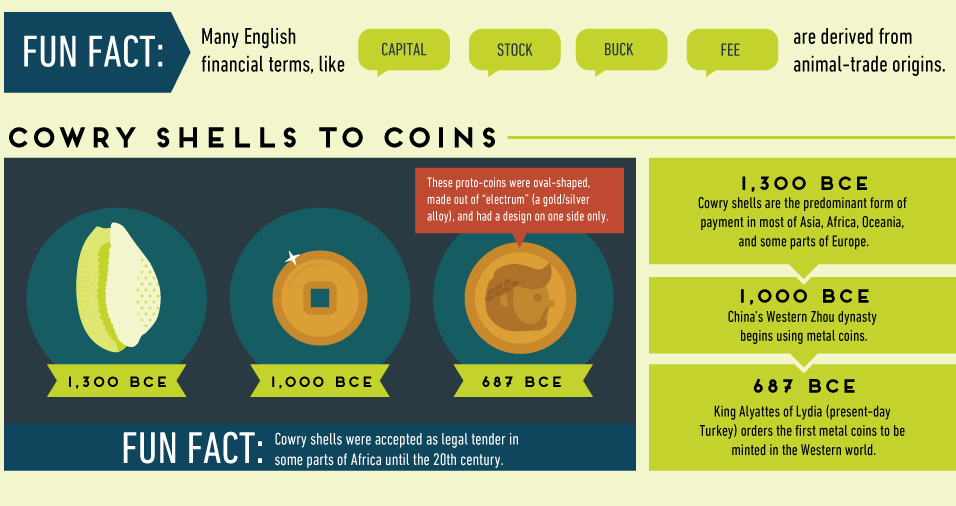
The history of money is filled with trial and error. Some experiments, such as precious metals, stood the test of time - while others have crashed...
A global push by lawmakers to eliminate the use of physical cash is accelerating. See who's getting targeted in the War on Cash, and who's in...
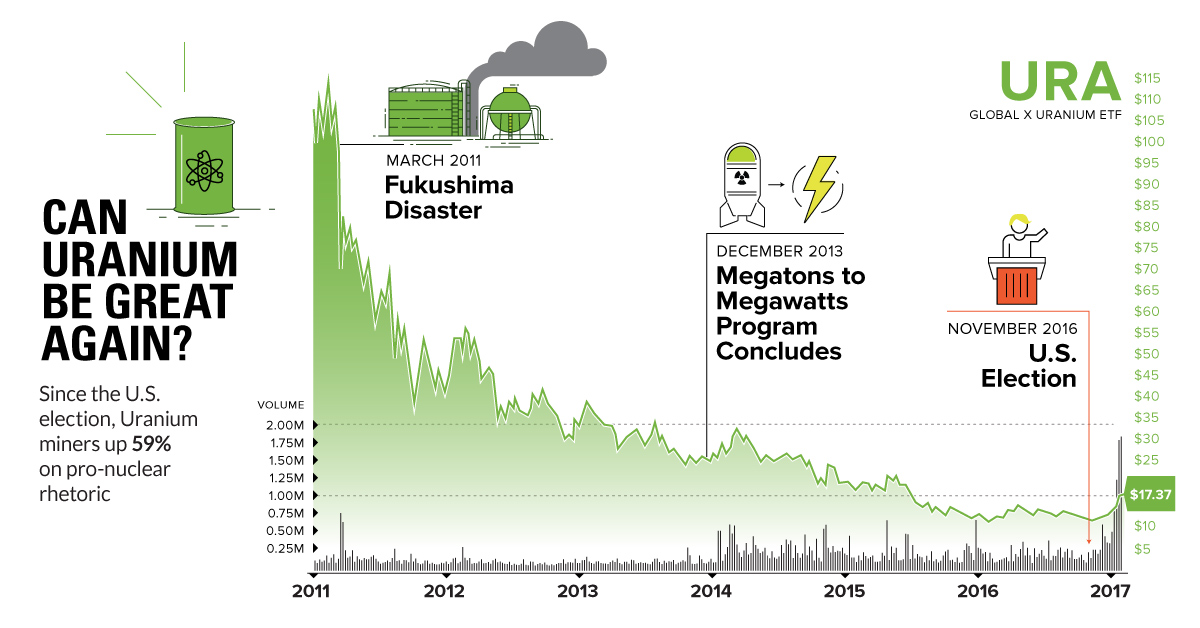
Uranium was the most hated commodity for the last 6 years - but things are changing. Trump could be a boon to the metal, with miners...
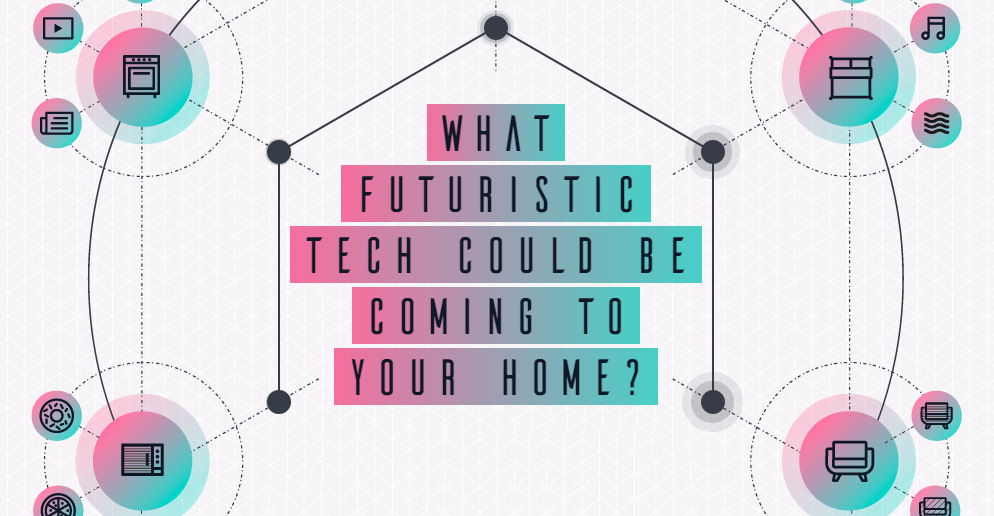
Take a journey into the future in this interactive infographic to see what kind of bizarre technologies your next home may have to offer.
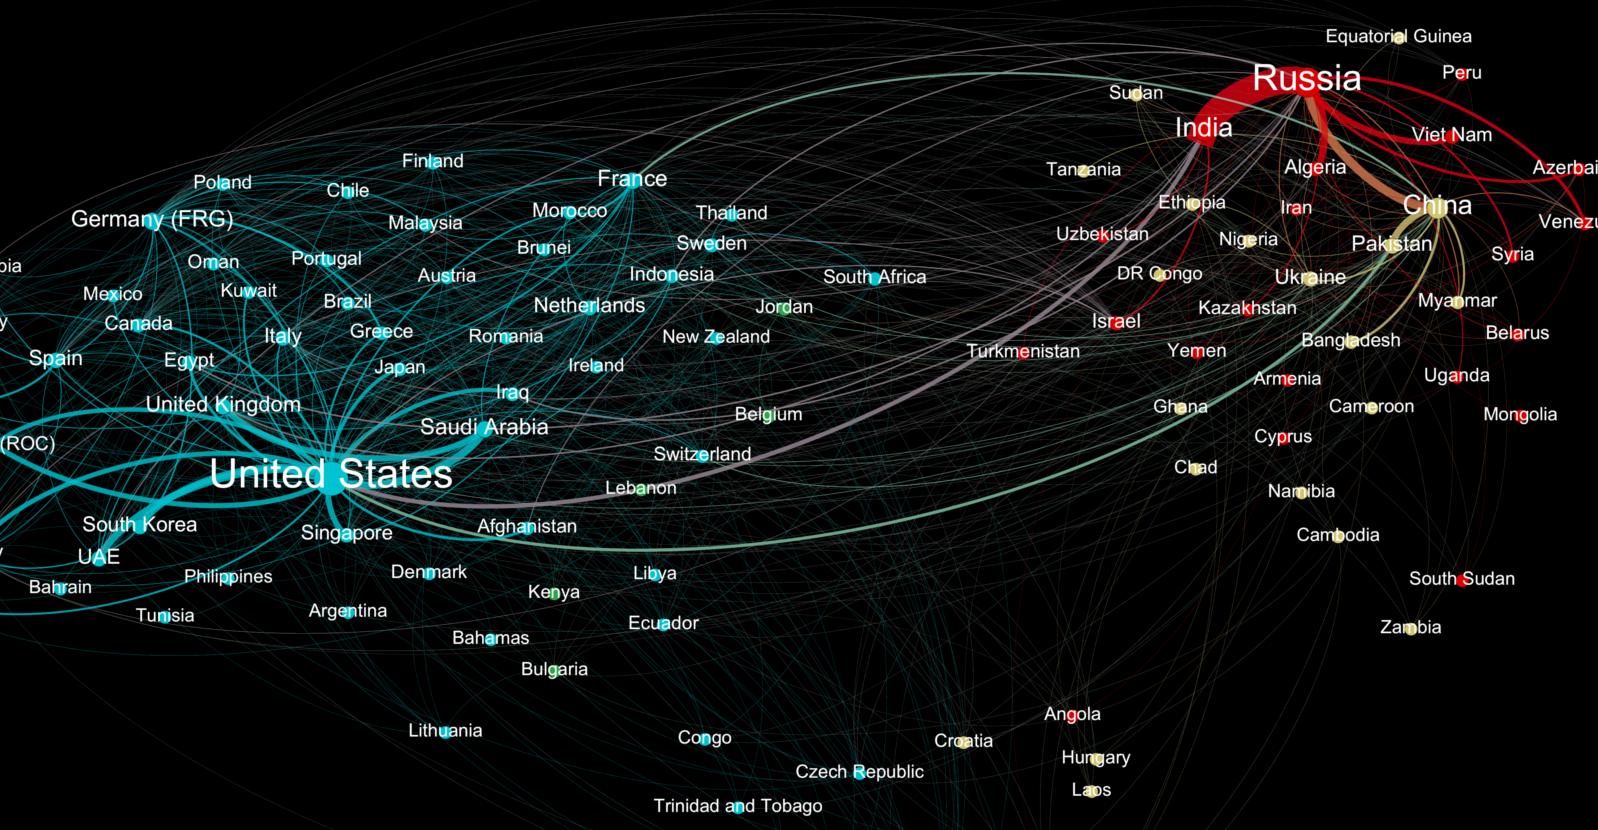
Who sends weapons to who? This data visualization represents the global weapons trade between countries, and it shines a light on two major blocs of trade.


 Creator Program