Technology
Order From Chaos: How Big Data Will Change the World

Order From Chaos: How Big Data Will Change the World
Harnessing the exponential surge in data creates big opportunities.
Thanks to Purefunds Big Data ETF (BDAT) for helping us put this together.
IBM estimates that each day, 2.5 quintillion bytes of data are created or replicated. That’s the equivalent of a million hard drives filling up with data every hour.
The current volume of data created is substantial: it is so much that 90% of the world’s data has been created in the last two years. However, the amount of information today pales in comparison to what our future holds, as the rate at which data is created is accelerating exponentially.
It’s for this reason that The Economist estimates that there will be roughly 7x more data in 2020 than there was in 2014.
Where Does Big Data Come From?
Big data comes from both internal and external sources. Internally, millions of old documents and records are scanned and archived by businesses. Most of the time, no detailed analytics have ever been run on this information. Externally, the public web offers millions of data sets published for public consumption by government, economic, census, and other sources.
There’s also a broad spectrum of data that exists that can be a part of both of these categories: social media posts, documents, emails, business applications, machine log data, media, and sensor data can all be collected, processed, and analyzed. To get a sense of the extent of this information, here’s what is created every hour just from social media and email: 72 hours of video uploaded to Youtube, 4 million search inquiries on Google, 200 million emails sent, 2.5 million shares on Facebook, and 300,000 tweets made.
Big Data = Big Opportunities for Business
With proper analysis, Big Data can lead to new understandings of consumer behaviour, better management decisions, new innovations, and improved risk management. However, there are big challenges in making use of so much information.
- Too much data creates an information overload.
- Organizing and storing all of this data can be problematic.
- Companies don’t know how to use all of this data to create insight.
To organize and make sense of it all, data scientists use the three V’s to describe Big Data.
Volume is the scale at which data is created, and includes the massive amounts of information derived from phones, internet users, machine logs, and internet of things.
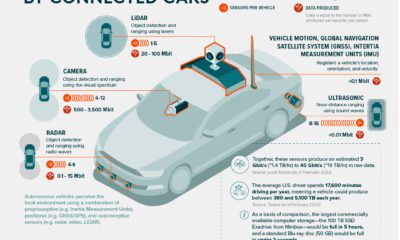
Velocity is the analysis of streaming data: for example, modern cars have 100 sensors that monitor different systems in real-time.
Variety is the different forms of data, and it reflects the fact that data comes in all shapes and forms. Finding a way to harmonize multiple types of data can be quite a challenge. Research finds that organizations spend up to 80% of their time modelling and preparing data, rather than actually gaining insight.
Let’s see how companies have been able to use Big Data to create opportunity.
Case Studies of Big Data
Macy’s adjusts pricing in near-real time for 73 million items based on demand and inventory.
American Express developed predictive models that analyze historical transactions and 115 variables to forecast the loyalty of customers. Using this data, they can see if customers may be potentially closing their accounts in the near future. Launching a pilot program in Australia, the company can now identify 24% of accounts in the country that will close in the next four months.
Walmart built a new search engine for their website that includes semantic data relying on text analysis, machine learning, and even synonym mining to create better search results. Online shoppers have been more likely to complete purchases as a result by 10% to 15%, increasing revenue by billions.
Los Angeles and Santa Cruz police departments have used an algorithm that is typically used to predict earthquakes, now using it to look at crime data. The software can predict where crimes are likely to occur down to 500 square feet. In areas the software is being used, there has been a 33% reduction in burglaries and a 21% reduction in violent crimes.
Big Market
Today’s data centers occupy the land to equivalent to almost 6,000 football fields. By 2020, the amount of digital information is expected to increase exponentially to more than 7x of what it is today.
In healthcare alone, Big Data is expected to eventually save $300 billion per year in healthcare analytics. Retailers may increase margins up to 60% through Big Data analytics.
“Information is the oil of the 21st century, and analytics is the combusion engine.” – Peter Sondergaard, Gartner Research.


Technology
Ranked: Semiconductor Companies by Industry Revenue Share
Nvidia is coming for Intel’s crown. Samsung is losing ground. AI is transforming the space. We break down revenue for semiconductor companies.


Semiconductor Companies by Industry Revenue Share
This was originally posted on our Voronoi app. Download the app for free on Apple or Android and discover incredible data-driven charts from a variety of trusted sources.
Did you know that some computer chips are now retailing for the price of a new BMW?
As computers invade nearly every sphere of life, so too have the chips that power them, raising the revenues of the businesses dedicated to designing them.
But how did various chipmakers measure against each other last year?
We rank the biggest semiconductor companies by their percentage share of the industry’s revenues in 2023, using data from Omdia research.
Which Chip Company Made the Most Money in 2023?
Market leader and industry-defining veteran Intel still holds the crown for the most revenue in the sector, crossing $50 billion in 2023, or 10% of the broader industry’s topline.
All is not well at Intel, however, with the company’s stock price down over 20% year-to-date after it revealed billion-dollar losses in its foundry business.
| Rank | Company | 2023 Revenue | % of Industry Revenue |
|---|---|---|---|
| 1 | Intel | $51B | 9.4% |
| 2 | NVIDIA | $49B | 9.0% |
| 3 | Samsung Electronics | $44B | 8.1% |
| 4 | Qualcomm | $31B | 5.7% |
| 5 | Broadcom | $28B | 5.2% |
| 6 | SK Hynix | $24B | 4.4% |
| 7 | AMD | $22B | 4.1% |
| 8 | Apple | $19B | 3.4% |
| 9 | Infineon Tech | $17B | 3.2% |
| 10 | STMicroelectronics | $17B | 3.2% |
| 11 | Texas Instruments | $17B | 3.1% |
| 12 | Micron Technology | $16B | 2.9% |
| 13 | MediaTek | $14B | 2.6% |
| 14 | NXP | $13B | 2.4% |
| 15 | Analog Devices | $12B | 2.2% |
| 16 | Renesas Electronics Corporation | $11B | 1.9% |
| 17 | Sony Semiconductor Solutions Corporation | $10B | 1.9% |
| 18 | Microchip Technology | $8B | 1.5% |
| 19 | Onsemi | $8B | 1.4% |
| 20 | KIOXIA Corporation | $7B | 1.3% |
| N/A | Others | $126B | 23.2% |
| N/A | Total | $545B | 100% |
Note: Figures are rounded. Totals and percentages may not sum to 100.
Meanwhile, Nvidia is very close to overtaking Intel, after declaring $49 billion of topline revenue for 2023. This is more than double its 2022 revenue ($21 billion), increasing its share of industry revenues to 9%.
Nvidia’s meteoric rise has gotten a huge thumbs-up from investors. It became a trillion dollar stock last year, and broke the single-day gain record for market capitalization this year.
Other chipmakers haven’t been as successful. Out of the top 20 semiconductor companies by revenue, 12 did not match their 2022 revenues, including big names like Intel, Samsung, and AMD.
The Many Different Types of Chipmakers
All of these companies may belong to the same industry, but they don’t focus on the same niche.
According to Investopedia, there are four major types of chips, depending on their functionality: microprocessors, memory chips, standard chips, and complex systems on a chip.
Nvidia’s core business was once GPUs for computers (graphics processing units), but in recent years this has drastically shifted towards microprocessors for analytics and AI.
These specialized chips seem to be where the majority of growth is occurring within the sector. For example, companies that are largely in the memory segment—Samsung, SK Hynix, and Micron Technology—saw peak revenues in the mid-2010s.

-

 Green2 weeks ago
Ranked: Top Countries by Total Forest Loss Since 2001
-

 Travel1 week ago
Ranked: The World’s Top Flight Routes, by Revenue
-

 Technology2 weeks ago
Ranked: Semiconductor Companies by Industry Revenue Share
-

 Money2 weeks ago
Which States Have the Highest Minimum Wage in America?
-

 Real Estate2 weeks ago
Ranked: The Most Valuable Housing Markets in America
-

 Markets2 weeks ago
Charted: Big Four Market Share by S&P 500 Audits
-

 AI2 weeks ago
The Stock Performance of U.S. Chipmakers So Far in 2024
-

 Automotive2 weeks ago
Almost Every EV Stock is Down After Q1 2024