Technology
Visualizing 40 Years of Music Industry Sales
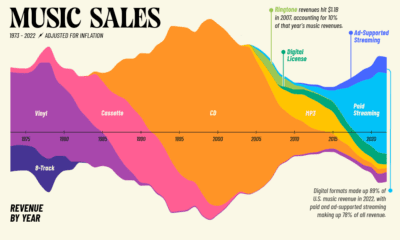
40 Years of Music Industry Sales
The record industry has seen a lot of change over the years.
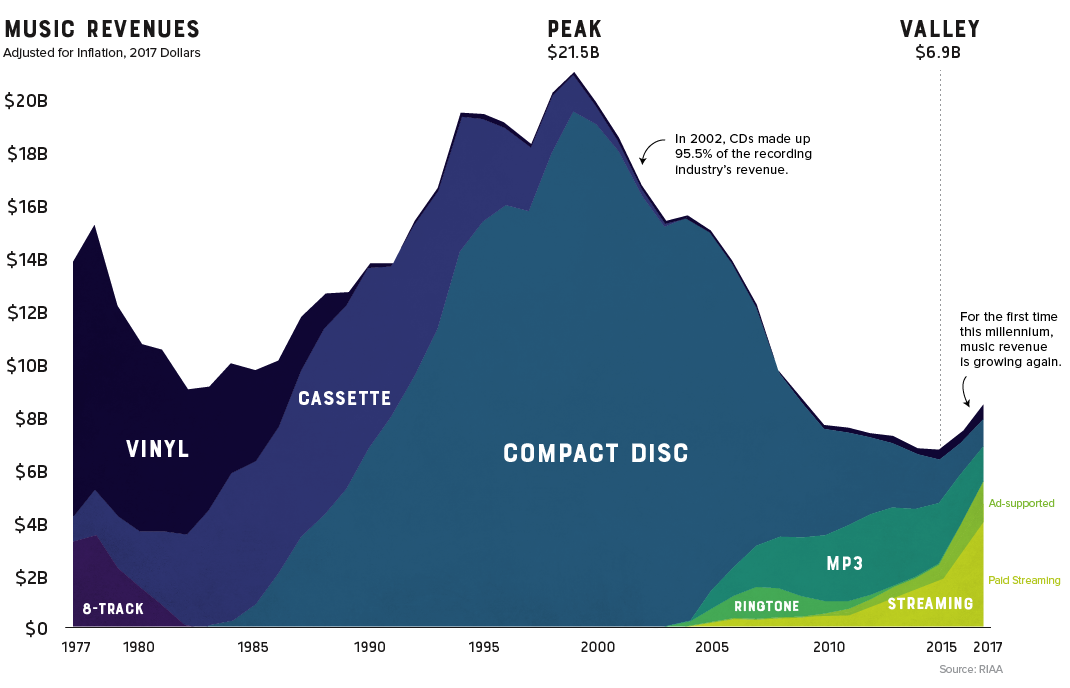
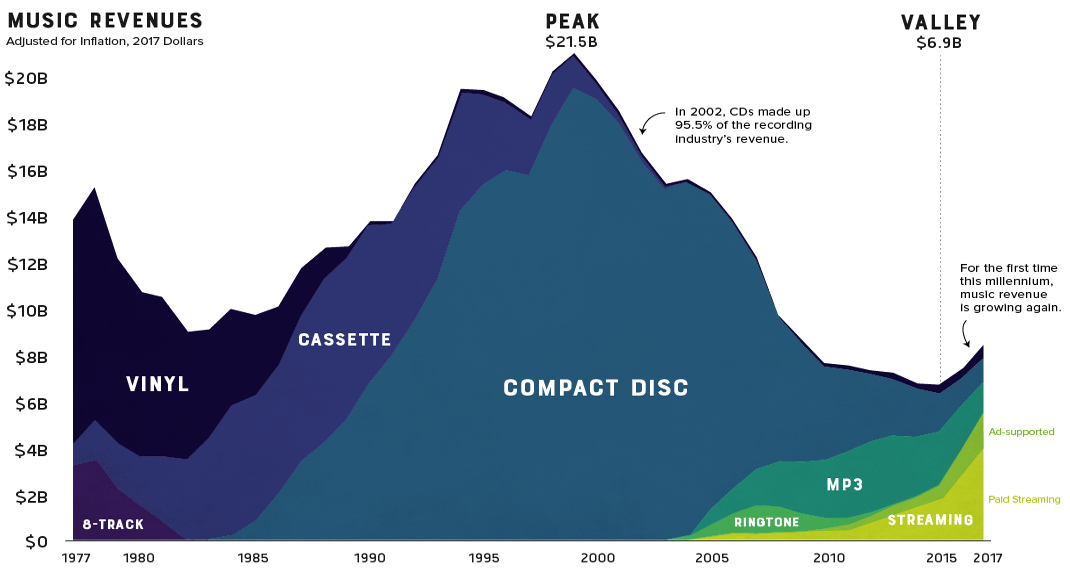
8-tracks took a short-lived run at the dominance of vinyl, cassettes faded away as compact discs took the world by storm, and through it all, the music industry saw its revenue continue to climb. That is, until it was digitally disrupted.
Looking back at four decades of U.S. music industry sales data is a fascinating exercise as it charts not only the rise and fall the record company profits, but seismic shifts in technology and consumer behavior as well.
The Long Fade Out
For people of a certain age group, early memories of acquiring new music are inexorably linked to piracy. Going to the store and purchasing a $20 disc wasn’t even a part of the thought process. Napster, the first widely used P2P service, figuratively skipped the needle off the record and ended years of impressive profitability in the recording industry.
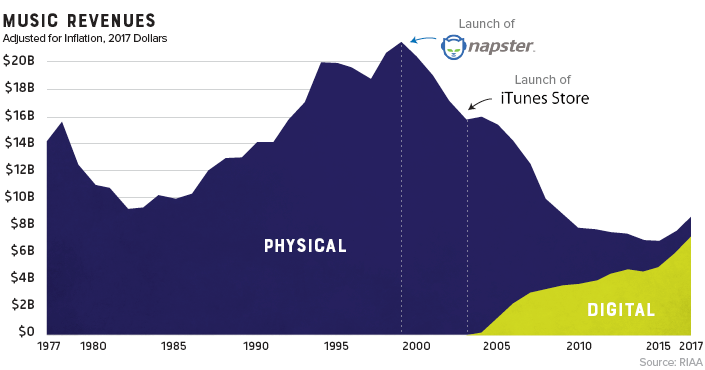
Napster was shut down in 2002, but the genie was already out of the bottle. Piracy’s effect on the industry was immediate and stark. Music industry sales, which had been experiencing impressive year-over-year growth, began a decline that would continue for 15 years.
The Ringtone Era
While acquiring music was as easy opening Limewire on your desktop computer, transferring that new T-Pain track to a flip-phone wasn’t a seamless experience.
This brief gap in technology – before smartphones hit mass adoption – brought us the ringtone era. Distribution was controlled by mobile carriers, so ringtones were a comfortable gateway for the record industry to get a taste for digital-based revenue. In 2008 alone, they injected over a billion dollars of revenue into an industry that was getting used to gloomy forecasts.
Paddling Upstream
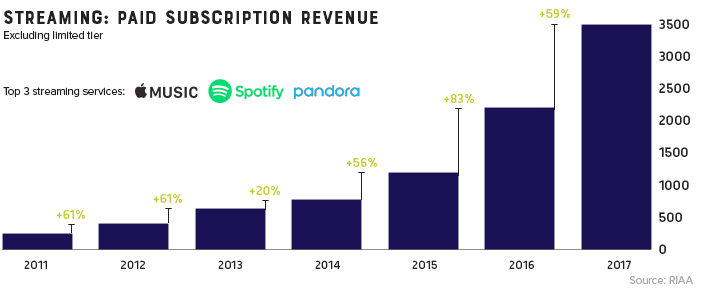
Though services like Spotify and Pandora haven’t replaced the money pipeline that CD sales provided, they have reversed the industry’s tailspin. For the first time this millennium, record industry posted an increase in revenue for two consecutive years (and likely a third in 2018).
It took a while for consumers to warm up to paying for a premium music subscription, but today, there’s a solid basis for optimism. Music streaming is now the most common format for music in the United States, and the RIAA reports that streaming now makes up nearly half of the market.
The End of Physical Format?
Gone are the days when people would line up at the music shop for a hot new release. In fact, CD sales are down 80% in the past decade. Today, physical format sales only account for 17% of the industry’s revenue.
There is, however, one bright spot in physical format segment: vinyl. In 2017, vinyl sales hit 25-year high after making a slow and steady comeback.
Vinyl is written in stone. I think if it’s made it for 120 years now, it’s here forever.
– Jack White


Technology
Ranked: Semiconductor Companies by Industry Revenue Share
Nvidia is coming for Intel’s crown. Samsung is losing ground. AI is transforming the space. We break down revenue for semiconductor companies.


Semiconductor Companies by Industry Revenue Share
This was originally posted on our Voronoi app. Download the app for free on Apple or Android and discover incredible data-driven charts from a variety of trusted sources.
Did you know that some computer chips are now retailing for the price of a new BMW?
As computers invade nearly every sphere of life, so too have the chips that power them, raising the revenues of the businesses dedicated to designing them.
But how did various chipmakers measure against each other last year?
We rank the biggest semiconductor companies by their percentage share of the industry’s revenues in 2023, using data from Omdia research.
Which Chip Company Made the Most Money in 2023?
Market leader and industry-defining veteran Intel still holds the crown for the most revenue in the sector, crossing $50 billion in 2023, or 10% of the broader industry’s topline.
All is not well at Intel, however, with the company’s stock price down over 20% year-to-date after it revealed billion-dollar losses in its foundry business.
| Rank | Company | 2023 Revenue | % of Industry Revenue |
|---|---|---|---|
| 1 | Intel | $51B | 9.4% |
| 2 | NVIDIA | $49B | 9.0% |
| 3 | Samsung Electronics | $44B | 8.1% |
| 4 | Qualcomm | $31B | 5.7% |
| 5 | Broadcom | $28B | 5.2% |
| 6 | SK Hynix | $24B | 4.4% |
| 7 | AMD | $22B | 4.1% |
| 8 | Apple | $19B | 3.4% |
| 9 | Infineon Tech | $17B | 3.2% |
| 10 | STMicroelectronics | $17B | 3.2% |
| 11 | Texas Instruments | $17B | 3.1% |
| 12 | Micron Technology | $16B | 2.9% |
| 13 | MediaTek | $14B | 2.6% |
| 14 | NXP | $13B | 2.4% |
| 15 | Analog Devices | $12B | 2.2% |
| 16 | Renesas Electronics Corporation | $11B | 1.9% |
| 17 | Sony Semiconductor Solutions Corporation | $10B | 1.9% |
| 18 | Microchip Technology | $8B | 1.5% |
| 19 | Onsemi | $8B | 1.4% |
| 20 | KIOXIA Corporation | $7B | 1.3% |
| N/A | Others | $126B | 23.2% |
| N/A | Total | $545B | 100% |
Note: Figures are rounded. Totals and percentages may not sum to 100.
Meanwhile, Nvidia is very close to overtaking Intel, after declaring $49 billion of topline revenue for 2023. This is more than double its 2022 revenue ($21 billion), increasing its share of industry revenues to 9%.
Nvidia’s meteoric rise has gotten a huge thumbs-up from investors. It became a trillion dollar stock last year, and broke the single-day gain record for market capitalization this year.
Other chipmakers haven’t been as successful. Out of the top 20 semiconductor companies by revenue, 12 did not match their 2022 revenues, including big names like Intel, Samsung, and AMD.
The Many Different Types of Chipmakers
All of these companies may belong to the same industry, but they don’t focus on the same niche.
According to Investopedia, there are four major types of chips, depending on their functionality: microprocessors, memory chips, standard chips, and complex systems on a chip.
Nvidia’s core business was once GPUs for computers (graphics processing units), but in recent years this has drastically shifted towards microprocessors for analytics and AI.
These specialized chips seem to be where the majority of growth is occurring within the sector. For example, companies that are largely in the memory segment—Samsung, SK Hynix, and Micron Technology—saw peak revenues in the mid-2010s.

-

 Real Estate2 weeks ago
Visualizing America’s Shortage of Affordable Homes
-

 Technology1 week ago
Ranked: Semiconductor Companies by Industry Revenue Share
-

 Money1 week ago
Which States Have the Highest Minimum Wage in America?
-

 Real Estate1 week ago
Ranked: The Most Valuable Housing Markets in America
-

 Business2 weeks ago
Charted: Big Four Market Share by S&P 500 Audits
-

 AI2 weeks ago
The Stock Performance of U.S. Chipmakers So Far in 2024
-

 Misc2 weeks ago
Almost Every EV Stock is Down After Q1 2024
-

 Money2 weeks ago
Where Does One U.S. Tax Dollar Go?