Technology
The Most Valuable Tech Skills in 2017
The Most Valuable Tech Skills
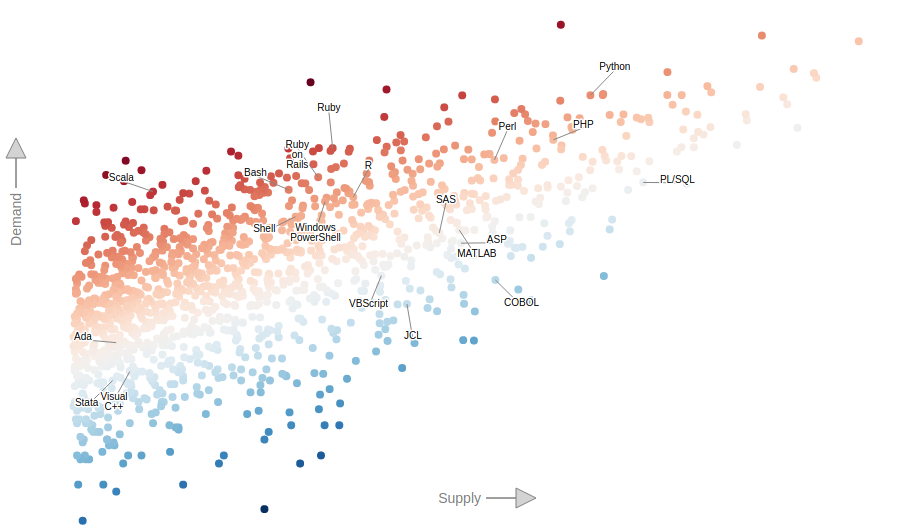
The interactive graphic above comes to us from Dice Insights, and it helps to visualize the relationship between the supply and demand for over 1,400 technology skills.
Specifically, the supply shown on the graph is based on the amount of job seekers with those skills available, while demand is the portion of employment opportunities listed that require that skill. The “hotter” red a skill is, the greater the ratio of demand to supply.
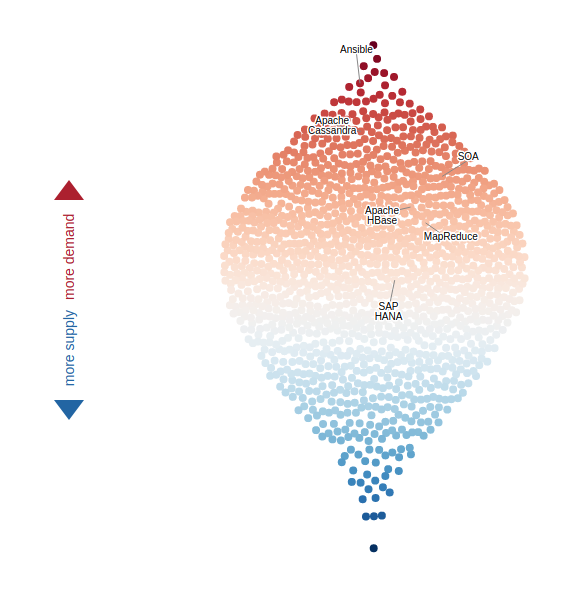
Big Data Heats Up
With billions of new “things” connecting to the IoT and an explosion in the amount of information that must be processed and interpreted, it is no surprise that many of the most lucrative skills in tech today relate to making sense of large volumes of data.
Here are the ten highest paying skills in technology, according to Dice:
| Rank | Skill | 2016 Salary | Yr/Yr Change |
|---|---|---|---|
| #1 | HANA | $128,958 | -3.30% |
| #2 | MapReduce | $125,009 | -0.30% |
| #3 | Cloud Foundry | $124,038 | n/a |
| #4 | Hbase | $123,934 | 5.70% |
| #5 | Omnigraffle | $123,782 | -1.90% |
| #6 | Cassandra | $123,459 | 2.20% |
| #7 | Apache Kafka | $122,728 | n/a |
| #8 | SOA | $122,094 | -1.90% |
| #9 | Ansible | $121,382 | n/a |
| #10 | Jetty | $120,978 | 1.30% |
Leading the list is SAP’s HANA, or “High Performance Analytical Application”, which is part of a new wave of databases that can crunch large amounts of data nearly instantly. The average salaries of workers skilled in HANA currently hover around $129,000.
If we sort the members of the top ten most lucrative skills list by “heat” level (with several omissions according to availability in the “heat data” set) we can see that HANA is right in the middle of the plot, where supply is roughly equal to demand. This shows us that tech workers choosing to skill up in HANA are effectively getting paid what they are worth.
Defining the Essentials
What else does “heat” ranking tell us about the market for tech skills that salary data alone does not?
First and foremost, it shows that skills like Java, SQL and HTML, all of which live in the top right-hand corner of the interactive graph where both demand and supply are very high, have become the “bread and butter” of the tech industry. The vast majority of people in the field have a need for these basic services, and as such, the majority of workers in tech have become conversant in them.
We can also see that specific fields, like database administration, web infrastructure management, automation, and big data science, are the areas that businesses need the most help in. The number of specialists skilled in these fields has not yet expanded to meet the significant demand for the associated skills. On the other hand, many marketing and web design skills have fallen toward the “cold” side of the spectrum as supply exceeds demand.
Competition and Timing
Employers may often look for very specific skill sets including one or more of the “hot” skills in the current marketplace. Combined with a hot technology sector, this demand pushes average salary ranges up and motivates tech workers to continually revise their competencies on a regular basis.
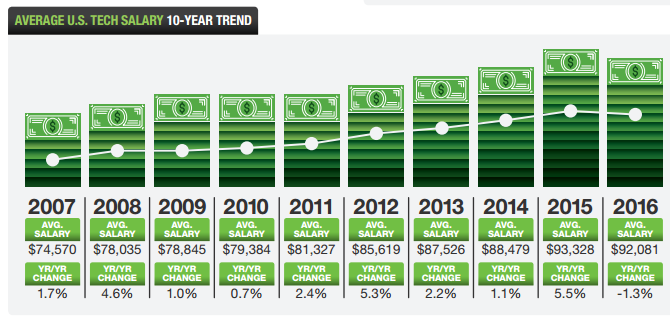
With such a fluid marketplace for jobs in technology, unemployment is very low at around 2%. At the same time, over the past decade, the average tech salary has also increased by roughly $17,000.


Technology
Visualizing AI Patents by Country
See which countries have been granted the most AI patents each year, from 2012 to 2022.


Visualizing AI Patents by Country
This was originally posted on our Voronoi app. Download the app for free on iOS or Android and discover incredible data-driven charts from a variety of trusted sources.
This infographic shows the number of AI-related patents granted each year from 2010 to 2022 (latest data available). These figures come from the Center for Security and Emerging Technology (CSET), accessed via Stanford University’s 2024 AI Index Report.
From this data, we can see that China first overtook the U.S. in 2013. Since then, the country has seen enormous growth in the number of AI patents granted each year.
| Year | China | EU and UK | U.S. | RoW | Global Total |
|---|---|---|---|---|---|
| 2010 | 307 | 137 | 984 | 571 | 1,999 |
| 2011 | 516 | 129 | 980 | 581 | 2,206 |
| 2012 | 926 | 112 | 950 | 660 | 2,648 |
| 2013 | 1,035 | 91 | 970 | 627 | 2,723 |
| 2014 | 1,278 | 97 | 1,078 | 667 | 3,120 |
| 2015 | 1,721 | 110 | 1,135 | 539 | 3,505 |
| 2016 | 1,621 | 128 | 1,298 | 714 | 3,761 |
| 2017 | 2,428 | 144 | 1,489 | 1,075 | 5,136 |
| 2018 | 4,741 | 155 | 1,674 | 1,574 | 8,144 |
| 2019 | 9,530 | 322 | 3,211 | 2,720 | 15,783 |
| 2020 | 13,071 | 406 | 5,441 | 4,455 | 23,373 |
| 2021 | 21,907 | 623 | 8,219 | 7,519 | 38,268 |
| 2022 | 35,315 | 1,173 | 12,077 | 13,699 | 62,264 |
In 2022, China was granted more patents than every other country combined.
While this suggests that the country is very active in researching the field of artificial intelligence, it doesn’t necessarily mean that China is the farthest in terms of capability.
Key Facts About AI Patents
According to CSET, AI patents relate to mathematical relationships and algorithms, which are considered abstract ideas under patent law. They can also have different meaning, depending on where they are filed.
In the U.S., AI patenting is concentrated amongst large companies including IBM, Microsoft, and Google. On the other hand, AI patenting in China is more distributed across government organizations, universities, and tech firms (e.g. Tencent).
In terms of focus area, China’s patents are typically related to computer vision, a field of AI that enables computers and systems to interpret visual data and inputs. Meanwhile America’s efforts are more evenly distributed across research fields.
Learn More About AI From Visual Capitalist
If you want to see more data visualizations on artificial intelligence, check out this graphic that shows which job departments will be impacted by AI the most.

-

 Markets1 week ago
U.S. Debt Interest Payments Reach $1 Trillion
-

 Markets2 weeks ago
Ranked: The Most Valuable Housing Markets in America
-

 Money2 weeks ago
Which States Have the Highest Minimum Wage in America?
-

 AI2 weeks ago
Ranked: Semiconductor Companies by Industry Revenue Share
-

 Markets2 weeks ago
Ranked: The World’s Top Flight Routes, by Revenue
-

 Countries2 weeks ago
Population Projections: The World’s 6 Largest Countries in 2075
-

 Markets2 weeks ago
The Top 10 States by Real GDP Growth in 2023
-

 Money2 weeks ago
The Smallest Gender Wage Gaps in OECD Countries