Green
Mapped: Where Are the World’s Most Sustainable Companies?
Where Are the World’s Most Sustainable Companies?
Everywhere you look, sustainability is permeating social, political, and business agendas.
In recent years, an impressive number of companies have stepped up to take a more active role in shaping a more sustainable future—not just in the environmental sense, but also by taking social and governance factors into consideration.
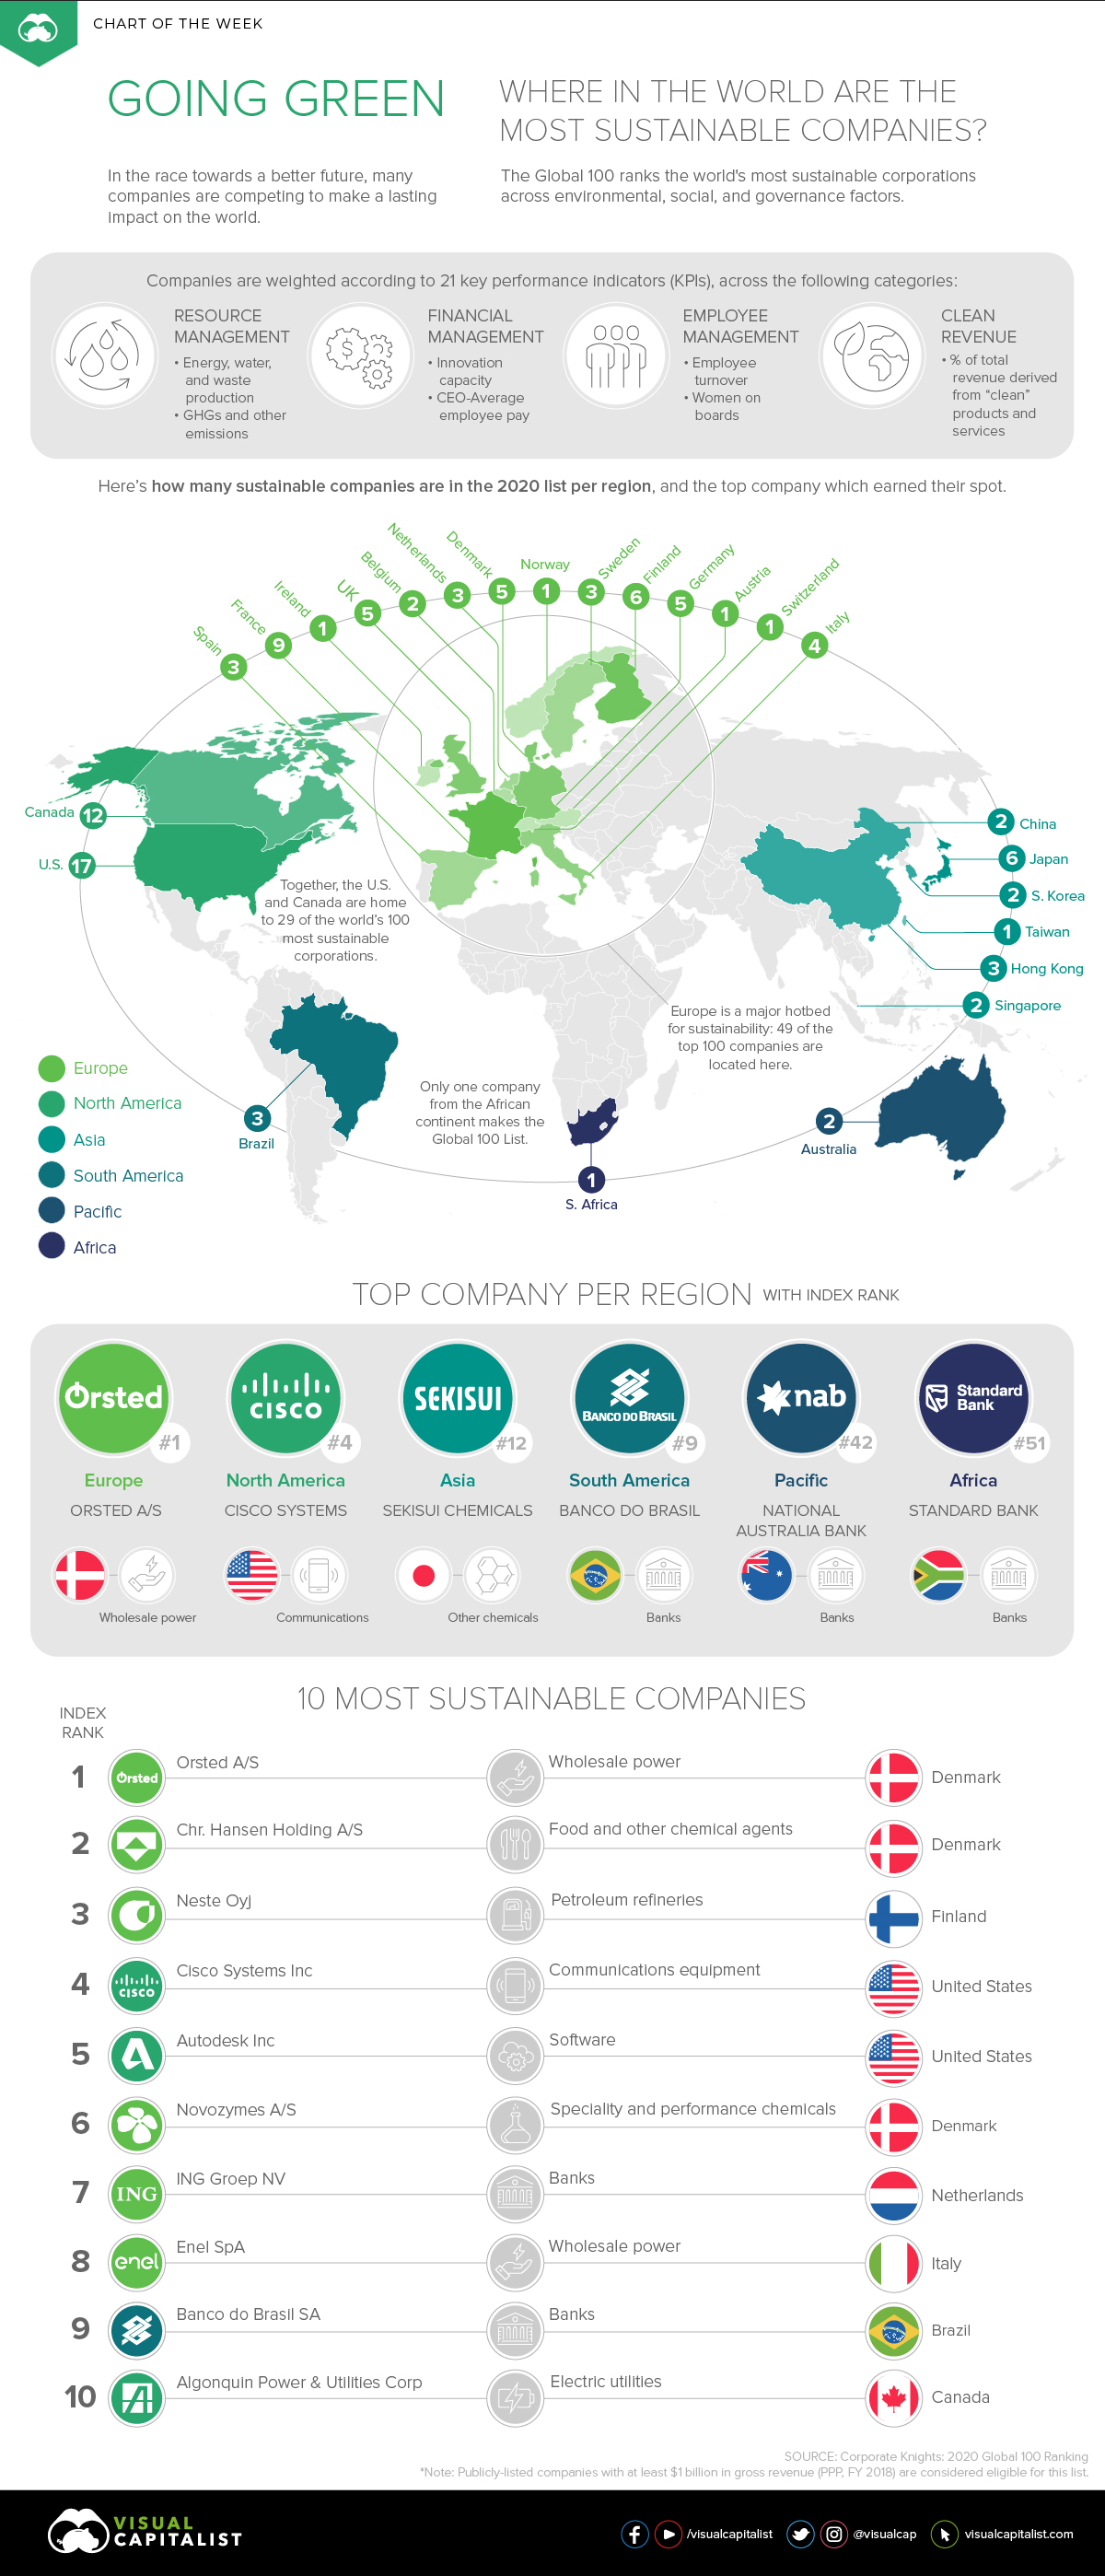
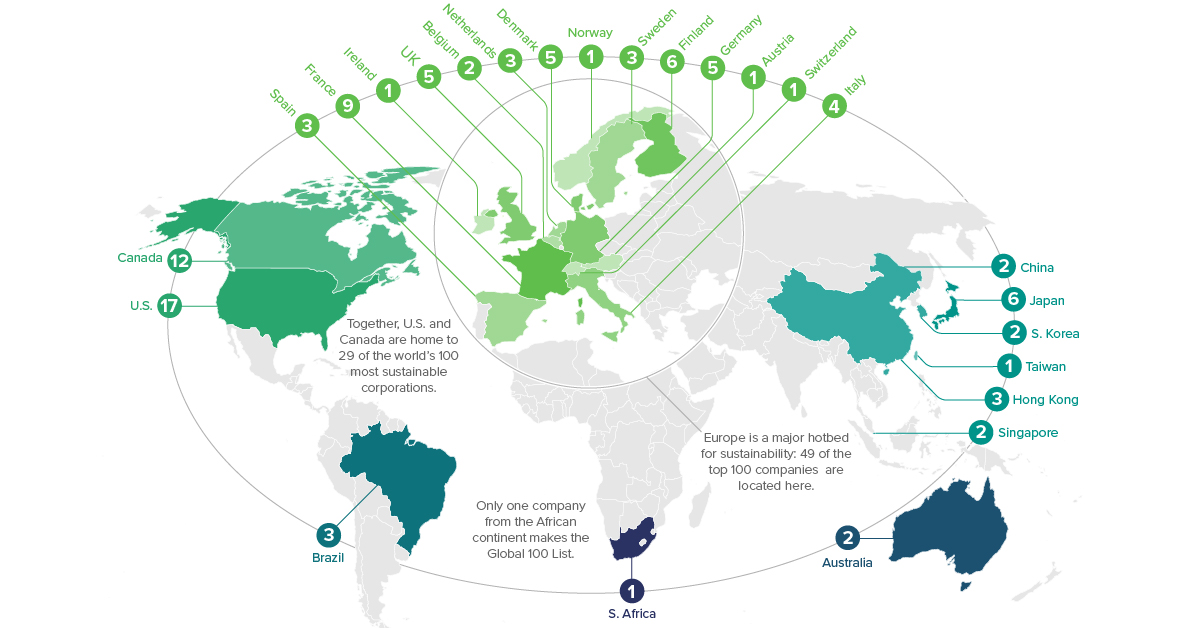
Today’s chart draws from the Corporate Knights Global 100, an annual ranking of the 100 most sustainable companies, to visualize exactly how many are located in each corner of the world. The companies on the list are clear winners not only because they aim to leave the world a better place, but because their stocks have also outperformed the market on average.
How is Corporate Sustainability Measured?
The researchers rely on readily available data for all publicly-listed companies with at least $1 billion in gross revenue (in PPP), as of the financial year 2018.
Companies are then screened for several key performance indicators (KPIs), including but not limited to the following categories and examples:
- Resource management
Example: GHGs and other emissions such as NOx and SOx emissions - Financial management
Example: Innovation capacity, or the percentage of R&D spending against total revenue - Employee management
Example: Women in executive management and/or on boards - Clean revenue
Example: The percentage of total revenue derived from “clean” products and services
The concentration of the most sustainable companies also varies greatly depending on where you look. Here’s a closer view of every region.
Europe: 49/100 Sustainable Companies
Europe is front-and-center in the tidal shift towards more sustainable business, driven by far-reaching regulations. With this in mind, it’s perhaps not surprising to see that Europe is a hotbed of activity.
Nearly half the world’s most sustainable companies are located in Europe. France paves the way with nine sustainable companies in the ranking, followed by Finland with six companies of 100.
| Rank | Company | Industry | Country |
|---|---|---|---|
| #1 | Ørsted A/S | Wholesale Power | 🇩🇰 Denmark |
| #2 | Chr. Hansen Holding A/S | Food and other chemical agents | 🇩🇰 Denmark |
| #3 | Neste Oyj | Petroleum Refineries | 🇫🇮 Finland |
| #6 | Novozymes A/S | Specialty and Performance Chemicals | 🇩🇰 Denmark |
| #7 | ING Groep NV | Banks | 🇳🇱 Netherlands |
| #8 | Enel SpA | Wholesale Power | 🇮🇹 Italy |
| #11 | Osram Licht AG | Electrical Equipment and Power Systems | 🇩🇪 Germany |
| #13 | Storebrand ASA | Insurance | 🇳🇴 Norway |
| #14 | Umicore SA | Primary Metals Products | 🇧🇪 Belgium |
| #17 | Iberdrola SA | Wholesale Power | 🇪🇸 Spain |
| #18 | Outotec Oyj | Machinery Manufacturing | 🇫🇮 Finland |
| #20 | Accenture PLC | Technology Consulting Services | 🇮🇪 Ireland |
| #21 | Dassault Systemes SE | Software | 🇫🇷 France |
| #23 | Kering SA | Apparel and Accessory Products | 🇫🇷 France |
| #24 | UPM-Kymmene Oyj | Forestry and Paper Products | 🇫🇮 Finland |
| #27 | H & M Hennes & Mauritz AB | Apparel and Accessories Retail | 🇸🇪 Sweden |
| #28 | Sanofi SA | Biopharmaceuticals | 🇫🇷 France |
| #29 | Schneider Electric SE | Industrial Conglomerates | 🇫🇷 France |
| #31 | BNP Paribas SA | Banks | 🇫🇷 France |
| #32 | Kone Oyj | Machinery Manufacturing | 🇫🇮 Finland |
| #33 | Verbund AG | Wholesale Power | 🇦🇹 Austria |
| #34 | Valeo SA | Consumer Vehicles and Parts | 🇫🇷 France |
| #35 | ERG S.p.A. | Wholesale Power | 🇮🇹 Italy |
| #37 | Vestas Wind Systems A/S | Electrical Equipment and Power Systems | 🇩🇰 Denmark |
| #38 | bioMérieux | Diagnostics and Drug Delivery Devices | 🇫🇷 France |
| #39 | Intesa Sanpaolo SpA | Banks | 🇮🇹 Italy |
| #40 | Koninklijke KPN NV | Wireless and Wireline Telecomm. Services | 🇳🇱 Netherlands |
| #41 | Siemens AG | Industrial Conglomerates | 🇩🇪 Germany |
| #45 | Koninklijke DSM NV | Food and other chemical agents | 🇳🇱 Netherlands |
| #46 | Unilever PLC | Personal Care and Cleaning Products | 🇬🇧 UK |
| #52 | Ericsson | Communications Equipment | 🇸🇪 Sweden |
| #55 | Adidas AG | Apparel and Accessory Products | 🇩🇪 Germany |
| #56 | AstraZeneca PLC | Biopharmaceuticals | 🇬🇧 UK |
| #59 | Commerzbank AG | Banks | 🇩🇪 Germany |
| #61 | Abb Ltd | Industrial Conglomerates | 🇨🇭 Switzerland |
| #64 | Pearson PLC | Personal Professional Services | 🇬🇧 UK |
| #65 | BT Group PLC | Wireless and Wireline Telecomm. Services | 🇬🇧 UK |
| #66 | Metso Oyj | Machinery Manufacturing | 🇫🇮 Finland |
| #69 | Assicurazioni Generali SpA | Insurance | 🇮🇹 Italy |
| #70 | Acciona SA | Facilities and Construction Services | 🇪🇸 Spain |
| #71 | Novo Nordisk A/S | Biopharmaceuticals | 🇩🇰 Denmark |
| #73 | Skandinaviska Enskilda Banken AB | Banks | 🇸🇪 Sweden |
| #76 | Ucb S.A. | Biopharmaceuticals | 🇧🇪 Belgium |
| #79 | GlaxoSmithKline PLC | Biopharmaceuticals | 🇬🇧 UK |
| #87 | BASF SE | Specialty and Performance Chemicals | 🇩🇪 Germany |
| #94 | Industria de Diseno Textil SA | Apparel and Accessories Retail | 🇪🇸 Spain |
| #98 | L'Oreal SA | Personal Care and Cleaning Products | 🇫🇷 France |
| #99 | Kesko Corporation | Food and Beverage Retail | 🇫🇮 Finland |
| #100 | Amundi SA | Investment Services | 🇫🇷 France |
Denmark’s Ørsted A/S claims the top of the leaderboard in 2020. Within a decade, the company has completely transformed its business model—shifting away from the Danish Oil and Natural Gas (DONG) company into a pure play renewable energy company. The company recognized the importance of this transition:
Running the company just for profit doesn’t make sense, but running it just for a bigger purpose is also not sustainable in the long term. Doing good and doing well must go together.
—Henrik Poulsen, CEO
Just 10 years ago, DONG was 85%-fossil fuel based, and only 15%-renewables based. Today, Ørsted has flipped these proportions. The company attributes its dramatic transformation to the societal demand for green energy, and aims to be carbon-neutral by 2025.
North America: 29/100 Sustainable Companies
In this region, the U.S. alone is responsible for 17 of the top 100 sustainable companies in the world. What’s more, of the 28 new companies to the 2020 Ranking, Canada is the homebase for nine of these entrants.
| Rank | Company | Industry | Country |
|---|---|---|---|
| #4 | Cisco Systems Inc | Communications Equipment | 🇺🇸 U.S. |
| #5 | Autodesk Inc | Software | 🇺🇸 U.S. |
| #10 | Algonquin Power & Utilities Corp | Electric Utilities | 🇨🇦 CA |
| #15 | Hewlett Packard Enterprise Co | Computer Hardware | 🇺🇸 U.S. |
| #16 | American Water | Water Utilities | 🇺🇸 U.S. |
| #22 | McCormick & Company | Food and Beverage Production | 🇺🇸 U.S. |
| #26 | Prologis Inc | Real Estate Investment Trusts (REITs) | 🇺🇸 U.S. |
| #44 | Bombardier Inc | Aerospace and Defense Manufacturing | 🇨🇦 CA |
| #47 | Sims Metal Management Ltd | Primary Metals Products | 🇺🇸 U.S. |
| #48 | Bank of Montreal | Banks | 🇨🇦 CA |
| #49 | Cascades Inc | Containers and Packaging | 🇨🇦 CA |
| #53 | Danaher Corporation | Medical Devices | 🇺🇸 U.S. |
| #54 | Canadian National Railway Co | Cargo Transportation and Infrastructure Services | 🇨🇦 CA |
| #57 | Stantec Inc | Facilities and Construction Services | 🇨🇦 CA |
| #58 | HP Inc | Computer Peripherals and Systems | 🇺🇸 U.S. |
| #60 | Sun Life Financial Inc | Insurance | 🇨🇦 CA |
| #62 | Alphabet Inc | Internet and Data Services | 🇺🇸 U.S. |
| #67 | Comerica Incorporated | Banks | 🇺🇸 U.S. |
| #74 | Tesla Inc | Consumer Vehicles and Parts | 🇺🇸 U.S. |
| #77 | Workday Inc | Software | 🇺🇸 U.S. |
| #78 | Merck & Co Inc | Biopharmaceuticals | 🇺🇸 U.S. |
| #81 | Intel Corporation | Semiconductor Manufacturing | 🇺🇸 U.S. |
| #82 | Analog Devices Inc | Semiconductor Manufacturing | 🇺🇸 U.S. |
| #83 | IGM Financial Inc | Investment Services | 🇨🇦 CA |
| #84 | Canadian Solar Inc | Electrical Equipment and Power Systems | 🇨🇦 CA |
| #88 | Cogeco Communications Inc | Wireless and Wireline Telecomm. Services | 🇨🇦 CA |
| #91 | Teck Resources Ltd. | Metal Ore Mining | 🇨🇦 CA |
| #93 | Campbell Soup | Food and Beverage Production | 🇺🇸 U.S. |
| #96 | Telus Corp. | Wireless and Wireline Telecomm. Services | 🇨🇦 CA |
Cisco Systems comes in fourth worldwide, partly as a result of its clean revenues worth a stunning $25 billion. Not far behind is Autodesk, which rose an impressive 43 places since 2019. The main factor behind this leap? The software corporation now operates its cloud platforms using 99% renewable energy.
Asia: 16/100 Sustainable Companies
Over in Asia, Japan is a clear leader, boasting six sustainable companies in the list. Interestingly, the companies are from a wide range of industries, from computers (Panasonic) to cars (Toyota).
| Rank | Company | Industry | Country |
|---|---|---|---|
| #12 | Sekisui Chemicals | Other Materials | 🇯🇵 Japan |
| #25 | Taiwan Semiconductor | Semiconductor Equipment and Services | 🇹🇼 Taiwan |
| #36 | City Developments Ltd | Real Estate Investment and Services | 🇸🇬 Singapore |
| #43 | Shinhan Financial Group | Banks | 🇰🇷 South Korea |
| #50 | Advantech | Computer Hardware | 🇹🇼 Taiwan |
| #63 | Capitaland Limited | Real Estate Investment and Services | 🇸🇬 Singapore |
| #68 | Takeda Pharmaceutical | Biopharmaceuticals | 🇯🇵 Japan |
| #72 | Konica Minolta | Computer Peripherals and Systems | 🇯🇵 Japan |
| #80 | Samsung | Electrical Equipment and Power Systems | 🇰🇷 South Korea |
| #85 | BYD Co. | Consumer Vehicles and Parts | 🇨🇳 China |
| #86 | Kao Corp. | Personal Care and Cleaning Products | 🇯🇵 Japan |
| #89 | Panasonic Corp. | Computer Hardware | 🇯🇵 Japan |
| #90 | Vitasoy | Food and Beverage Production | 🇭🇰 Hong Kong |
| #92 | Toyota Motor Corp. | Consumer Vehicles and Parts | 🇯🇵 Japan |
| #95 | Singtel | Wireless and Wireline Telecomm. Services | 🇸🇬 Singapore |
| #97 | Lenovo Group | Computer Peripherals and Systems | 🇨🇳 China |
Japanese plastics manufacturer Sekisui Chemicals comes in first in Asia, after an immense improvement of 77 positions in just one year. The company builds environmentally-friendly housing, and 28% of its revenue aligns with the UN’s Sustainable Development Goals (SDGs).
Rest of the World: 6/100 Sustainable Companies
There are a few notable mentions in other regions, too. Brazil’s Banco do Brasil remains in the top ten list, and is one of the three most sustainable companies in all of South America.
| Rank | Company | Industry | Country |
|---|---|---|---|
| #9 | Banco do Brasil SA | Banks | 🇧🇷 Brazil |
| #19 | CEMIG | Electric Utilities | 🇧🇷 Brazil |
| #30 | Natura Cosmeticos SA | Personal Care and Cleaning Products | 🇧🇷 Brazil |
| #42 | National Australia Bank Ltd | Banks | 🇦🇺 Australia |
| #51 | Standard Bank Group Ltd | Banks | 🇿🇦 South Africa |
| #75 | Westpac Banking Corp | Banks | 🇦🇺 Australia |
More than half of the companies in these remaining regions are banks. Incidentally, financial services are the biggest group in the Global 100 overall.
The Best of Both Worlds
As it turns out, you can have your cake and eat it, too.
Altogether, the Global 100 most sustainable companies have consistently outperformed*, and outlasted the average company in the MSCI ACWI (All Country World Index):
| Metric | G100 | MSCI ACWI |
|---|---|---|
| Annualized Return | 7.3% | 7.0% |
| Average Company Age | 83 years | 49 years |
*Between 2005-Dec. 31 2019
Corporate sustainability is a significant driving force for urgent climate action, and the sustainable companies on this list acknowledge the triple bottom line of not just making profit, but also creating a lasting impact on people and the planet.


Green
How Carbon Credits Can Help Close the Climate Funding Gap
To keep a 1.5℃ world within reach, global emissions need to fall by as much as 45% by 2030, and carbon credits could help close the gap.


How Carbon Credits Can Help Close the Climate Funding Gap
Governments around the world have committed to the goals of the Paris Agreement, but their climate pledges are insufficient. To keep a 1.5℃ world within reach, global emissions need to fall by as much as 45% by 2030.
Bold and immediate action is essential, but so are resources that will make it happen.
In this graphic, we have partnered with Carbon Streaming to look at the role that the voluntary carbon market and carbon credits can play in closing that gap.
More Funds are Needed for Climate Finance
According to data from the Climate Policy Initiative, climate finance, which includes funds for both adaptation and mitigation, needs to increase at least five-fold, from $1.3T in 2021/2022, to an average $8.6T annually until 2030, and then to just over $10T in the two decades leading up to 2050.
That adds up to a very large number, but consider that in 2022, $7.0T went to fossil fuel subsidies, which almost covers the annual estimated outlay. And the world has shown that when pressed, governments can come up with the money, if the global pandemic is any indication.
Mobilizing Carbon Finance to the Developing World
But the same cannot be said of the developing world, where debt, inequality, and poverty reduce the ability of governments to act. And this is where carbon credits can play an important role. According to analyses from Ecosystem Marketplace, carbon credits help move capital from developed countries, to where funds are needed in the developing world.
For example, in 2019, 69.2% of the carbon credits by volume in the voluntary carbon market were purchased by buyers in Europe, and nearly a third from North America. Compare that to over 90% of the volume of carbon credits sold in the voluntary carbon market in 2022 came from projects that were located outside of those two regions.
Carbon Credits Can Complement Decarbonization Efforts
Carbon credits can also complement decarbonization efforts in the corporate world, where more and more companies have been signing up to reduce emissions. According to the 2022 monitoring report from the Science Based Targets initiative, 4,230 companies around the world had approved targets and commitments, which represented an 88% increase from the prior year. However, as of year end 2022, combined scope 1 and 2 emissions covered by science-based targets totaled approximately 2 GtCO2e, which represents just a fraction of global emissions.
The fine print is that this is just scope 1 and 2 emissions, and doesn’t include scope 3 emissions, which can account for more than 70% of a company’s total emissions. And as these emissions come under greater and greater scrutiny the closer we get to 2030 and beyond, the voluntary carbon credit market could expand exponentially to help meet the need to compensate for these emissions.
Potential Carbon Credit Market Size in 2030
OK, but how big? In 2022, the voluntary carbon credit market was around $2B, but some analysts predict that it could grow to between $5–250 billion by 2030.
| Firm | Low Estimate | High Estimate |
|---|---|---|
| Bain & Company | $15B | $30B |
| Barclays | N/A | $250B |
| Citigroup | $5B | $50B |
| McKinsey & Company | $5B | $50B |
| Morgan Stanley | N/A | $100B |
| Shell / Boston Consulting Group | $10B | $40B |
Morgan Stanley and Barclays were the most bullish on the size of the voluntary carbon credit market in 2030, but the latter firm was even more optimistic about 2050, and predicted that the voluntary carbon credit market could grow to a colossal $1.5 trillion.
Carbon Streaming is Focused on Carbon Credit Integrity
Ultimately, carbon credits could have an important role to play in marshaling the resources needed to keep the world on track to net zero by 2050, and avoiding the worst consequences of a warming world.
Carbon Streaming uses streaming transactions, a proven and flexible funding model, to scale high-integrity carbon credit projects to advance global climate action and UN Sustainable Development Goals.
Learn more at www.carbonstreaming.com.

-

 Green7 days ago
Ranking the Top 15 Countries by Carbon Tax Revenue
This graphic highlights France and Canada as the global leaders when it comes to generating carbon tax revenue.
-

 Green1 week ago
Ranked: The Countries With the Most Air Pollution in 2023
South Asian nations are the global hotspot for pollution. In this graphic, we rank the world’s most polluted countries according to IQAir.
-

 Environment1 week ago
Top Countries By Forest Growth Since 2001
One country is taking reforestation very seriously, registering more than 400,000 square km of forest growth in two decades.
-

 Green3 weeks ago
Ranked: Top Countries by Total Forest Loss Since 2001
The country with the most forest loss since 2001 lost as much forest cover as the next four countries combined.
-

 Markets2 months ago
The World’s Top Cocoa Producing Countries
Here are the largest cocoa producing countries globally—from Côte d’Ivoire to Brazil—as cocoa prices hit record highs.
-

 Environment2 months ago
Charted: Share of World Forests by Country
We visualize which countries have the biggest share of world forests by area—and while country size plays a factor, so too, does the environment.


-

 Travel1 week ago
Airline Incidents: How Do Boeing and Airbus Compare?
-

 Markets3 weeks ago
Visualizing America’s Shortage of Affordable Homes
-
Green3 weeks ago
Ranked: Top Countries by Total Forest Loss Since 2001
-

 Money2 weeks ago
Where Does One U.S. Tax Dollar Go?
-

 Misc2 weeks ago
Almost Every EV Stock is Down After Q1 2024
-

 AI2 weeks ago
The Stock Performance of U.S. Chipmakers So Far in 2024
-

 Markets2 weeks ago
Charted: Big Four Market Share by S&P 500 Audits
-

 Real Estate2 weeks ago
Ranked: The Most Valuable Housing Markets in America