Maps
The Most Profitable Industry in Every U.S. State
A glance the leading industries in the U.S. reveals a few surprises – and less diversity than you might think.
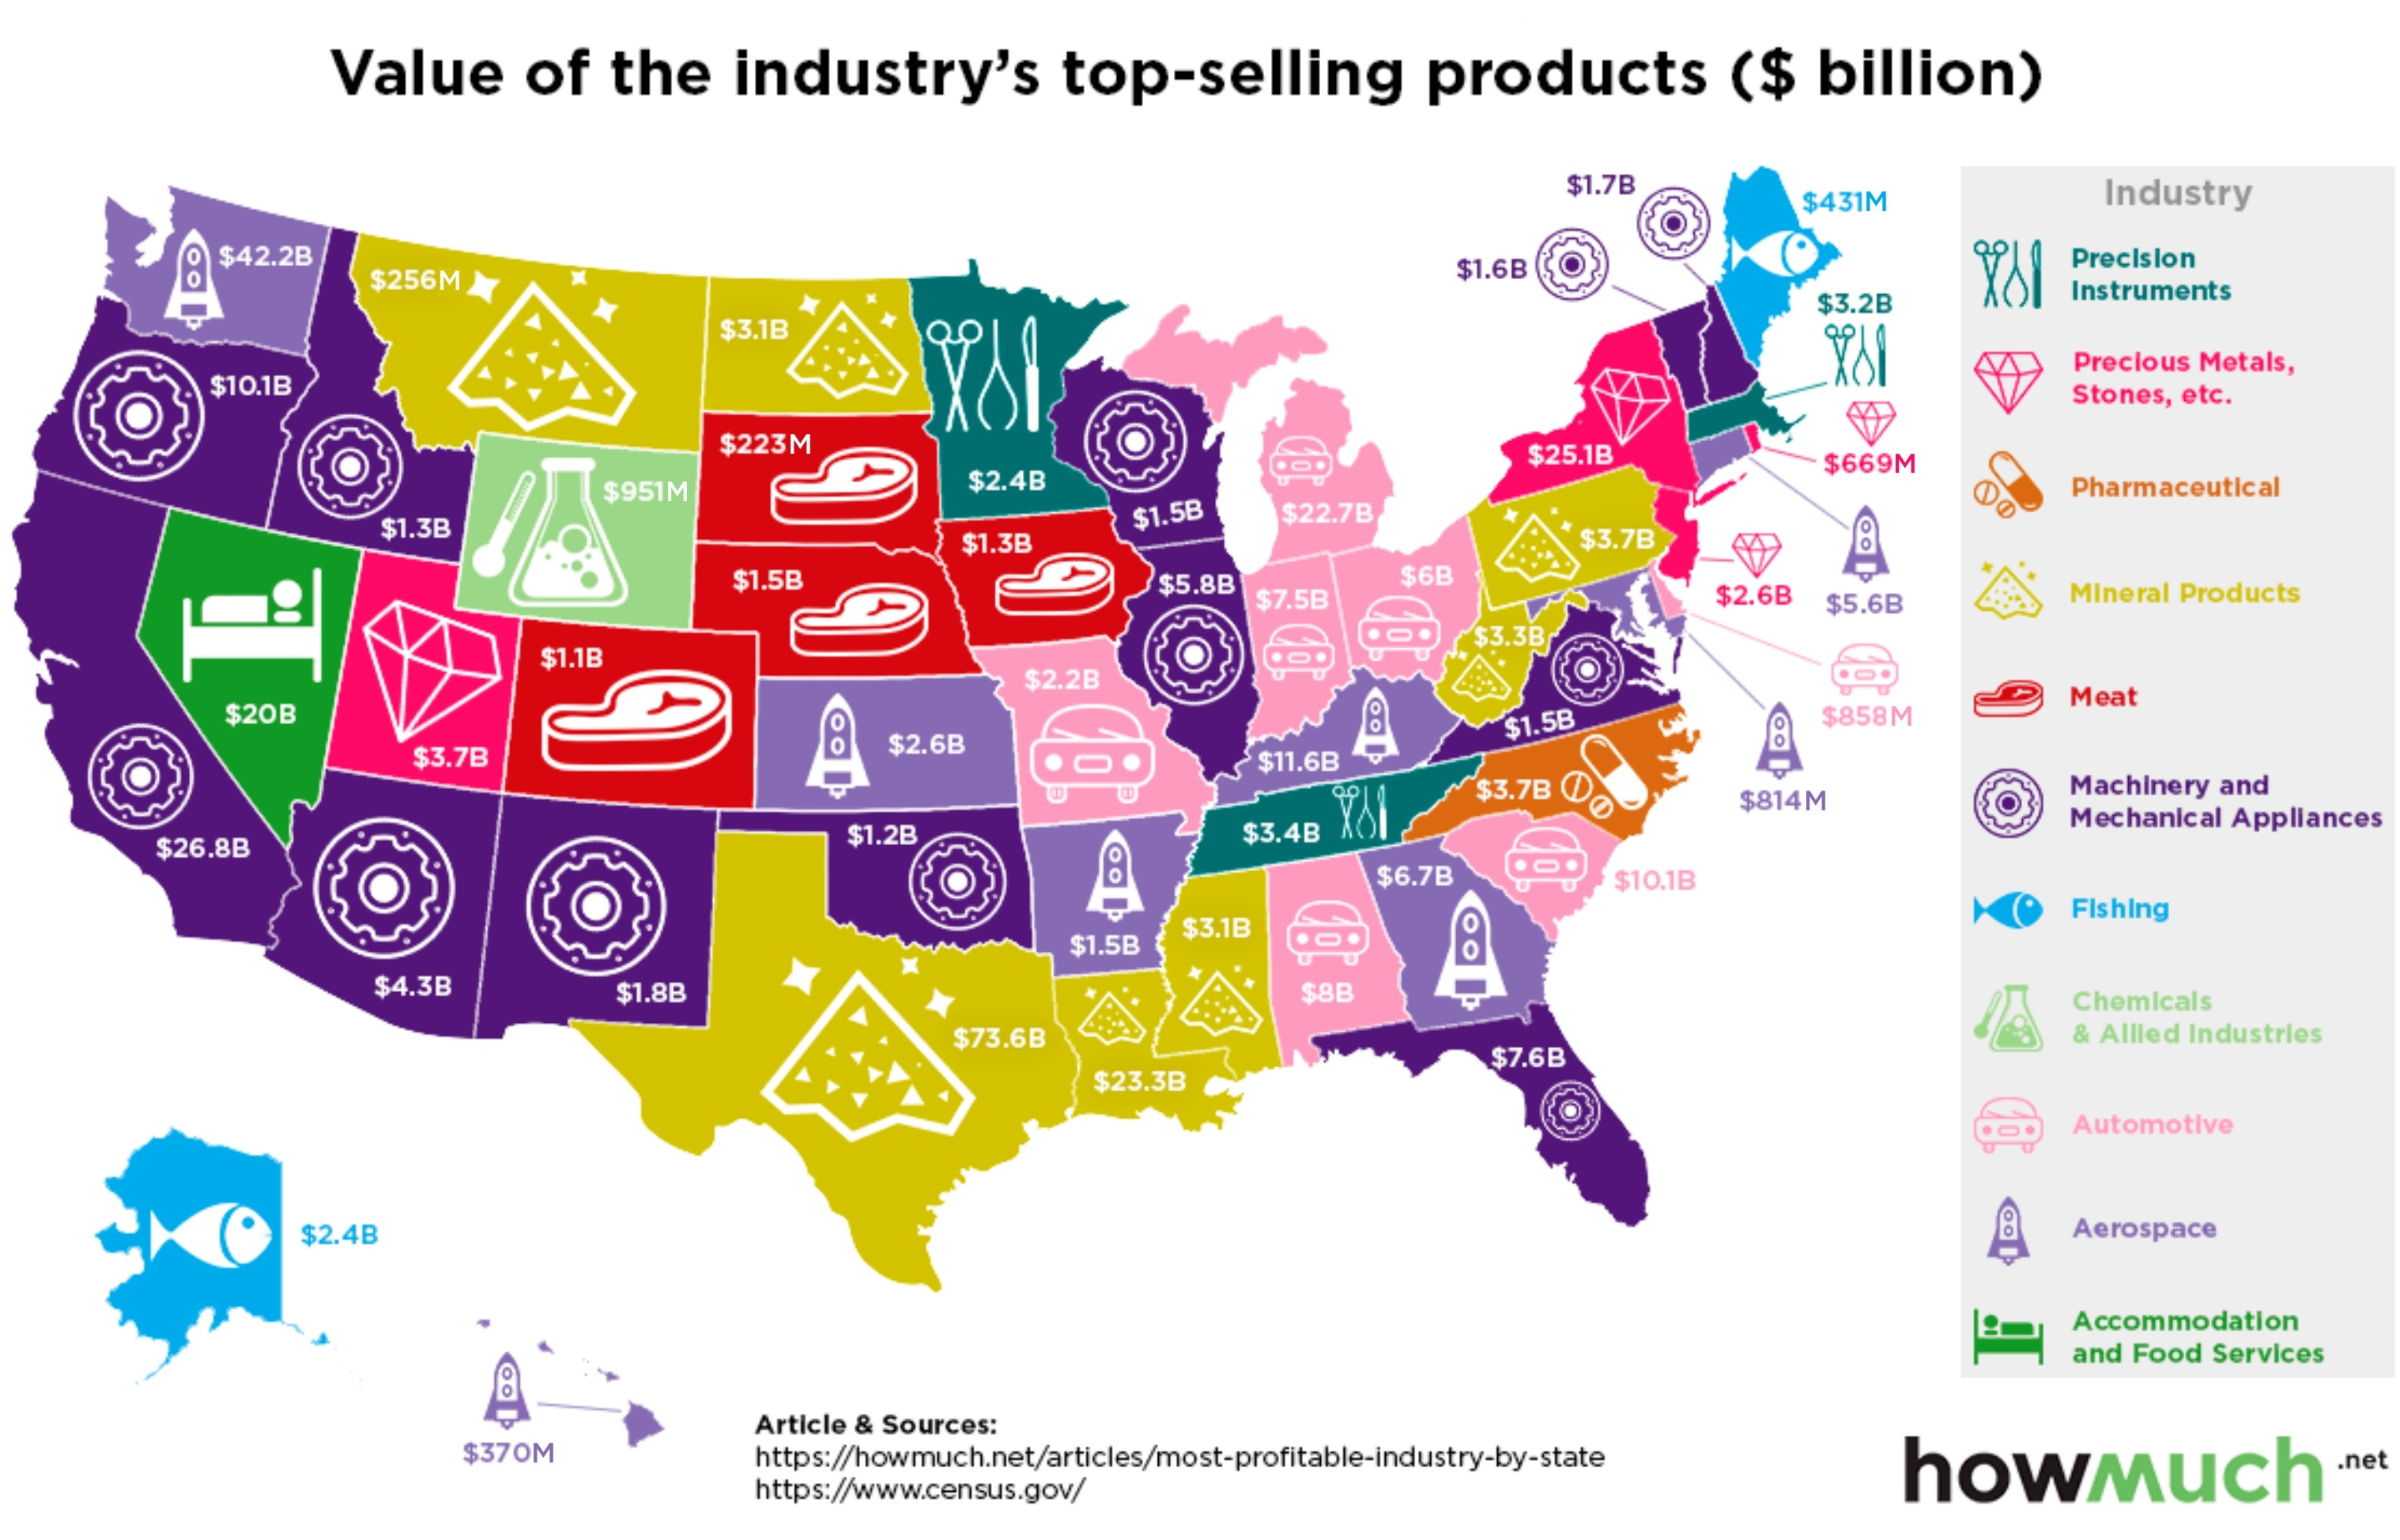
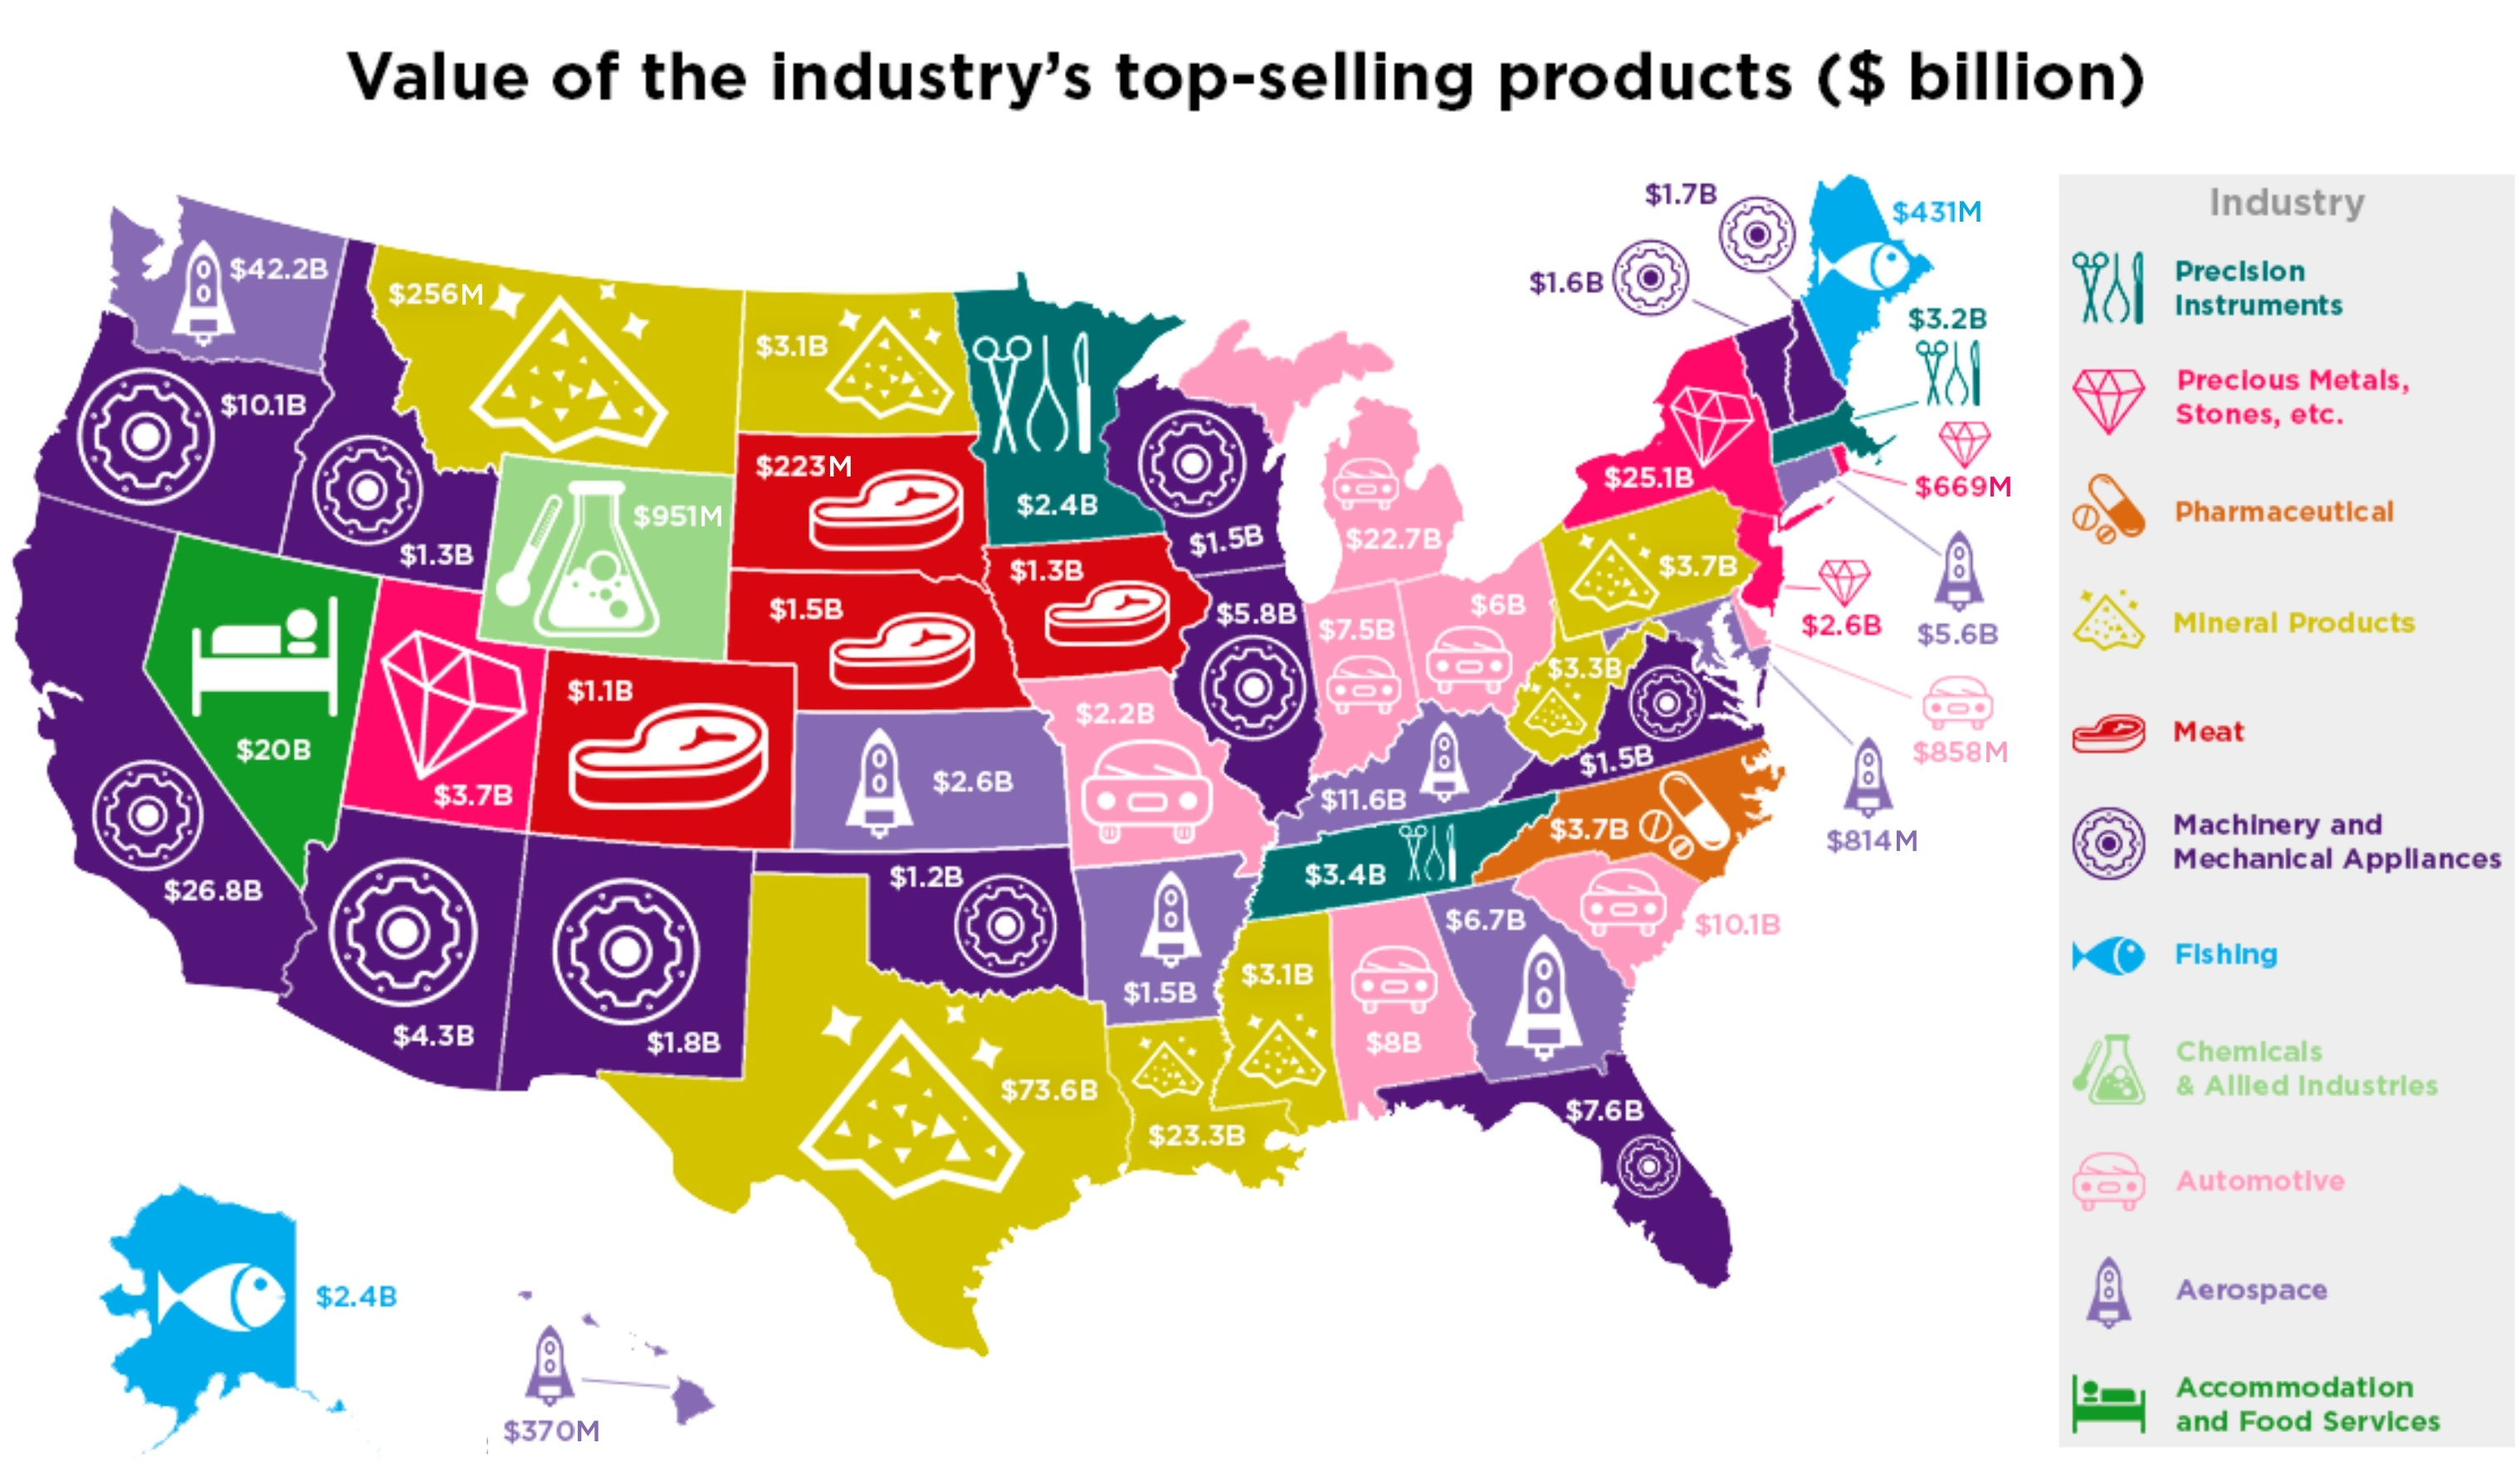
Today’s graphic from HowMuch.net uses data from GO Banking Rates and the U.S. Census Bureau to map out the most profitable industry in each U.S. State.
A Unique State Identity
While each U.S. state is unique in its cultural identity, the lay of the land determines which industries will thrive. Where some regions are ideal for agriculture, others have built a strong foundation of industry and research, and still others have established themselves as tourism hubs.
Whatever industry has staked its claim in your particular state, it has a direct link to your state exports and local economy.
It’s important to note that the most profitable industry is not necessarily the biggest industry in each state. The following figures are based on the value of top-selling industry products in 2017, using Harmonized System (HS) codes and U.S. Census Bureau data.
Rounding out the top five:
- Texas – Abundant oil supply helped the Lone Star State bring in more than $73 billion from mineral products last year.
- Washington – Despite a 9% drop from the previous year, aerospace still pulled in $42 billion for Washington state in 2017.
- California – Machinery and mechanical appliances lead the Golden State, to the tune of $27 billion.
- New York – Diamonds are New York’s best friend, where the precious metals and stones industry earned more than $25 billion in export sales.
- Louisiana – Its proximity to the Gulf of Mexico makes Louisiana a hub for mineral products, particularly oil. The industry raked in more than $23 billion in exports last year.
Diversify and Conquer
While some of these designations are nearly automatic – like fishing in Maine and Alaska – others are more surprising. Most surprising of all is the variety, or lack thereof: 50 states share a mere 11 major industries. When those industries are touched by market volatility or trade disruptions, it can prompt a ripple effect across several state economies.
Here’s a detailed breakdown of each state’s major industry, and the value of top-selling products last year:
State | Most Profitable Industry | Value of industry's top-selling products (2017) |
---|---|---|
Alabama | Automotive | $8 billion |
Alaska | Fishing | $2.359 billion |
Arizona | Machinery and Mechanical Appliances | $4.27 billion |
Arkansas | Aerospace | $1.5 billion |
California | Machinery and Mechanical Appliances | $27 billion |
Colorado | Meat | $1 billion |
Connecticut | Aerospace | $5.627 billion |
Delaware | Automotive | $858 million |
Florida | Machinery and Mechanical Appliances | $7.576 billion |
Georgia | Aerospace | $6.694 billion |
Hawaii | Aerospace | $370 million |
Idaho | Machinery and Mechanical Appliances | $1.309 billion |
Illinois | Machinery and Mechanical Appliances | $5.7 billion |
Indiana | Automotive | $7.526 billion |
Iowa | Meat | $1.324 billion |
Kansas | Aerospace | $2.565 billion |
Kentucky | Aerospace | $11.649 billion |
Louisiana | Mineral Products | $23 billion |
Maine | Fishing | $431 million |
Maryland | Aerospace | $814 million |
Massachusetts | Precision Instruments | $3.2 billion |
Michigan | Automotive | $22.735 billion |
Minnesota | Precision Instruments | $2.417 billion |
Mississippi | Mineral Products | $3.076 billion |
Missouri | Automotive | $2.234 billion |
Montana | Mineral Products | $256 million |
Nebraska | Meat | $1.52 billion |
Nevada | Accommodation and Food Services | $20 billion |
New Hampshire | Machinery and Mechanical Appliances | $1.685 billion |
New Jersey | Precious Metals, Stones, etc. | $2.624 billion |
New Mexico | Machinery and Mechanical Appliances | $1.835 billion |
New York | Precious Metals, Stones, etc. | $25 billion |
North Carolina | Medical | $3.698 billion |
North Dakota | Mineral Products | $1.814 billion |
Ohio | Automotive | $6 billion |
Oklahoma | Machinery and Mechanical Appliances | $1.1 billion |
Oregon | Machinery and Mechanical Appliances | $10.125 billion |
Pennsylvania | Mineral Products | $3.672 billion |
Rhode Island | Precious Metals, Stones, etc. | $670 million |
South Carolina | Automotive | $10.107 billion |
South Dakota | Meat | $223 million |
Tennessee | Precision Instruments | $3.425 billion |
Texas | Mineral Products | $73 billion |
Utah | Precious Metals, Stones, etc. | $3.714 billion |
Vermont | Machinery and Mechanical Appliances | $1.6 billion |
Virginia | Machinery and Mechanical Appliances | $1.5 billion |
Washington | Aerospace | $42.163 billion |
West Virginia | Mineral Products | $3.261 billion |
Wisconsin | Machinery and Mechanical Appliances | $1.538 billion |
Wyoming | Chemicals and Allied Industries | $1.25 billion |
War
Interactive: Comparing Military Spend Around the World
Which countries have the highest military spend relative to their economy? This visual breaks down the amount spent in each country by GDP.

Comparing Military Spend Around the World
One of the easiest ways to identify a nation’s priorities is by tracking its expenditures, and military spend is no different.
Usually spending is measured, and ranked, in absolute amounts. For example, countries around the world collectively spent $2.1 trillion on their militaries in 2021, with the most coming from the U.S. ($800 billion), China ($293 billion), and India ($77 billion).
But these eye-popping figures are best understood in the context of each country’s economy. Using data from the Stockholm International Peace Research Institute (SIPRI), Varun Jain has visualized 158 countries’ military expenditures, both as a percentage of their total GDP as well as in average per-capita spend.
Countries’ Military Spend as a Percentage of their Economy
To begin, Jain identified three categories of military expenditure as a percent of GDP, using the five-year (2018‒2022) average for more consistent data:
Military Spend | % of GDP | Countries |
---|---|---|
High | Above 5% | 7 |
Medium | 2‒5% | 44 |
Low | Below 2% | 107 |
Under this categorization, the stand outs are the countries spending an outsized amount of their economic output on military, rather than the highest total spenders in absolute terms.
At the top of the table is Ukraine, which has earmarked a staggering average of 9.46% of its total economic output on defense over the past five years. That’s well ahead of second-place Saudi Arabia, which is slightly above 8%.
In Ukraine’s case, its high ranking shows how quickly priorities can change. From 2018 to 2021, the country spent 3.2-3.8% of its GDP on its military, but the outbreak of war with Russia saw its expenditures jump to one-third of economic output.
Other countries from the Middle East and North Africa follow in this tier, with Oman third at 8.11% and Qatar fourth with 5.88%. Rounding out the top seven high spenders are Algeria, Kuwait, and Israel.
Rank | Country | Military Spend | % of GDP |
---|---|---|---|
1 | 🇺🇦 Ukraine | High | 9.46% |
2 | 🇸🇦 Saudi Arabia | High | 8.19% |
3 | 🇴🇲 Oman | High | 8.11% |
4 | 🇶🇦 Qatar | High | 5.88% |
5 | 🇩🇿 Algeria | High | 5.70% |
6 | 🇰🇼 Kuwait | High | 5.66% |
7 | 🇮🇱 Israel | High | 5.09% |
8 | 🇯🇴 Jordan | Medium | 4.81% |
9 | 🇦🇲 Armenia | Medium | 4.53% |
10 | 🇦🇿 Azerbaijan | Medium | 4.53% |
11 | 🇱🇧 Lebanon | Medium | 4.01% |
12 | 🇷🇺 Russia | Medium | 3.98% |
13 | 🇧🇭 Bahrain | Medium | 3.79% |
14 | 🇵🇰 Pakistan | Medium | 3.75% |
15 | 🇲🇦 Morocco | Medium | 3.72% |
16 | 🇺🇿 Uzbekistan | Medium | 3.56% |
17 | 🇺🇸 U.S. | Medium | 3.48% |
18 | 🇨🇴 Colombia | Medium | 3.24% |
19 | 🇬🇷 Greece | Medium | 3.15% |
20 | 🇳🇦 Namibia | Medium | 3.09% |
21 | 🇧🇳 Brunei | Medium | 3.09% |
22 | 🇸🇸 South Sudan | Medium | 3.05% |
23 | 🇹🇬 Togo | Medium | 3.03% |
24 | 🇲🇱 Mali | Medium | 2.90% |
25 | 🇨🇺 Cuba | Medium | 2.88% |
26 | 🇸🇬 Singapore | Medium | 2.86% |
27 | 🇧🇼 Botswana | Medium | 2.86% |
28 | 🇲🇲 Myanmar | Medium | 2.76% |
29 | 🇧🇫 Burkina Faso | Medium | 2.70% |
30 | 🇮🇶 Iraq | Medium | 2.69% |
31 | 🇰🇷 South Korea | Medium | 2.69% |
32 | 🇨🇬 Republic of Congo | Medium | 2.68% |
33 | 🇹🇩 Chad | Medium | 2.66% |
34 | 🇮🇳 India | Medium | 2.58% |
35 | 🇹🇳 Tunisia | Medium | 2.58% |
36 | 🇪🇨 Ecuador | Medium | 2.34% |
37 | 🇮🇷 Iran | Medium | 2.32% |
38 | 🇻🇳 Viet Nam | Medium | 2.28% |
39 | 🇰🇭 Cambodia | Medium | 2.26% |
40 | 🇲🇷 Mauritania | Medium | 2.24% |
41 | 🇳🇪 Niger | Medium | 2.21% |
42 | 🇧🇮 Burundi | Medium | 2.21% |
43 | 🇹🇷 Turkey | Medium | 2.19% |
44 | 🇵🇱 Poland | Medium | 2.17% |
45 | 🇱🇻 Latvia | Medium | 2.14% |
46 | 🇱🇹 Lithuania | Medium | 2.13% |
47 | 🇪🇪 Estonia | Medium | 2.13% |
48 | 🇬🇧 United Kingdom | Medium | 2.12% |
49 | 🇺🇾 Uruguay | Medium | 2.11% |
50 | 🇷🇸 Serbia | Medium | 2.06% |
51 | 🇺🇬 Uganda | Medium | 2.02% |
52 | 🇭🇷 Croatia | Low | 1.97% |
53 | 🇦🇺 Australia | Low | 1.93% |
54 | 🇨🇱 Chile | Low | 1.92% |
55 | 🇫🇷 France | Low | 1.91% |
56 | 🇨🇾 Cyprus | Low | 1.90% |
57 | 🇷🇴 Romania | Low | 1.87% |
58 | 🇧🇬 Bulgaria | Low | 1.85% |
59 | 🇸🇿 Eswatini | Low | 1.82% |
60 | 🇳🇴 Norway | Low | 1.81% |
61 | 🇨🇫 Central African Republic | Low | 1.78% |
62 | 🇱🇰 Sri Lanka | Low | 1.77% |
63 | 🇵🇹 Portugal | Low | 1.77% |
64 | 🇹🇼 Taiwan | Low | 1.76% |
65 | 🇨🇳 China | Low | 1.72% |
66 | 🇬🇪 Georgia | Low | 1.71% |
67 | 🇸🇰 Slovakia | Low | 1.67% |
68 | 🇬🇼 Guinea-Bissau | Low | 1.65% |
69 | 🇰🇬 Kyrgyzstan | Low | 1.62% |
70 | 🇬🇳 Guinea | Low | 1.61% |
71 | 🇫🇮 Finland | Low | 1.60% |
72 | 🇸🇳 Senegal | Low | 1.58% |
73 | 🇭🇳 Honduras | Low | 1.56% |
74 | 🇬🇦 Gabon | Low | 1.56% |
75 | 🇲🇿 Mozambique | Low | 1.56% |
76 | 🇱🇸 Lesotho | Low | 1.56% |
77 | 🇲🇪 Montenegro | Low | 1.54% |
78 | 🇫🇯 Fiji | Low | 1.54% |
79 | 🇯🇲 Jamaica | Low | 1.49% |
80 | 🇦🇴 Angola | Low | 1.48% |
81 | 🇮🇹 Italy | Low | 1.48% |
82 | 🇭🇺 Hungary | Low | 1.48% |
83 | 🇧🇴 Bolivia | Low | 1.46% |
84 | 🇸🇨 Seychelles | Low | 1.43% |
85 | 🇳🇱 Netherlands | Low | 1.41% |
86 | 🇸🇩 Sudan | Low | 1.39% |
87 | 🇷🇼 Rwanda | Low | 1.39% |
88 | 🇳🇵 Nepal | Low | 1.36% |
89 | 🇩🇰 Denmark | Low | 1.36% |
90 | 🇦🇱 Albania | Low | 1.34% |
91 | 🇪🇸 Spain | Low | 1.34% |
92 | 🇹🇭 Thailand | Low | 1.33% |
93 | 🇦🇫 Afghanistan | Low | 1.33% |
94 | 🇳🇿 New Zealand | Low | 1.32% |
95 | 🇨🇦 Canada | Low | 1.32% |
96 | 🇩🇪 Germany | Low | 1.31% |
97 | 🇲🇰 North Macedonia | Low | 1.30% |
98 | 🇧🇷 Brazil | Low | 1.29% |
99 | 🇧🇿 Belize | Low | 1.28% |
100 | 🇸🇻 El Salvador | Low | 1.28% |
101 | 🇧🇩 Bangladesh | Low | 1.26% |
102 | 🇿🇲 Zambia | Low | 1.25% |
103 | 🇬🇶 Equatorial Guinea | Low | 1.24% |
104 | 🇬🇾 Guyana | Low | 1.22% |
105 | 🇨🇮 Cote d'Ivoire | Low | 1.22% |
106 | 🇪🇬 Egypt | Low | 1.20% |
107 | 🇵🇪 Peru | Low | 1.20% |
108 | 🇧🇾 Belarus | Low | 1.18% |
109 | 🇸🇪 Sweden | Low | 1.17% |
110 | 🇰🇪 Kenya | Low | 1.13% |
111 | 🇸🇮 Slovenia | Low | 1.10% |
112 | 🇹🇱 Timor Leste | Low | 1.08% |
113 | 🇹🇿 Tanzania | Low | 1.05% |
114 | 🇨🇲 Cameroon | Low | 1.04% |
115 | 🇹🇯 Tajikistan | Low | 1.03% |
116 | 🇯🇵 Japan | Low | 1.03% |
117 | 🇧🇪 Belgium | Low | 1.02% |
118 | 🇱🇷 Liberia | Low | 1.00% |
119 | 🇲🇾 Malaysia | Low | 0.98% |
120 | 🇵🇭 Philippines | Low | 0.96% |
121 | 🇵🇾 Paraguay | Low | 0.95% |
122 | 🇽🇰 Kosovo | Low | 0.95% |
123 | 🇿🇦 South Africa | Low | 0.94% |
124 | 🇲🇼 Malawi | Low | 0.92% |
125 | 🇧🇦 Bosnia and Herzegovina | Low | 0.84% |
126 | 🇰🇿 Kazakhstan | Low | 0.83% |
127 | 🇦🇹 Austria | Low | 0.78% |
128 | 🇬🇲 Gambia | Low | 0.76% |
129 | 🇹🇹 Trinidad & Tobago | Low | 0.75% |
130 | 🇮🇩 Indonesia | Low | 0.74% |
131 | 🇨🇭 Switzerland | Low | 0.73% |
132 | 🇨🇿 Czech Republic | Low | 0.71% |
133 | 🇩🇴 Dominican Republic | Low | 0.70% |
134 | 🇲🇳 Mongolia | Low | 0.69% |
135 | 🇲🇬 Madagascar | Low | 0.68% |
136 | 🇨🇩 Dem. Rep. of Congo | Low | 0.64% |
137 | 🇳🇬 Nigeria | Low | 0.64% |
138 | 🇪🇹 Ethiopia | Low | 0.64% |
139 | 🇸🇱 Sierra Leone | Low | 0.64% |
140 | 🇦🇷 Argentina | Low | 0.63% |
141 | 🇱🇺 Luxembourg | Low | 0.61% |
142 | 🇲🇽 Mexico | Low | 0.61% |
143 | 🇳🇮 Nicaragua | Low | 0.60% |
144 | 🇨🇻 Cape Verde | Low | 0.54% |
145 | 🇧🇯 Benin | Low | 0.54% |
146 | 🇲🇹 Malta | Low | 0.48% |
147 | 🇬🇹 Guatemala | Low | 0.45% |
148 | 🇬🇭 Ghana | Low | 0.43% |
149 | 🇵🇬 Papua New Guinea | Low | 0.38% |
150 | 🇲🇩 Moldova | Low | 0.36% |
151 | 🇮🇪 Ireland | Low | 0.27% |
152 | 🇿🇼 Zimbabwe | Low | 0.26% |
153 | 🇻🇪 Venezuela | Low | 0.20% |
154 | 🇭🇹 Haiti | Low | 0.17% |
155 | 🇲🇺 Mauritius | Low | 0.16% |
156 | 🇨🇷 Costa Rica | Low | 0.00% |
157 | 🇮🇸 Iceland | Low | 0.00% |
158 | 🇵🇦 Panama | Low | 0.00% |
The medium group consists of 44 countries and is led by four nations (Jordan, Armenia, Azerbaijan, and Lebanon) that all spend more than 4% of their GDP on their militaries. Other familiar countries known to have large military budgets, like Russia, Pakistan, the U.S., India and the UK, are also in this category.
The low spend group has a total of 107 countries, but also contains some surprises. For example, China, France, and Germany—all in the top 10 countries by absolute military spend—actually have similar amounts of military spend as a percent of GDP as Georgia, Cyprus, and North Macedonia respectively.
At the bottom of the table are countries with either low military importance, or strange technicalities. For example, Mauritius is one of the countries with the lowest military budgets because it doesn’t officially have a standing military, instead relying on two paramilitary forces (a special mobile force and a Coast Guard).
Similarly, Iceland allocates 0% of its GDP towards military spending. In place of a standing army, the country maintains a specialized peacekeeping force, a substantial Coast Guard, and relies on security alliances within NATO, of which it is a member and provides financial support to.
Ranking Defense Spending Per Capita
While the measure above equalizes military spend on economic strength, per-capita military spending shows how much countries allocate while accounting for population size.
On a per-capita basis (again using a five-year average), Qatar leads the ranks with a per-capita spend of $4,564, well-ahead of Israel at $2,535, and Saudi Arabia at $1,928.
Rank | Country | Per Capita Spend ($) |
---|---|---|
1 | 🇶🇦 Qatar | $4,564 |
2 | 🇮🇱 Israel | $2,535 |
3 | 🇸🇦 Saudi Arabia | $1,928 |
4 | 🇸🇬 Singapore | $1,837 |
5 | 🇰🇼 Kuwait | $1,815 |
6 | 🇺🇸 U.S. | $1,815 |
7 | 🇳🇴 Norway | $1,438 |
8 | 🇴🇲 Oman | $1,254 |
9 | 🇦🇺 Australia | $1,131 |
10 | 🇧🇳 Brunei | $959 |
11 | 🇬🇧 UK | $913 |
12 | 🇰🇷 South Korea | $894 |
13 | 🇧🇭 Bahrain | $863 |
14 | 🇩🇰 Denmark | $861 |
15 | 🇫🇷 France | $811 |
16 | 🇫🇮 Finland | $801 |
17 | 🇳🇱 Netherlands | $765 |
18 | 🇱🇺 Luxembourg | $694 |
19 | 🇸🇪 Sweden | $662 |
20 | 🇨🇭 Switzerland | $647 |
21 | 🇨🇦 Canada | $645 |
22 | 🇬🇷 Greece | $629 |
23 | 🇩🇪 Germany | $623 |
24 | 🇳🇿 New Zealand | $610 |
25 | 🇪🇪 Estonia | $535 |
26 | 🇹🇼 Taiwan | $495 |
27 | 🇮🇹 Italy | $494 |
28 | 🇧🇪 Belgium | $487 |
29 | 🇷🇺 Russia | $467 |
30 | 🇱🇹 Lithuania | $463 |
31 | 🇵🇹 Portugal | $417 |
32 | 🇱🇻 Latvia | $405 |
33 | 🇨🇾 Cyprus | $399 |
34 | 🇯🇵 Japan | $398 |
35 | 🇪🇸 Spain | $395 |
36 | 🇦🇹 Austria | $393 |
37 | 🇵🇱 Poland | $359 |
38 | 🇺🇾 Uruguay | $354 |
39 | 🇸🇰 Slovakia | $334 |
40 | 🇱🇧 Lebanon | $334 |
41 | 🇸🇮 Slovenia | $302 |
42 | 🇺🇦 Ukraine | $302 |
43 | 🇭🇷 Croatia | $294 |
44 | 🇨🇱 Chile | $292 |
45 | 🇷🇴 Romania | $258 |
46 | 🇭🇺 Hungary | $248 |
47 | 🇮🇪 Ireland | $235 |
48 | 🇸🇨 Seychelles | $230 |
49 | 🇦🇿 Azerbaijan | $226 |
50 | 🇩🇿 Algeria | $219 |
51 | 🇦🇲 Armenia | $217 |
52 | 🇧🇼 Botswana | $215 |
53 | 🇯🇴 Jordan | $207 |
54 | 🇹🇷 Turkey | $199 |
55 | 🇨🇴 Colombia | $197 |
56 | 🇧🇬 Bulgaria | $194 |
57 | 🇨🇳 China | $183 |
58 | 🇲🇹 Malta | $175 |
59 | 🇨🇿 Czech Republic | $175 |
60 | 🇮🇷 Iran | $169 |
61 | 🇳🇦 Namibia | $159 |
62 | 🇮🇶 Iraq | $145 |
63 | 🇪🇨 Ecuador | $138 |
64 | 🇲🇪 Montenegro | $137 |
65 | 🇷🇸 Serbia | $133 |
66 | 🇹🇹 Trinidad & Tobago | $131 |
67 | 🇬🇦 Gabon | $124 |
68 | 🇲🇦 Morocco | $122 |
69 | 🇬🇶 Equatorial Guinea | $112 |
70 | 🇲🇾 Malaysia | $109 |
71 | 🇧🇷 Brazil | $107 |
72 | 🇹🇭 Thailand | $97 |
73 | 🇬🇾 Guyana | $92 |
74 | 🇹🇳 Tunisia | $91 |
75 | 🇫🇯 Fiji | $83 |
76 | 🇲🇰 North Macedonia | $83 |
77 | 🇰🇿 Kazakhstan | $82 |
78 | 🇵🇪 Peru | $81 |
79 | 🇬🇪 Georgia | $80 |
80 | 🇧🇾 Belarus | $80 |
81 | 🇯🇲 Jamaica | $77 |
82 | 🇦🇱 Albania | $76 |
83 | 🇸🇿 Eswatini | $72 |
84 | 🇱🇰 Sri Lanka | $69 |
85 | 🇦🇷 Argentina | $66 |
86 | 🇧🇿 Belize | $60 |
87 | 🇲🇽 Mexico | $59 |
88 | 🇩🇴 Dominican Republic | $58 |
89 | 🇻🇳 Viet Nam | $58 |
90 | 🇿🇦 South Africa | $56 |
91 | 🇸🇻 El Salvador | $54 |
92 | 🇧🇦 Bosnia and Herzegovina | $54 |
93 | 🇮🇳 India | $53 |
94 | 🇨🇬 Republic of Congo | $53 |
95 | 🇵🇾 Paraguay | $52 |
96 | 🇧🇴 Bolivia | $51 |
97 | 🇵🇰 Pakistan | $49 |
98 | 🇺🇿 Uzbekistan | $44 |
99 | 🇦🇴 Angola | $43 |
100 | 🇽🇰 Kosovo | $42 |
101 | 🇲🇷 Mauritania | $42 |
102 | 🇭🇳 Honduras | $42 |
103 | 🇪🇬 Egypt | $41 |
104 | 🇰🇭 Cambodia | $36 |
105 | 🇲🇲 Myanmar | $35 |
106 | 🇵🇭 Philippines | $33 |
107 | 🇲🇳 Mongolia | $33 |
108 | 🇮🇩 Indonesia | $31 |
109 | 🇧🇩 Bangladesh | $27 |
110 | 🇹🇱 Timor Leste | $27 |
111 | 🇲🇱 Mali | $26 |
112 | 🇸🇳 Senegal | $24 |
113 | 🇨🇮 Cote d'Ivoire | $23 |
114 | 🇹🇬 Togo | $21 |
115 | 🇰🇪 Kenya | $21 |
116 | 🇰🇬 Kyrgyzstan | $20 |
117 | 🇧🇫 Burkina Faso | $20 |
118 | 🇬🇳 Guinea | $19 |
119 | 🇱🇸 Lesotho | $19 |
120 | 🇨🇻 Cape Verde | $19 |
121 | 🇬🇹 Guatemala | $19 |
122 | 🇹🇩 Chad | $18 |
123 | 🇸🇸 South Sudan | $18 |
124 | 🇸🇩 Sudan | $18 |
125 | 🇺🇬 Uganda | $18 |
126 | 🇿🇼 Zimbabwe | $17 |
127 | 🇿🇲 Zambia | $16 |
128 | 🇲🇺 Mauritius | $16 |
129 | 🇨🇲 Cameroon | $16 |
130 | 🇳🇵 Nepal | $15 |
131 | 🇳🇬 Nigeria | $14 |
132 | 🇳🇮 Nicaragua | $12 |
133 | 🇬🇼 Guinea-Bissau | $12 |
134 | 🇹🇿 Tanzania | $12 |
135 | 🇨🇺 Cuba | $11 |
136 | 🇷🇼 Rwanda | $11 |
137 | 🇲🇩 Moldova | $11 |
138 | 🇵🇬 Papua New Guinea | $10 |
139 | 🇳🇪 Niger | $10 |
140 | 🇹🇯 Tajikistan | $9 |
141 | 🇨🇫 Central African Republic | $8 |
142 | 🇲🇿 Mozambique | $8 |
143 | 🇬🇭 Ghana | $8 |
144 | 🇧🇯 Benin | $7 |
145 | 🇧🇮 Burundi | $7 |
146 | 🇦🇫 Afghanistan | $6 |
147 | 🇬🇲 Gambia | $6 |
148 | 🇪🇹 Ethiopia | $5 |
149 | 🇻🇪 Venezuela | $5 |
150 | 🇲🇼 Malawi | $4 |
151 | 🇸🇱 Sierra Leone | $3 |
152 | 🇲🇬 Madagascar | $3 |
153 | 🇨🇩 Dem. Rep. of Congo | $3 |
154 | 🇱🇷 Liberia | $3 |
155 | 🇭🇹 Haiti | $2 |
156 | 🇨🇷 Costa Rica | $0 |
157 | 🇮🇸 Iceland | $0 |
158 | 🇵🇦 Panama | $0 |
Measured this way, we get a perspective of how small defense budgets can be per person, even if the total expenditure is large.
For example, India has the fourth-highest total defense expenditure in 2022, but because of its massive population only sets aside $53 per resident for its military, putting it solidly at the bottom third of the per-capita rankings.
Patterns Revealed By Measuring Military Spend
Changing how we look at a country’s military budget can reveal a lot more than just looking at absolute numbers.
For example, the Middle East is the region with the highest spenders on defense as a percentage of their GDP, giving us insight into regional security concerns.
Countries from the medium group of military spending—including parts of Eastern Europe, sub-Saharan Africa, and South Asia—highlight past or recent conflict zones between neighbors, countries with internal strife, or countries wary of a regional aggressor. Ukraine’s average per capita military spend, for example, was just $122.4 from 2018 to 2021. The next year, it jumped nearly 10 times to $1,018.66 per person after Russia’s invasion.
In fact, European military spending saw its sharpest one-year jump in 30 years as a direct result of the war.
Alongside European anxieties, ongoing tension between China and Taiwan has also contributed to increased military spending in Asia and Oceania. Will these budgets continue their dramatic ascent or will they rise evenly alongside their relative economies in 2023?
Data note: For these comparisons, the creator is calculating five-year averages (using data from 2018-2022) for military spending as a percentage of GDP and per-capita military spending for each country. The military expenditure data is pulled from Stockholm International Peace Research Institute.
Data for some countries is missing or may vary significantly from official figures. Countries with up to
two years of missing data had averages calculated on the years available, while countries with three or more years of missing data have been removed from this dataset, including: Djibouti, Eritrea, North Korea, Laos, Libya, Somalia, Syria, Turkmenistan, UAE, and Yemen.
Please see SIPRI’s methodologies page for more details on how they collect their data and create estimates.
-
Technology3 days ago
Ranked: America’s Largest Semiconductor Companies
-
Misc3 weeks ago
Ranked: The Cities with the Most Skyscrapers in 2023
-
Markets3 days ago
The Fastest Rising Asset Classes in 2023
-
Urbanization3 weeks ago
Ranked: The World’s Biggest Steel Producers, by Country
-
Markets2 days ago
Mapped: The State of Economic Freedom in 2023
-
Visual Capitalist2 weeks ago
Join Us For Data Creator Con 2023
-
Datastream14 hours ago
The 10 Longest Range EVs for 2023
-
AI4 weeks ago
Visualizing Global Attitudes Towards AI