Technology
Ranked: The Most Popular Websites Since 1993
The Most Popular Websites Since 1993
The internet has become an increasingly important part of our everyday lives.
While it’s hard to imagine modern life without Google or YouTube, it’s interesting to reflect on how much the web has changed over the last few decades.
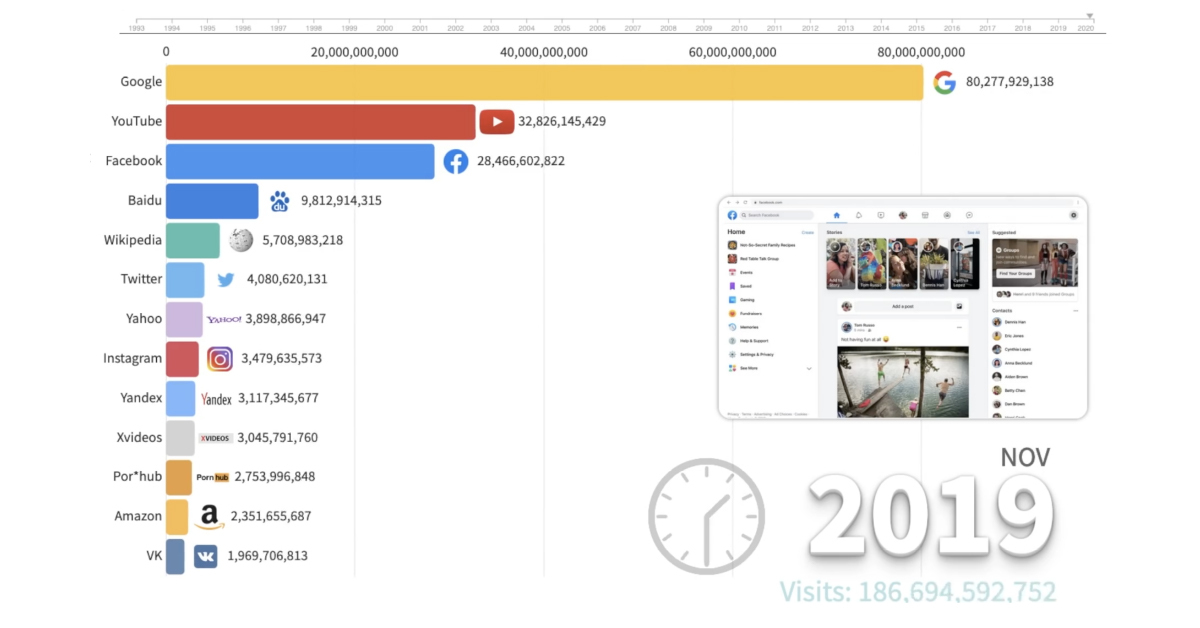
This animation by Captain Gizmo provides a historical rundown of the most popular websites since 1993, showing how much the internet has evolved since the early ’90s.
The Top Websites
While the web has changed drastically over the years, the top-ranking websites have remained relatively consistent. Here’s a look at the websites with the most traffic since 1993, and when each site held the number one spot:
| Date Range | Top Ranking Website | Highest Number of Monthly Visits |
|---|---|---|
| Jan 1993 - Jun 2000 | AOL | 405,000,000 |
| Jul 2000 - May 2006 | Yahoo | 5,500,000,000 |
| Jun 2006 - Jul 2008 | 8,300,000,000 |
|
| Aug 2008 - Jun 2010 | Yahoo | 11,600,000,000 |
| Jul 2010 - current | 81,000,000,000 |
*Note: Numbers rounded for clarity.
AOL
AOL was one of the first major web portals, back in the era of CD-ROMs and dial-up modems. In its heyday, the company dominated the market, largely due to an aggressive free trial campaign that cost millions (possibly even billions) of dollars to execute.
Despite the large investment, the campaign worked—at its peak, AOL had over 30 million users, and a market cap of over $200 billion. It was the most popular website online until the early 2000s, when broadband started to replace dial-up. As the sands shifted, AOL struggled to stay relevant and was eventually sold to Verizon for just $4.4 billion.
Yahoo
Following AOL’s downfall, Yahoo became the next internet giant.
Starting off as a web directory, Yahoo was the first website to offer localized indexes for major cities. At Yahoo’s zenith, it was worth $125 billion, but a series of missed opportunities and failed acquisitions meant that it could not keep up. Like AOL, Yahoo is now also owned by Verizon, but remains a top 10 website globally.
It’s no surprise that Google currently comes in at number one. It started out in the early ’90s as a university research project. Today, it’s become virtually synonymous with the internet, which makes sense, considering 90% of all internet searches are made on Google-owned properties.
Old School Search Engines
Prior to Google’s success, there were several other go-to search engines that paved the way for Google in many ways:
- WebCrawler: One of the earlier search engines, WebCrawler was the first search engine to enable full-text search. At one point, the website was so popular, it’s server would constantly crash, making it virtually unusable during peak hours.
- Lycos: This was another pivotal search engine, created in 1994 (a year before Yahoo). Lycos was the first of its kind to incorporate relevance retrieval, prefix matching, and word proximity.
- Infoseek: As Netscape’s default search engine, Infoseek was popular during the web browser’s heyday. Eventually, Infoseek was purchased by Disney and rebranded to go.com.
Unlike Infoseek, Lycos and WebCrawler have somehow managed to stick around—both companies still exist today. Of course, they’re nowhere near comparable to Google in terms of revenue or daily search volume.
The Evolution of Social Media
Unless you are a Gen Zer, you probably remember MySpace. Like Lycos and WebCrawler, MySpace technically still exists, although it’s certainly not the high traffic site it used to be.
Created in 2004, MySpace became a hub for musicians and music fans on the web. In just a year, the website saw massive growth, and by 2005, it was acquired by News Corp. MySpace continued to dominate the social media landscape until 2008, when Facebook took over as the internet’s most popular social media platform.
Facebook’s story is well-known at this point. The Zuckerberg-led creation was a social networking site that was exclusive to Harvard students, but it soon opened up to dozens of other universities and then finally the general public in 2006. Just two years later, and the site had 100 million active users, rising to the top of the social media spectrum.
Although Facebook often finds itself mired in controversy today, the site remains the world’s most popular social media platform on the internet with close to 3 billion users.
What’s Next?
It’s hard to predict what the future holds for Facebook, or for any of the other websites currently dominating the web.
If anything is clear from the above animation, it’s that the list of the world’s most popular websites is constantly shifting—and only time will tell what the next few decades will bring.


Technology
Ranked: Semiconductor Companies by Industry Revenue Share
Nvidia is coming for Intel’s crown. Samsung is losing ground. AI is transforming the space. We break down revenue for semiconductor companies.


Semiconductor Companies by Industry Revenue Share
This was originally posted on our Voronoi app. Download the app for free on Apple or Android and discover incredible data-driven charts from a variety of trusted sources.
Did you know that some computer chips are now retailing for the price of a new BMW?
As computers invade nearly every sphere of life, so too have the chips that power them, raising the revenues of the businesses dedicated to designing them.
But how did various chipmakers measure against each other last year?
We rank the biggest semiconductor companies by their percentage share of the industry’s revenues in 2023, using data from Omdia research.
Which Chip Company Made the Most Money in 2023?
Market leader and industry-defining veteran Intel still holds the crown for the most revenue in the sector, crossing $50 billion in 2023, or 10% of the broader industry’s topline.
All is not well at Intel, however, with the company’s stock price down over 20% year-to-date after it revealed billion-dollar losses in its foundry business.
| Rank | Company | 2023 Revenue | % of Industry Revenue |
|---|---|---|---|
| 1 | Intel | $51B | 9.4% |
| 2 | NVIDIA | $49B | 9.0% |
| 3 | Samsung Electronics | $44B | 8.1% |
| 4 | Qualcomm | $31B | 5.7% |
| 5 | Broadcom | $28B | 5.2% |
| 6 | SK Hynix | $24B | 4.4% |
| 7 | AMD | $22B | 4.1% |
| 8 | Apple | $19B | 3.4% |
| 9 | Infineon Tech | $17B | 3.2% |
| 10 | STMicroelectronics | $17B | 3.2% |
| 11 | Texas Instruments | $17B | 3.1% |
| 12 | Micron Technology | $16B | 2.9% |
| 13 | MediaTek | $14B | 2.6% |
| 14 | NXP | $13B | 2.4% |
| 15 | Analog Devices | $12B | 2.2% |
| 16 | Renesas Electronics Corporation | $11B | 1.9% |
| 17 | Sony Semiconductor Solutions Corporation | $10B | 1.9% |
| 18 | Microchip Technology | $8B | 1.5% |
| 19 | Onsemi | $8B | 1.4% |
| 20 | KIOXIA Corporation | $7B | 1.3% |
| N/A | Others | $126B | 23.2% |
| N/A | Total | $545B | 100% |
Note: Figures are rounded. Totals and percentages may not sum to 100.
Meanwhile, Nvidia is very close to overtaking Intel, after declaring $49 billion of topline revenue for 2023. This is more than double its 2022 revenue ($21 billion), increasing its share of industry revenues to 9%.
Nvidia’s meteoric rise has gotten a huge thumbs-up from investors. It became a trillion dollar stock last year, and broke the single-day gain record for market capitalization this year.
Other chipmakers haven’t been as successful. Out of the top 20 semiconductor companies by revenue, 12 did not match their 2022 revenues, including big names like Intel, Samsung, and AMD.
The Many Different Types of Chipmakers
All of these companies may belong to the same industry, but they don’t focus on the same niche.
According to Investopedia, there are four major types of chips, depending on their functionality: microprocessors, memory chips, standard chips, and complex systems on a chip.
Nvidia’s core business was once GPUs for computers (graphics processing units), but in recent years this has drastically shifted towards microprocessors for analytics and AI.
These specialized chips seem to be where the majority of growth is occurring within the sector. For example, companies that are largely in the memory segment—Samsung, SK Hynix, and Micron Technology—saw peak revenues in the mid-2010s.

-

 Mining2 weeks ago
Charted: The Value Gap Between the Gold Price and Gold Miners
-

 Real Estate1 week ago
Ranked: The Most Valuable Housing Markets in America
-

 Business1 week ago
Charted: Big Four Market Share by S&P 500 Audits
-

 AI1 week ago
The Stock Performance of U.S. Chipmakers So Far in 2024
-

 Misc1 week ago
Almost Every EV Stock is Down After Q1 2024
-

 Money2 weeks ago
Where Does One U.S. Tax Dollar Go?
-

 Green2 weeks ago
Ranked: Top Countries by Total Forest Loss Since 2001
-

 Real Estate2 weeks ago
Visualizing America’s Shortage of Affordable Homes