Misc
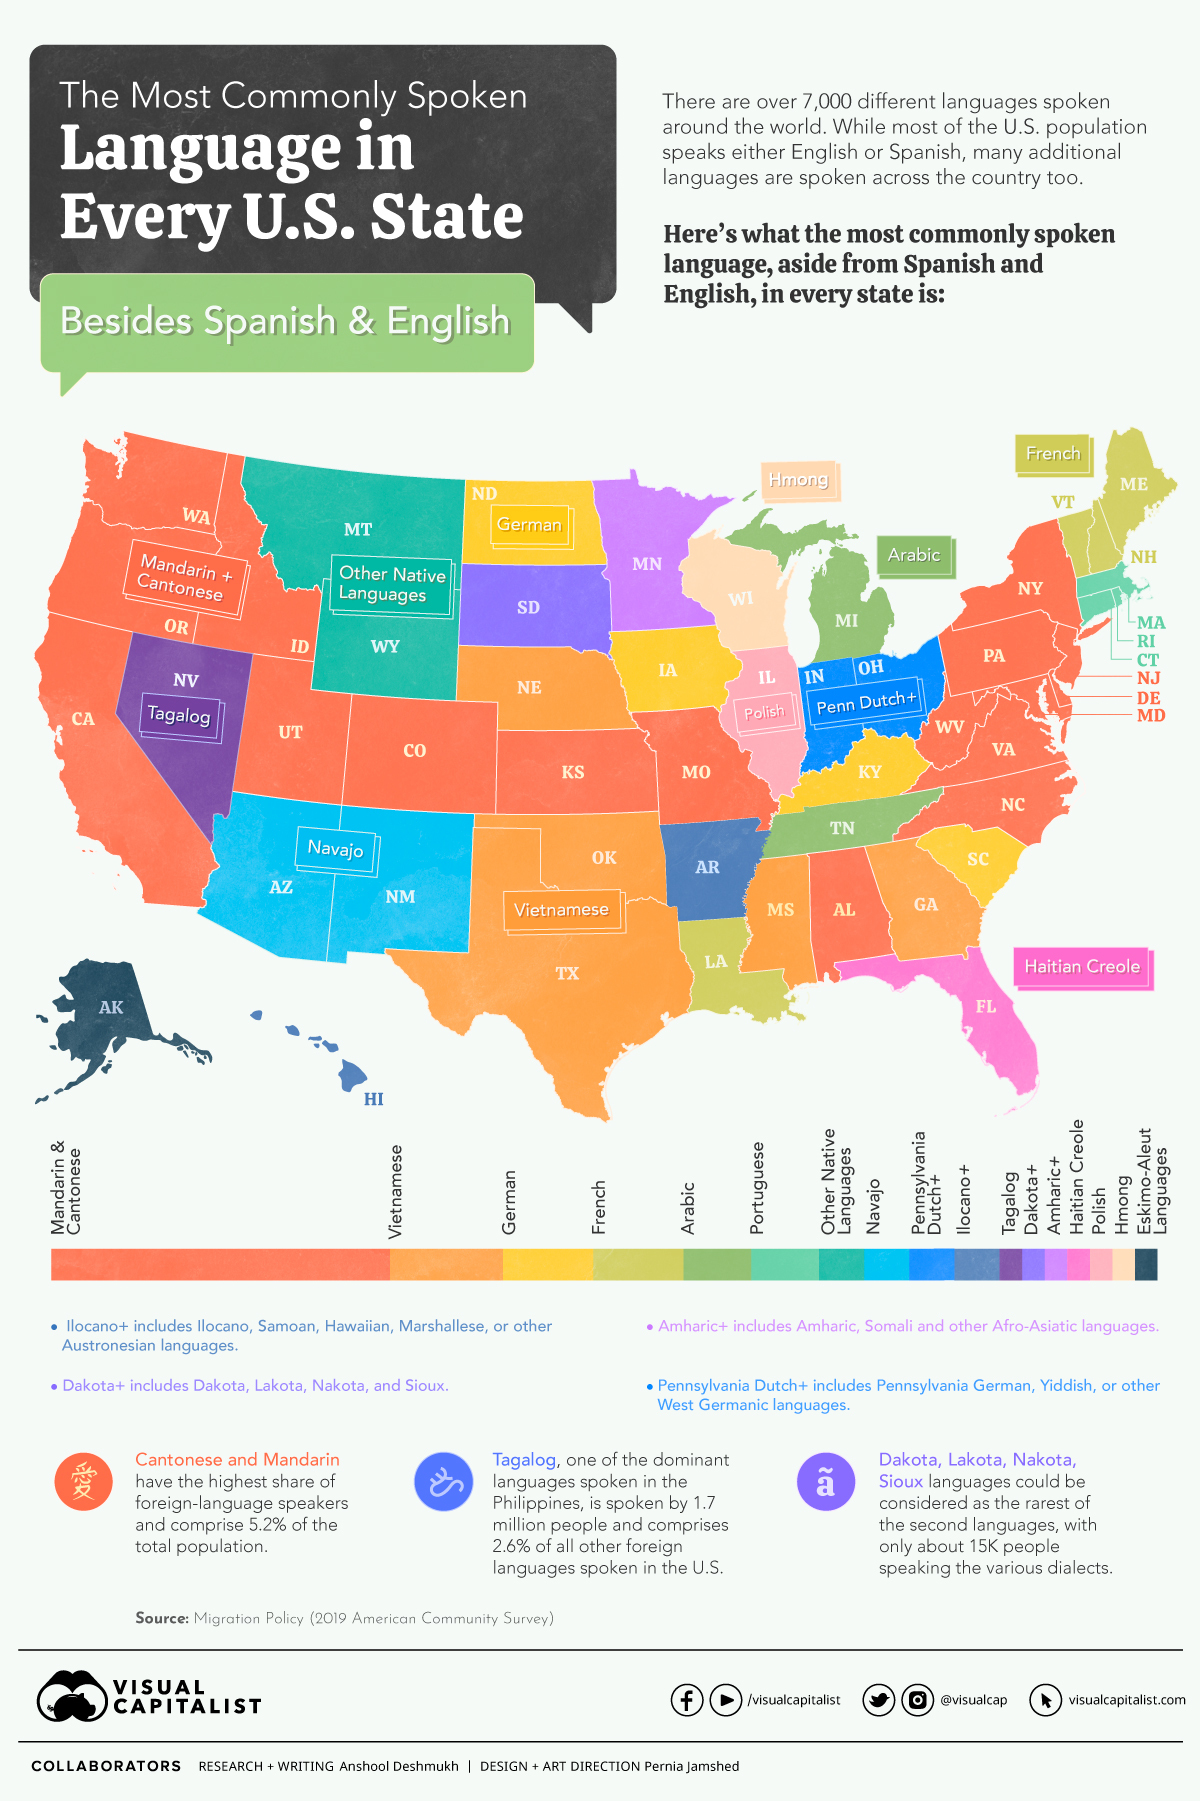
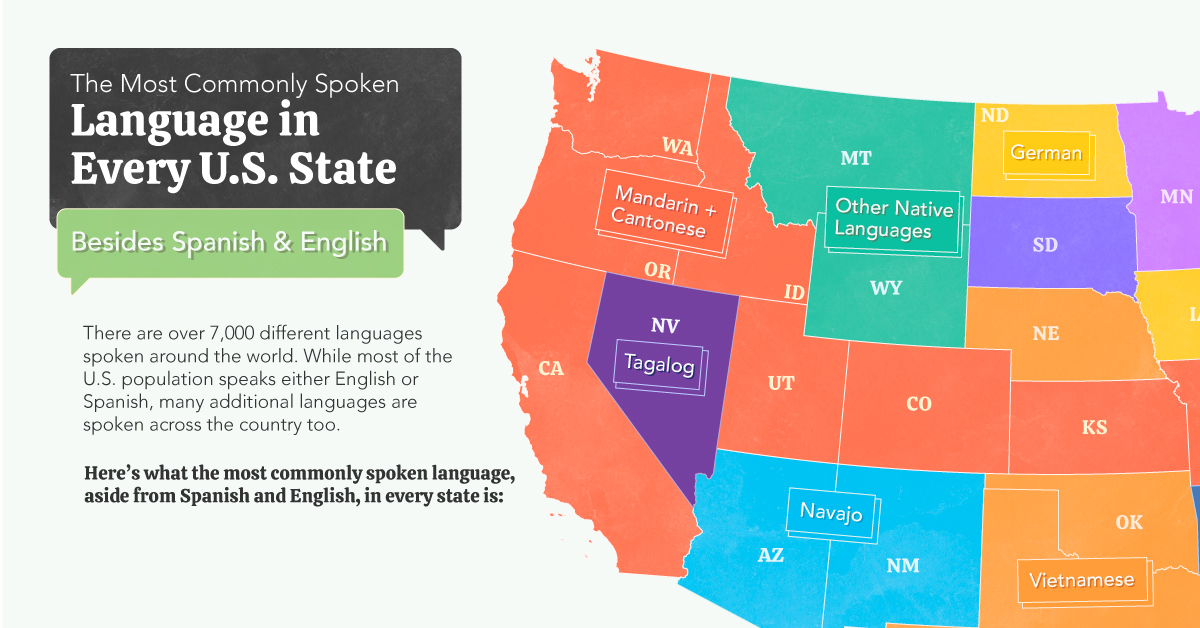
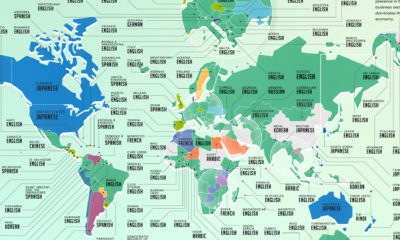
The Most Commonly Spoken Language in Every U.S. State (Besides English and Spanish)


The Most Common Spoken Household Languages
We typically operate under the assumption that most Americans speak either English or Spanish. Though this is true in the broadest sense, the U.S. is a culturally diverse country, home to a plethora of languages.
The U.S. Census Bureau’s American Community Survey (ACS) annually asks more than 1 million Americans questions about their lives, families, and backgrounds. One question asks respondents what language they mainly speak in their homes.
Migration Policy has used this data (while excluding English and Spanish) to leave us with the next-most-frequently spoken languages at home in each state.
Non-English Languages in the U.S.
In 2019, approximately 78% (241 million) of all 308.8 million people ages five and older reported speaking only English at home regardless of their nativity. The remaining 22% (67.8 million) reported speaking a language other than English at home.
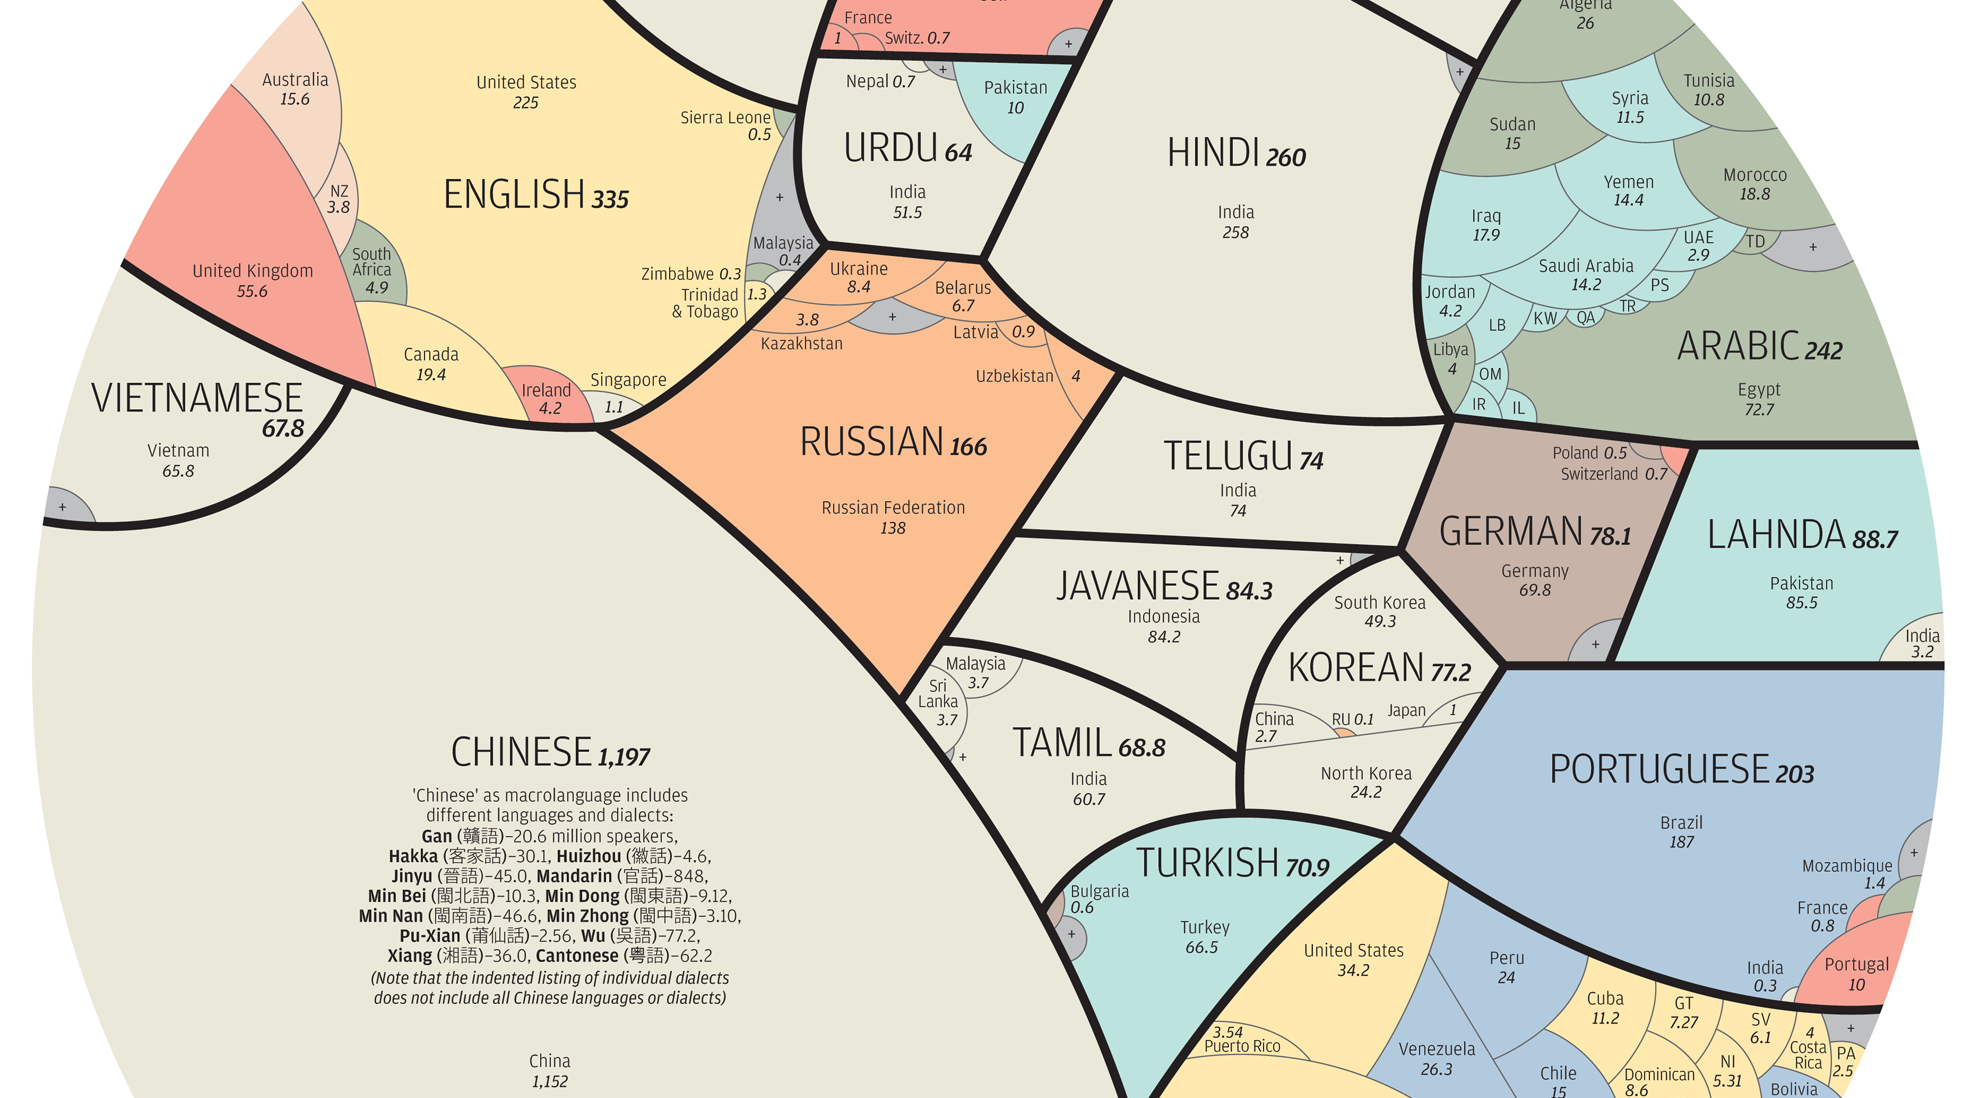
Based on this data, Mandarin and Cantonese were the most common non-English, non-Spanish languages spoken in the U.S., with more than 3.4 million speakers across the country.
Here is a list of the most common languages spoken at home in the U.S., outside of English:
| Language | Population Estimate | Share of Foreign Language Speakers |
|---|---|---|
| Spanish | 41,757,000 | 61.6% |
| Cantonese and Mandarin | 3,495,000 | 5.2% |
| Tagalog | 1,764,000 | 2.6% |
| Vietnamese | 1,571,000 | 2.3% |
| Arabic | 1,260,000 | 1.9% |
| French and Louisiana French | 1,172,000 | 1.7% |
| Korean | 1,075,000 | 1.6% |
| Russian | 941,000 | 1.4% |
| Haitian Creole | 925,000 | 1.4% |
| German | 895,000 | 1.3% |
| Hindi | 893,000 | 1.3% |
| Portuguese | 846,000 | 1.2% |
| Afro-Asiatic Languages | 590,000 | 0.9% |
| West African Languages | 589,000 | 0.9% |
| Indo-European Languages | 576,000 | 0.8% |
| West Germanic Languages | 560,000 | 0.8% |
| Italian | 540,000 | 0.8% |
Tagalog is the second most commonly spoken language in American households (after English/Spanish) with 1.7 million speakers, even though it only reaches top spot in Nevada. Unsurprisingly, Louisiana and states bordering eastern Canada have a healthy number of French speakers.
Further analysis of these common languages reveals a fascinating story. Here’s a breakdown of the top 5 most commonly spoken second languages (excluding English and Spanish), and the states where they’re spoken.
1. Cantonese and Mandarin
Estimated number of speakers nationally: 3,495,000
Number of states where it’s the most common: 17
States that most commonly speak the language: California, Washington, Oregon, Idaho, Utah, Colorado, Kansas, Missouri, Alabama, New York, Pennsylvania, Virginia, West Virginia, North Carolina, New Jersey, Delaware and Maryland.
Chinese immigrants have been coming to America in large numbers since the mid-19th century, when the California Gold Rush compelled them to cross the Pacific Ocean. Today, there are over 5 million Chinese Americans across the country.
2. Tagalog
Estimated number of speakers nationally: 1,764,000
Number of states where it’s the most common: 1
States that most commonly speak the language: Nevada
Immigrants from the Philippines started coming to America in large numbers by the turn of the 19th century, but it wasn’t until 1965 that both skilled and educated workers came by the thousands. Today, there are over 4 million Filipino Americans.
3. Vietnamese
Estimated number of speakers nationally: 1,571,000
Number of states where it’s the most common: 5
States that most commonly speak the language: Nebraska, Oklahoma, Texas, Mississippi and Georgia.
South Vietnamese immigration to the U.S. began right after the Vietnam War ended in 1975, and more Vietnamese people have been arriving ever since. Today, over half of all Vietnamese-Americans live in either California or Texas.
4. Arabic
Estimated number of speakers nationally: 1,260,000
Number of states where it’s the most common: 2
States that most commonly speak the language: Michigan and Tennessee
Michigan alone has over 140,000 Arabic speakers. California has over 190,000 speakers. Pew Research Center noted that Arabic is the fastest-growing language in the U.S., with speakers growing by 29% from 2010 to 2014.
5. French
Estimated number of speakers nationally: 1,172,000
Number of states where it’s the most common: 4
States that most commonly speak the language: Louisiana, Maine, Vermont and New Hampshire.
After the Louisiana Purchase, French evolved from its original form, creating Louisiana French which also borrows words from English, Spanish, Native American, and African languages. To this day, it’s still spoken by around 175,000 people in Louisiana and Texas.
The United States: A Multilingual Country
Although English, in all its diversity, is unquestionably the country’s dominant national language, the U.S. has always had a complex multilingual history. Long before European settlers colonized North and South America, thousands of indigenous languages thrived from coast to coast. Today, some Indigenous languages are making a comeback as many states acknowledge their importance in the history and culture of the country.
With each new wave of immigrants residing in the country from every part of the globe, the linguistic and cultural diversity of the United States is growing.
The U.S. has one of the largest Chinese populations outside China, a demographic shift that may increase in the coming years. Spanish is now the most popular second language of the country.
America is home to the largest population of English speakers in the world, but bilingualism has been on the rise in the country for decades – a trend that shows no signs of letting up.


Misc
How Hard Is It to Get Into an Ivy League School?
We detail the admission rates and average annual cost for Ivy League schools, as well as the median SAT scores required to be accepted.


How Hard Is It to Get Into an Ivy League School?
This was originally posted on our Voronoi app. Download the app for free on iOS or Android and discover incredible data-driven charts from a variety of trusted sources.
Ivy League institutions are renowned worldwide for their academic excellence and long-standing traditions. But how hard is it to get into one of the top universities in the U.S.?
In this graphic, we detail the admission rates and average annual cost for Ivy League schools, as well as the median SAT scores required to be accepted. The data comes from the National Center for Education Statistics and was compiled by 24/7 Wall St.
Note that “average annual cost” represents the net price a student pays after subtracting the average value of grants and/or scholarships received.
Harvard is the Most Selective
The SAT is a standardized test commonly used for college admissions in the United States. It’s taken by high school juniors and seniors to assess their readiness for college-level academic work.
When comparing SAT scores, Harvard and Dartmouth are among the most challenging universities to gain admission to. The median SAT scores for their students are 760 for reading and writing and 790 for math. Still, Harvard has half the admission rate (3.2%) compared to Dartmouth (6.4%).
| School | Admission rate (%) | SAT Score: Reading & Writing | SAT Score: Math | Avg Annual Cost* |
|---|---|---|---|---|
| Harvard University | 3.2 | 760 | 790 | $13,259 |
| Columbia University | 3.9 | 750 | 780 | $12,836 |
| Yale University | 4.6 | 760 | 780 | $16,341 |
| Brown University | 5.1 | 760 | 780 | $26,308 |
| Princeton University | 5.7 | 760 | 780 | $11,080 |
| Dartmouth College | 6.4 | 760 | 790 | $33,023 |
| University of Pennsylvania | 6.5 | 750 | 790 | $14,851 |
| Cornell University | 7.5 | 750 | 780 | $29,011 |
*Costs after receiving federal financial aid.
Additionally, Dartmouth has the highest average annual cost at $33,000. Princeton has the lowest at $11,100.
While student debt has surged in the United States in recent years, hitting $1.73 trillion in 2023, the worth of obtaining a degree from any of the schools listed surpasses mere academics. This is evidenced by the substantial incomes earned by former students.
Harvard grads, for example, have the highest average starting salary in the country, at $91,700.

-

 Maps2 weeks ago
Mapped: Average Wages Across Europe
-

 Money1 week ago
Which States Have the Highest Minimum Wage in America?
-

 Real Estate1 week ago
Ranked: The Most Valuable Housing Markets in America
-

 Markets1 week ago
Charted: Big Four Market Share by S&P 500 Audits
-

 AI1 week ago
The Stock Performance of U.S. Chipmakers So Far in 2024
-

 Automotive2 weeks ago
Almost Every EV Stock is Down After Q1 2024
-

 Money2 weeks ago
Where Does One U.S. Tax Dollar Go?
-

 Green2 weeks ago
Ranked: Top Countries by Total Forest Loss Since 2001