Mining
The Mineral Exploration Roadmap

Mineral Exploration Roadmap
There is nothing more exciting than making some type of discovery.
Discoveries can come in many forms – they can be physical, scientific, personal, or even philosophical in nature. But while there are different types of discoveries that can be made, perhaps the most tactile kind of discovery is in the field of mineral exploration.
The discovery of a mineral deposit can transform a piece of “moose pasture” into a new economic asset, and it may enable millions or billions of dollars worth of metals and minerals to be used for human purposes.
These minerals get used all around us – they go into our houses, cars, infrastructure, jewelry, electronics, and they can even be used to power the green revolution.
From Prospecting to Production
Making an economic mineral discovery is the goal of many teams around the world, but these efforts can also be extremely difficult, costly, and time-consuming, and most companies engaged in exploration end up walking away empty-handed.
Today’s infographic comes to us from Orix Geoscience and it shows the steps of mineral exploration, and how teams can maximize their odds of success by using data to add value throughout the process.
Steps of the Mineral Exploration Process
1. Exploration Strategy
Where do you choose to explore? There are two basic strategies:
(a) Working from the known
Deposits tend to form in clusters in prolific belts, and exploration occurs outward from known mineralization.
(b) Working from the unknown
If you review all available information, prospective areas with potential for discoveries can be identified.
2. Prospecting
In this stage, boots are now on the ground – and it’s time to explore the backwoods for showings. Prospectors will stake claims, map outcrops and showings, and search for indicator minerals.
The goal of the prospecting stage is to find the earliest piece of the exploration puzzle: the clue that there is something much bigger beneath.
3. Early-Stage Exploration
Congrats, you’ve found something interesting – and now it’s time to ramp up exploration efforts!
This is where the amount of data and sophistication picks up. In this stage, companies are using existing maps and historical data, geophysics, ground truthing, geochemistry, and trenching to try and identify drill targets.
4. The “Truth Machine”
Geologists don’t call the drill a “truth machine” for nothing.
If you’re target hits, you’re in business. If your target misses, it’s time to go back a step and find new ones.
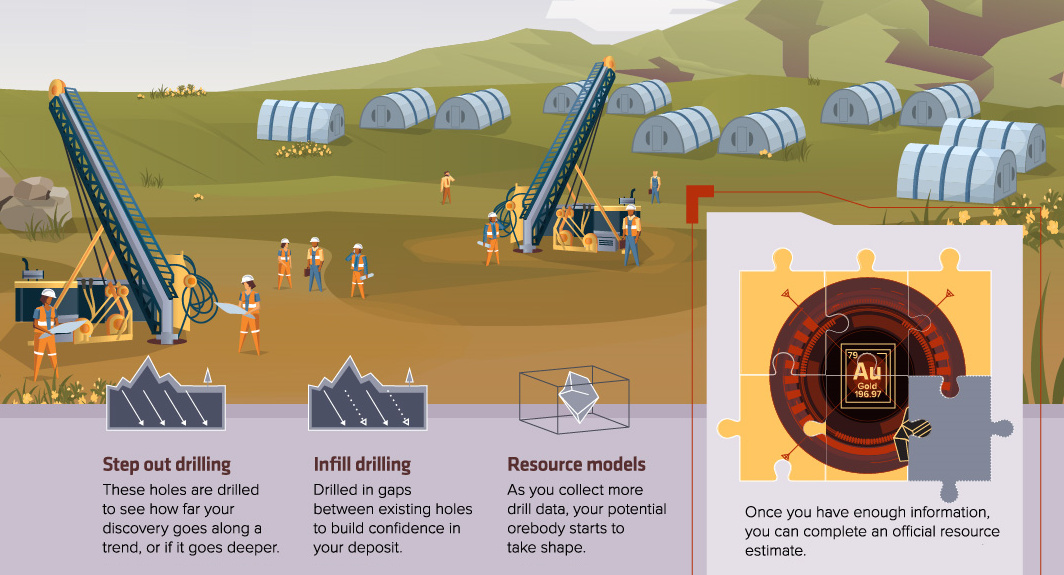
5. Discovery
Eureka! You’ve found something. Now it’s time to see how far the mineralization goes!
Once you have enough information, you can get an official resource estimate. This data is another puzzle piece that will be crucial as you advance your discovery.
6. De-risking
Even at the best of times, mining can be expensive, risky, and tricky.
That’s why your investors and backers will want you to source even more data – it’ll allow you to see a clearer picture of the deposit, and help your team see how it could take shape as a mine.
At this stage, drilling, metallurgical tests, environmental assessments, 3d models, and mine designs are used to increase confidence in the project.
Data starts to get very granular. Your company may do a Preliminary Economic Assessment (PEA) to assess the potential economic outcomes of a mine. Then after, they may conduct an in-depth Feasibility Study to help make a production decision.
Final Steps
By this point, you may have all the puzzle pieces – a clear vision of the deposit and its potential – to make a decision!
If the puzzle looks good, it’s time to make a production decision, construct the mine, and start commercial production. But the data doesn’t stop there – at these later stages, even more data gets created and it can help you make better decisions.


Copper
Brass Rods: The Secure Choice
This graphic shows why brass rods are the secure choice for precision-machined and forged parts.


Brass Rods: The Secure Choice
The unique combination of machinability and recyclability makes brass rods the secure choice for manufacturers seeking future-proof raw material solutions.
This infographic, from the Copper Development Association, shows three ways brass rods give manufacturers greater control and a license to grow in the competitive market for precision-machined and forged products.
Future-Proof Investments in New Machine Tools
A material’s machinability directly impacts machine throughput, which typically has the largest impact on machine shop profitability.
The high-speed machining capabilities of brass rods maximize machine tool performance, allowing manufacturers to run the material faster and longer without sacrificing tool life, chip formation, or surface quality.
The high machining efficiency of brass leads to reduced per-part costs, quicker return on investment (ROI) for new machine tools, and expanded production capacity for new projects.
Supply Security Through Closed Loop Recycling
Brass, like its parent element copper, can be infinitely recycled.
In 2022, brass- and wire-rod mills accounted for the majority of the 830,000 tonnes of copper recycled from scrap in the United States.
Given that scrap ratios for machined parts typically range from 60-70% by weight, producing mills benefit from a secure and steady supply of clean scrap returned directly from customers, which is recycled to create new brass rods.
The high residual value of brass scrap creates a strong recycling incentive. Scrap buy back programs give manufacturers greater control over raw material net costs as scrap value is often factored into supplier purchase agreements.
Next Generation Alloys for a Lead-Free Future
Increasingly stringent global regulations continue to pressure manufacturers to minimize the use of materials containing trace amounts of lead and other harmful impurities.
The latest generation of brass-rod alloys is engineered to meet the most demanding criteria for lead leaching in drinking water and other sensitive applications.
Seven brass-rod alloys passed rigorous testing to become the only ‘Acceptable Materials’ against lower lead leaching criteria recently adopted in the national U.S. drinking water quality standard, NSF 61.
Learn more about the advantages of brass rods solutions.

-

 Base Metals1 year ago
Ranked: The World’s Largest Copper Producers
Many new technologies critical to the energy transition rely on copper. Here are the world’s largest copper producers.
-

 Silver2 years ago
Mapped: Solar Power by Country in 2021
In 2020, solar power saw its largest-ever annual capacity expansion at 127 gigawatts. Here’s a snapshot of solar power capacity by country.
-

 Batteries5 years ago
Visualizing Copper’s Role in the Transition to Clean Energy
A clean energy transition is underway as wind, solar, and batteries take center stage. Here’s how copper plays the critical role in these technologies.
-

 Science5 years ago
Everything You Need to Know on VMS Deposits
Deep below the ocean’s waves, VMS deposits spew out massive amounts of minerals like copper, zinc, and gold, making them a key source of the metals…
-
 Copper5 years ago
How Much Copper is in an Electric Vehicle?
Have you ever wondered how much copper is in an electric vehicle? This infographic shows the metal’s properties as well as the quantity of copper used.
-
 Copper6 years ago
Copper: Driving the Green Energy Revolution
Renewable energy is set to fuel a new era of copper demand – here’s how much copper is used in green applications from EVs to photovoltaics.


-

 Real Estate2 weeks ago
Visualizing America’s Shortage of Affordable Homes
-

 Technology1 week ago
Ranked: Semiconductor Companies by Industry Revenue Share
-

 Money2 weeks ago
Which States Have the Highest Minimum Wage in America?
-

 Real Estate2 weeks ago
Ranked: The Most Valuable Housing Markets in America
-

 Business2 weeks ago
Charted: Big Four Market Share by S&P 500 Audits
-

 AI2 weeks ago
The Stock Performance of U.S. Chipmakers So Far in 2024
-

 Misc2 weeks ago
Almost Every EV Stock is Down After Q1 2024
-

 Money2 weeks ago
Where Does One U.S. Tax Dollar Go?