Technology
How Many Millions of Lines of Code Does It Take?
How Many Millions of Lines of Code Does It Take?
Today’s data visualization comes from David McCandless from Information is Beautiful. Buy their awesome book called Knowledge is Beautiful – we own the physical version, and it’s full of great data visualizations.
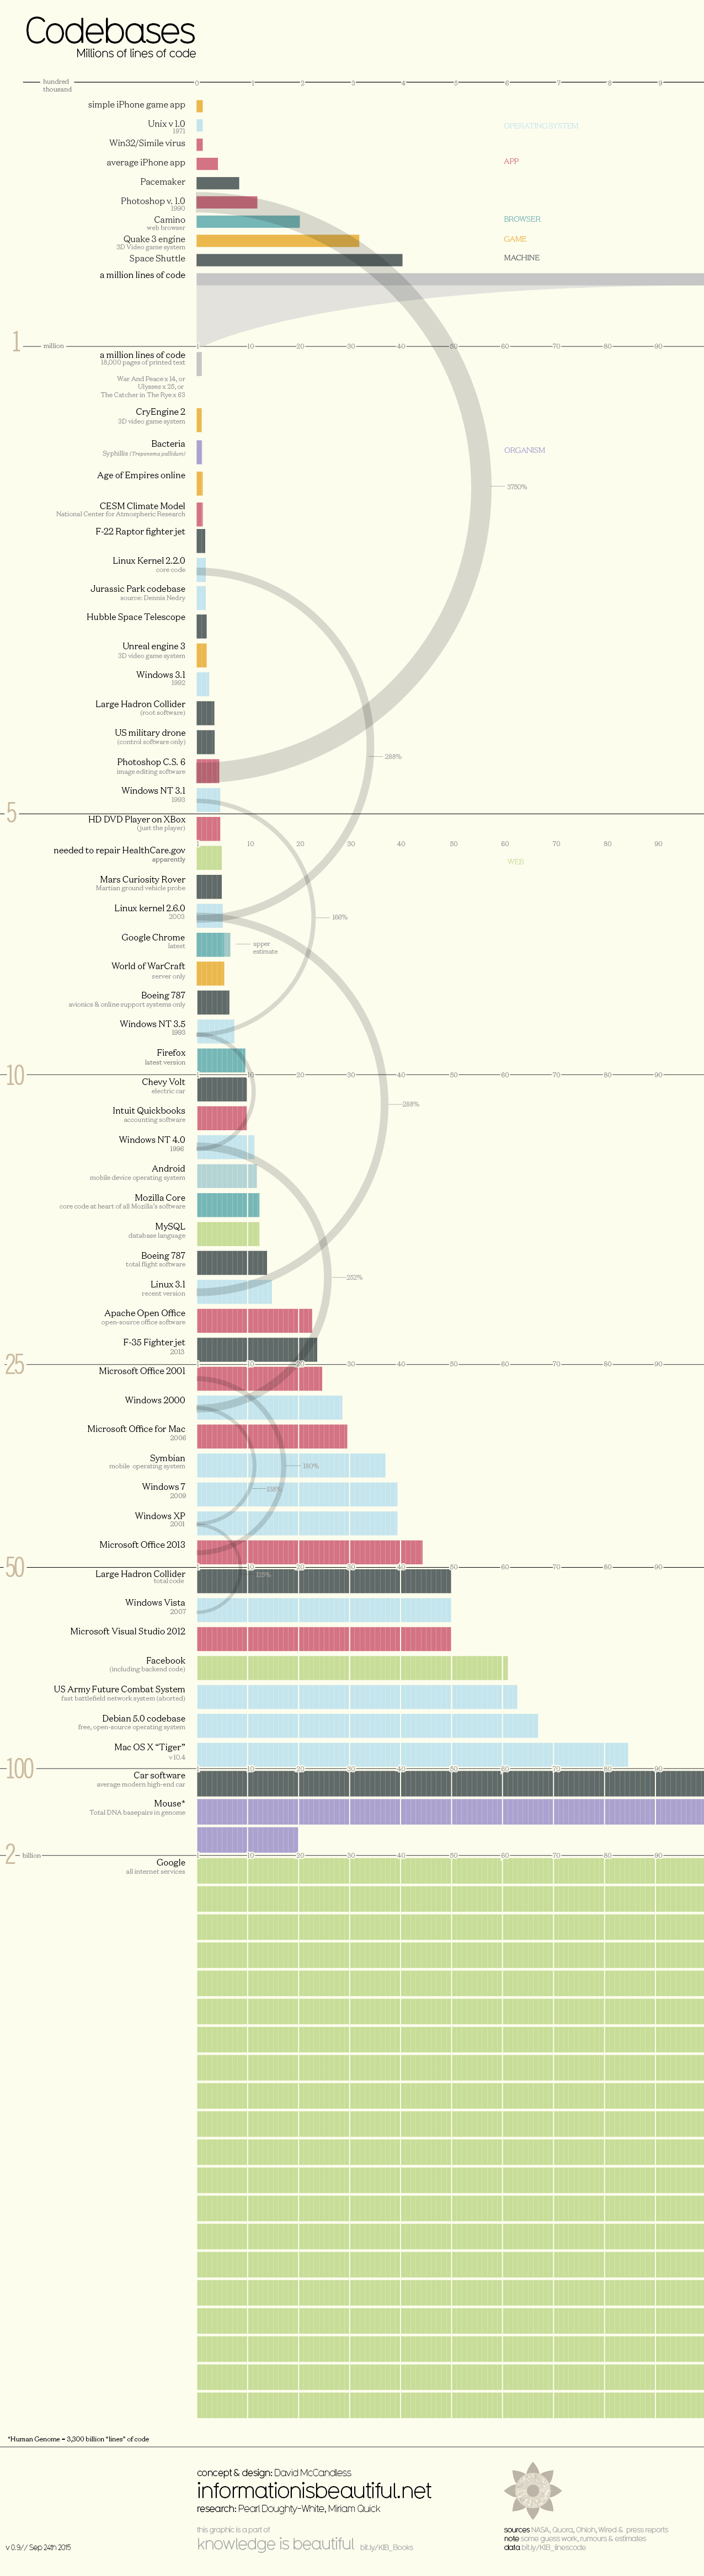
How many millions of lines of code does it take to make the modern program, web service, car, or airplane possible?
The range is extraordinary: the average iPhone app has less than 50,000 lines of code, while Google’s entire code base is two billion lines for all services. And interestingly, the code behind machines such as fighter jets, popular video game engines, and even the Large Hadron Collider fall somewhere in between these two extremes.
Increasing Complexity
A million lines of code, if printed, would be about 18,000 pages of text. That’s 14x the length of War and Peace.
It’s more than what was needed to run old technologies like the Space Shuttle, a pacemaker, or even the game engine of Quake 3 – but it’s not enough to be the driving force behind the modern software that’s used in everyday life today.
- The control software to run a U.S. military drone uses 3.5 million lines of code.
- A Boeing 787 has 6.5 million lines behind its avionics and online support systems.
- Google Chrome (browser) runs on 6.7 million lines of code (upper estimate).
- A Chevy Volt uses 10 million lines.
- The Android operating system runs on 12-15 million lines.
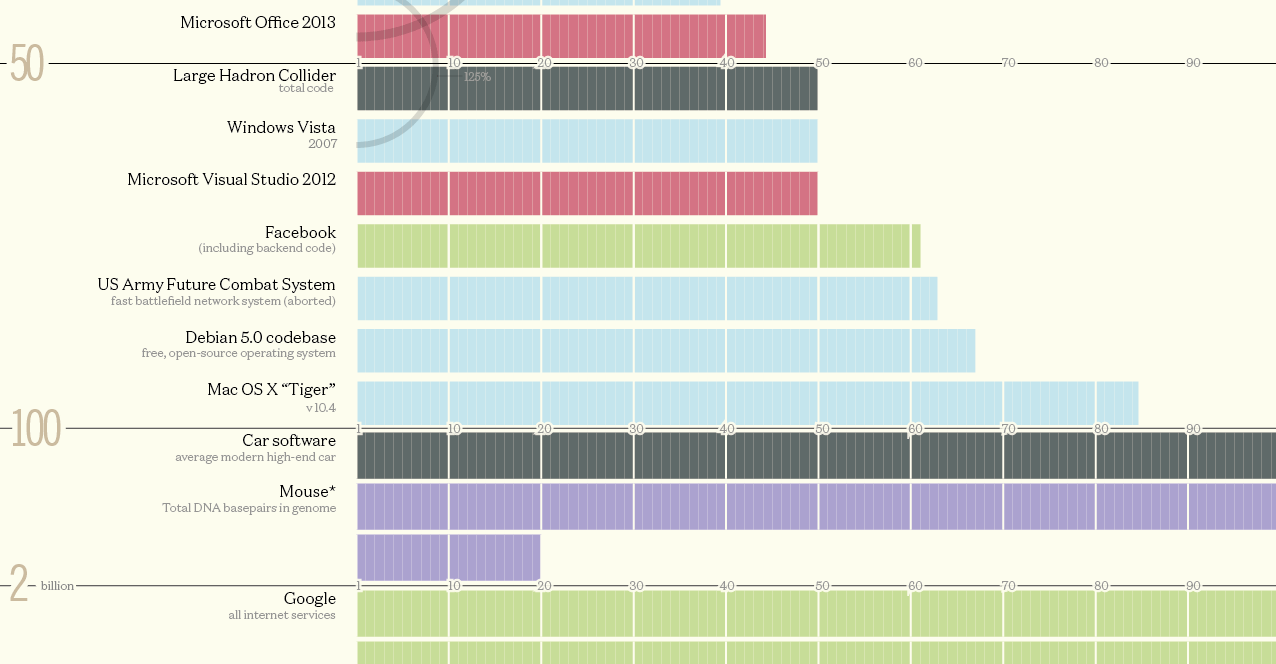
- The Large Hadron Collider uses 50 million lines.
- Not including backend code, Facebook runs on 62 million lines of code.
- With the advent of sophisticated, cloud-connected infotainment systems, the car software in a modern vehicle apparently uses 100 million lines of code. This is according to Wired magazine.
- All Google services combine for a whopping 2 billion lines.
Applying the math above – that means it would take 36,000,000 pages to “print out” all of the code behind all Google services. That would be a stack of paper 2.2 mi (3.6 km) high!


Technology
Visualizing AI Patents by Country
See which countries have been granted the most AI patents each year, from 2012 to 2022.


Visualizing AI Patents by Country
This was originally posted on our Voronoi app. Download the app for free on iOS or Android and discover incredible data-driven charts from a variety of trusted sources.
This infographic shows the number of AI-related patents granted each year from 2010 to 2022 (latest data available). These figures come from the Center for Security and Emerging Technology (CSET), accessed via Stanford University’s 2024 AI Index Report.
From this data, we can see that China first overtook the U.S. in 2013. Since then, the country has seen enormous growth in the number of AI patents granted each year.
| Year | China | EU and UK | U.S. | RoW | Global Total |
|---|---|---|---|---|---|
| 2010 | 307 | 137 | 984 | 571 | 1,999 |
| 2011 | 516 | 129 | 980 | 581 | 2,206 |
| 2012 | 926 | 112 | 950 | 660 | 2,648 |
| 2013 | 1,035 | 91 | 970 | 627 | 2,723 |
| 2014 | 1,278 | 97 | 1,078 | 667 | 3,120 |
| 2015 | 1,721 | 110 | 1,135 | 539 | 3,505 |
| 2016 | 1,621 | 128 | 1,298 | 714 | 3,761 |
| 2017 | 2,428 | 144 | 1,489 | 1,075 | 5,136 |
| 2018 | 4,741 | 155 | 1,674 | 1,574 | 8,144 |
| 2019 | 9,530 | 322 | 3,211 | 2,720 | 15,783 |
| 2020 | 13,071 | 406 | 5,441 | 4,455 | 23,373 |
| 2021 | 21,907 | 623 | 8,219 | 7,519 | 38,268 |
| 2022 | 35,315 | 1,173 | 12,077 | 13,699 | 62,264 |
In 2022, China was granted more patents than every other country combined.
While this suggests that the country is very active in researching the field of artificial intelligence, it doesn’t necessarily mean that China is the farthest in terms of capability.
Key Facts About AI Patents
According to CSET, AI patents relate to mathematical relationships and algorithms, which are considered abstract ideas under patent law. They can also have different meaning, depending on where they are filed.
In the U.S., AI patenting is concentrated amongst large companies including IBM, Microsoft, and Google. On the other hand, AI patenting in China is more distributed across government organizations, universities, and tech firms (e.g. Tencent).
In terms of focus area, China’s patents are typically related to computer vision, a field of AI that enables computers and systems to interpret visual data and inputs. Meanwhile America’s efforts are more evenly distributed across research fields.
Learn More About AI From Visual Capitalist
If you want to see more data visualizations on artificial intelligence, check out this graphic that shows which job departments will be impacted by AI the most.

-

 Markets1 week ago
U.S. Debt Interest Payments Reach $1 Trillion
-

 Business2 weeks ago
Charted: Big Four Market Share by S&P 500 Audits
-

 Real Estate2 weeks ago
Ranked: The Most Valuable Housing Markets in America
-

 Money2 weeks ago
Which States Have the Highest Minimum Wage in America?
-

 AI2 weeks ago
Ranked: Semiconductor Companies by Industry Revenue Share
-

 Markets2 weeks ago
Ranked: The World’s Top Flight Routes, by Revenue
-

 Demographics2 weeks ago
Population Projections: The World’s 6 Largest Countries in 2075
-

 Markets2 weeks ago
The Top 10 States by Real GDP Growth in 2023