Personal Finance
Millennials Making More Happen With Less [Chart]
![Millennials Spending Habits [Chart]](https://www.visualcapitalist.com/wp-content/uploads/2016/05/millennial-spending-chart.png)
Millennials Making More Happen With Less [Chart]
Recent survey sheds light on millennial spending habits
The Chart of the Week is a weekly Visual Capitalist feature on Fridays.
Despite the Western world’s general shift towards healthier eating, it may surprise you to learn that McDonald’s shares traded at all-time highs just days ago.
How is this possible?
Part of the reason is that although millennials will tell you otherwise, the name of the game for courting many millennials is still convenience. Price points at a restaurant such as McDonald’s still have wide appeal to a cash-strapped generation.
Based on a recent survey by TD Bank, the convenience trend is still on track. Here’s what we learned on millennial spending habits from the results.
Getting More out of Less
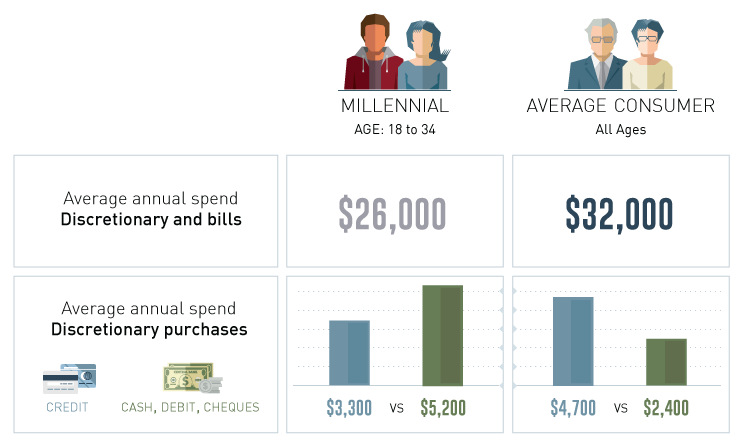
A major finding of the survey was that although millennials “go out” twice as often as Generation X and three times as often as Baby Boomers, they spend less per month on purchases than their older cohorts.
Millennials made more purchases on retail goods and dining than other generations, but spent less money overall. In fact, the only category where Millennials spent more than Gen X and Boomers is on coffee and fast food – demonstrating a need for food on the run and frequent doses of caffeine.
The average millennial went out 13 times each month, spending $103 for an average of $7.90 per transaction. This compares with nine trips with $122 of spend ($17 per transaction) for the average consumer.
The same was the case for grabbing “coffee and food on-the-go”, where millennials said that they went on more trips than the average consumer. Millennials also spent a higher total than others, spending $80 over 11 trips (compared with $67 over eight for the average consumer).
Experiences vs. Material Items
While the survey paints a picture of millennial thriftiness, we also think that there is another lens that can be used to shed light on the results. In particular, we believe this shows that the value that millennials place on having experiences.
To many millennials, “going out” is as much about the experience as the material food itself. Whether it is connecting with old friends at a new thin-crust pizzeria or trying a locally-roasted single-origin coffee with a significant other, it’s often more about sharing an experience with good company. It doesn’t have to be a fancy dinner or involve a $100 bottle of wine purchase to count as quality time.
This could be a partial reason behind a higher frequency of trips out, even though less money gets spent overall.
Cash vs. Credit
A final point of interest from the survey lies in the difference in how millennials make discretionary purchases.
On average, Americans spend $4,700 per year with a credit card, and $2,400 with cash, a debit card and checks for discretionary purchases. Millennials tend to use cash, a debit card and checks more often ($5,200) and charge 22% less ($3,300) than the average consumer
Millennials, many of whom grew up during the Financial Crisis, are more averse to debt. This is corroborated by the results of a different survey showing that seven out of 10 millennials say they would prefer to use a debit card, rather than a credit card, for their purchases.
It’s also an attitude that we’ve covered in a previous chart of the week, where we showed that only 37% of millennials were confident in managing their credit, while 70% of millennials hold their savings and investments in cash.


Personal Finance
Chart: The Declining Value of the U.S. Federal Minimum Wage
This graphic compares the nominal vs. inflation-adjusted value of the U.S. minimum wage, from 1940 to 2023.


The Declining Value of the U.S. Federal Minimum Wage
This was originally posted on our Voronoi app. Download the app for free on iOS or Android and discover incredible data-driven charts from a variety of trusted sources.
This graphic illustrates the history of the U.S. federal minimum wage using data compiled by Statista, in both nominal and real (inflation-adjusted) terms. The federal minimum wage was raised to $7.25 per hour in July 2009, where it has remained ever since.
Nominal vs. Real Value
The data we used to create this graphic can be found in the table below.
| Year | Nominal value ($/hour) | Real value ($/hour) |
|---|---|---|
| 1940 | 0.3 | 6.5 |
| 1945 | 0.4 | 6.82 |
| 1950 | 0.75 | 9.64 |
| 1955 | 0.75 | 8.52 |
| 1960 | 1 | 10.28 |
| 1965 | 1.25 | 12.08 |
| 1970 | 1.6 | 12.61 |
| 1975 | 2.1 | 12.04 |
| 1980 | 3.1 | 11.61 |
| 1985 | 3.35 | 9.51 |
| 1990 | 3.8 | 8.94 |
| 1995 | 4.25 | 8.49 |
| 2000 | 5.15 | 9.12 |
| 2005 | 5.15 | 8.03 |
| 2010 | 7.25 | 10.09 |
| 2015 | 7.25 | 9.3 |
| 2018 | 7.25 | 8.78 |
| 2019 | 7.25 | 8.61 |
| 2020 | 7.25 | 8.58 |
| 2021 | 7.25 | 8.24 |
| 2022 | 7.25 | 7.61 |
| 2023 | 7.25 | 7.25 |
What our graphic shows is how inflation has eroded the real value of the U.S. minimum wage over time, despite nominal increases.
For instance, consider the year 1960, when the federal minimum wage was $1 per hour. After accounting for inflation, this would be worth around $10.28 today!
The two lines converge at 2023 because the nominal and real value are identical in present day terms.
Many States Have Their Own Minimum Wage
According to the National Conference of State Legislatures (NCSL), 30 states and Washington, D.C. have implemented a minimum wage that is higher than $7.25.
The following states have adopted the federal minimum: Georgia, Idaho, Indiana, Iowa, Kansas, Kentucky, New Hampshire, North Carolina, North Dakota, Oklahoma, Pennsylvania, Texas, Utah, Wisconsin, and Wyoming.
Meanwhile, the states of Alabama, Louisiana, Mississippi, South Carolina, and Tennessee have no wage minimums, but have to follow the federal minimum.
How Does the U.S. Minimum Wage Rank Globally?
If you found this topic interesting, check out Mapped: Minimum Wage Around the World to see which countries have the highest minimum wage in monthly terms, as of January 2023.

-

 Real Estate2 weeks ago
Visualizing America’s Shortage of Affordable Homes
-

 Technology1 week ago
Ranked: Semiconductor Companies by Industry Revenue Share
-

 Money1 week ago
Which States Have the Highest Minimum Wage in America?
-

 Real Estate1 week ago
Ranked: The Most Valuable Housing Markets in America
-

 Business1 week ago
Charted: Big Four Market Share by S&P 500 Audits
-

 AI1 week ago
The Stock Performance of U.S. Chipmakers So Far in 2024
-

 Misc2 weeks ago
Almost Every EV Stock is Down After Q1 2024
-

 Money2 weeks ago
Where Does One U.S. Tax Dollar Go?