Markets
The Megacity Economy: How Seven Types of Global Cities Stack Up
Megacity Economy: How Seven Types of Global Cities Stack Up
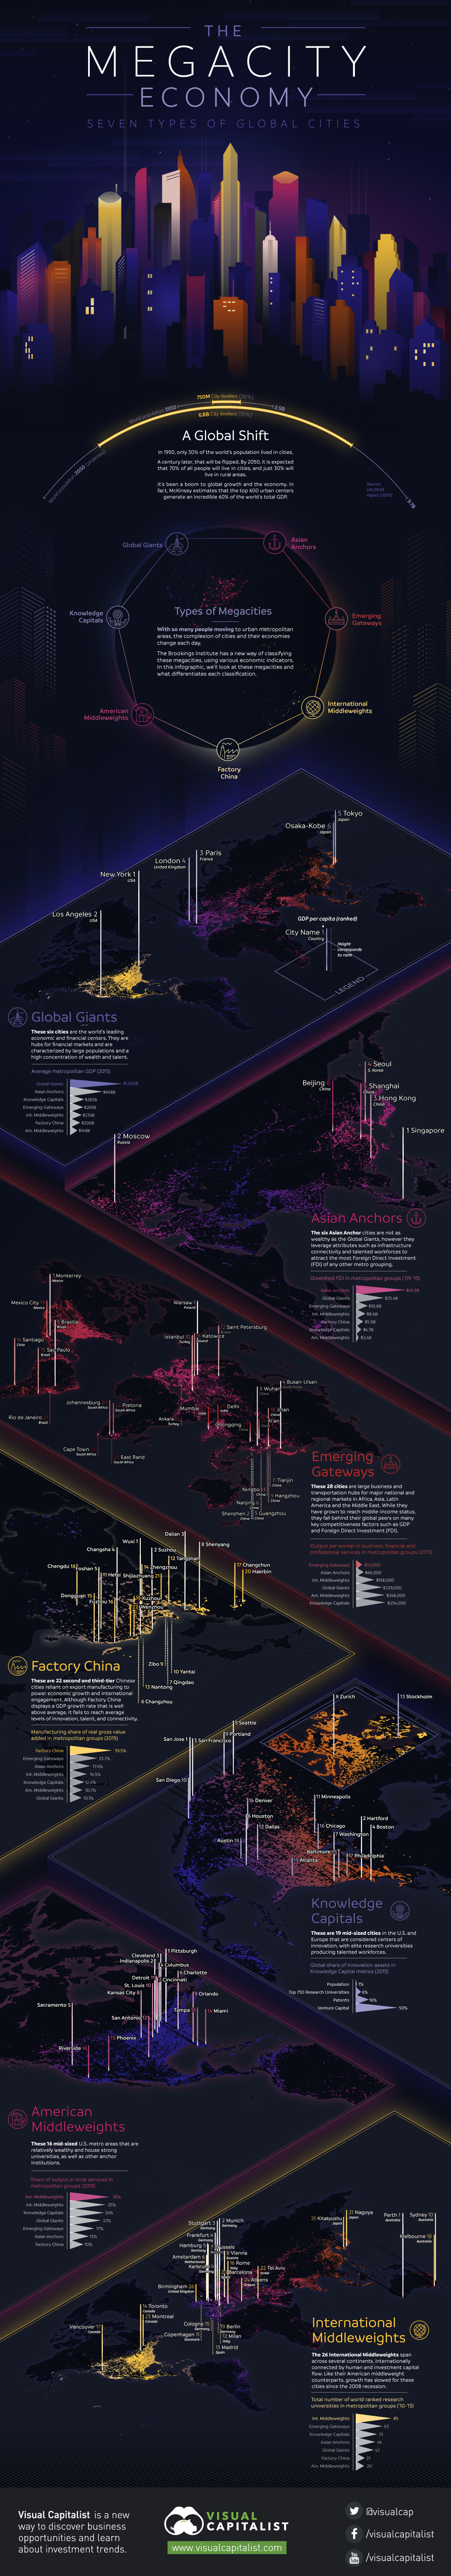
Back in 1950, close to 30% of the global population lived in cities.
That since has shifted dramatically. By 2050, a whopping 70% of people will live in urban areas – some of which will be megacities housing tens of millions of people.
This trend of urbanization has been a boon to global growth and the economy. In fact, it is estimated today by McKinsey that the 600 top urban centers contribute a whopping 60% to the world’s total GDP.
Seven Types of Global Cities
With so many people moving to urban metropolitan areas, the complexion of cities and their economies change each day.
The Brookings Institute has a new way of classifying these megacities, using various economic indicators.
According to their analysis, here’s what differentiates the seven types of global cities:
Important note: This isn’t intended to be a “ranking” of cities. However, on the infographic, cities are sorted by GDP per capita within each typology, and given a number based on where they stand in terms of this metric. This is just intended to show how wealthy the average citizen is per city, and is not a broader indicator relating to the success or overall ranking of a city.
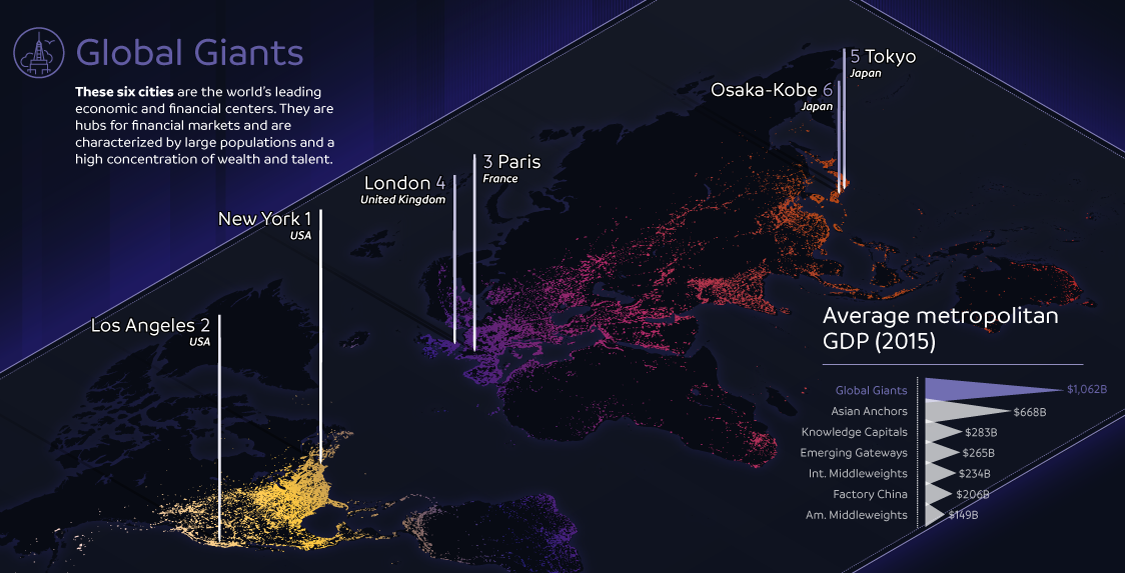
1. Global Giants
These six cities are the world’s leading economic and financial centers. They are hubs for financial markets and are characterized by large populations and a high concentration of wealth and talent.
Examples: New York City, Tokyo, London
2. Asian Anchors
The six Asian Anchor cities are not as wealthy as the Global Giants, however they leverage attributes such as infrastructure connectivity and talented workforces to attract the most Foreign Direct Investment (FDI) out of any other metro grouping.
Examples: Hong Kong, Seoul, Singapore
3. Emerging Gateways
These 28 cities are large business and transportation hubs for major national and regional markets in Africa, Asia, Latin America, and the Middle East. While they have grown to reach middle-income status, they fall behind other global cities on many key competitiveness factors such as GDP and FDI.
Examples: Mumbai, Cape Town, Mexico City, Hangzhou
4. Factory China
There are 22 second and third-tier Chinese cities reliant on export manufacturing to power economic growth and international engagement. Although Factory China displays a GDP growth rate that is well above average, it fails to reach average levels of innovation, talent, and connectivity.
Examples: Shenyang, Changchun, Chengdu
5. Knowledge Capitals
These are 19 mid-sized cities in the U.S. and Europe that are considered centers of innovation, with elite research universities producing talented workforces.
Examples: San Francisco, Boston, Zurich
6. American Middleweights
These 16 mid-sized U.S. metro areas are relatively wealthy and house strong universities, as well as other anchor institutions.
Examples: Orlando, Sacramento, Phoenix
7. International Middleweights
These 26 cities span across several continents, internationally connected by human and investment capital flow. Like their American middleweight counterparts, growth has slowed for these cities since the 2008 recession.
Examples: Vancouver, Melbourne, Brussels, Tel Aviv


Economy
Economic Growth Forecasts for G7 and BRICS Countries in 2024
The IMF has released its economic growth forecasts for 2024. How do the G7 and BRICS countries compare?


G7 & BRICS Real GDP Growth Forecasts for 2024
The International Monetary Fund’s (IMF) has released its real gross domestic product (GDP) growth forecasts for 2024, and while global growth is projected to stay steady at 3.2%, various major nations are seeing declining forecasts.
This chart visualizes the 2024 real GDP growth forecasts using data from the IMF’s 2024 World Economic Outlook for G7 and BRICS member nations along with Saudi Arabia, which is still considering an invitation to join the bloc.
Get the Key Insights of the IMF’s World Economic Outlook
Want a visual breakdown of the insights from the IMF’s 2024 World Economic Outlook report?
This visual is part of a special dispatch of the key takeaways exclusively for VC+ members.
Get the full dispatch of charts by signing up to VC+.
Mixed Economic Growth Prospects for Major Nations in 2024
Economic growth projections by the IMF for major nations are mixed, with the majority of G7 and BRICS countries forecasted to have slower growth in 2024 compared to 2023.
Only three BRICS-invited or member countries, Saudi Arabia, the UAE, and South Africa, have higher projected real GDP growth rates in 2024 than last year.
| Group | Country | Real GDP Growth (2023) | Real GDP Growth (2024P) |
|---|---|---|---|
| G7 | 🇺🇸 U.S. | 2.5% | 2.7% |
| G7 | 🇨🇦 Canada | 1.1% | 1.2% |
| G7 | 🇯🇵 Japan | 1.9% | 0.9% |
| G7 | 🇫🇷 France | 0.9% | 0.7% |
| G7 | 🇮🇹 Italy | 0.9% | 0.7% |
| G7 | 🇬🇧 UK | 0.1% | 0.5% |
| G7 | 🇩🇪 Germany | -0.3% | 0.2% |
| BRICS | 🇮🇳 India | 7.8% | 6.8% |
| BRICS | 🇨🇳 China | 5.2% | 4.6% |
| BRICS | 🇦🇪 UAE | 3.4% | 3.5% |
| BRICS | 🇮🇷 Iran | 4.7% | 3.3% |
| BRICS | 🇷🇺 Russia | 3.6% | 3.2% |
| BRICS | 🇪🇬 Egypt | 3.8% | 3.0% |
| BRICS-invited | 🇸🇦 Saudi Arabia | -0.8% | 2.6% |
| BRICS | 🇧🇷 Brazil | 2.9% | 2.2% |
| BRICS | 🇿🇦 South Africa | 0.6% | 0.9% |
| BRICS | 🇪🇹 Ethiopia | 7.2% | 6.2% |
| 🌍 World | 3.2% | 3.2% |
China and India are forecasted to maintain relatively high growth rates in 2024 at 4.6% and 6.8% respectively, but compared to the previous year, China is growing 0.6 percentage points slower while India is an entire percentage point slower.
On the other hand, four G7 nations are set to grow faster than last year, which includes Germany making its comeback from its negative real GDP growth of -0.3% in 2023.
Faster Growth for BRICS than G7 Nations
Despite mostly lower growth forecasts in 2024 compared to 2023, BRICS nations still have a significantly higher average growth forecast at 3.6% compared to the G7 average of 1%.
While the G7 countries’ combined GDP is around $15 trillion greater than the BRICS nations, with continued higher growth rates and the potential to add more members, BRICS looks likely to overtake the G7 in economic size within two decades.
BRICS Expansion Stutters Before October 2024 Summit
BRICS’ recent expansion has stuttered slightly, as Argentina’s newly-elected president Javier Milei declined its invitation and Saudi Arabia clarified that the country is still considering its invitation and has not joined BRICS yet.
Even with these initial growing pains, South Africa’s Foreign Minister Naledi Pandor told reporters in February that 34 different countries have submitted applications to join the growing BRICS bloc.
Any changes to the group are likely to be announced leading up to or at the 2024 BRICS summit which takes place October 22-24 in Kazan, Russia.
Get the Full Analysis of the IMF’s Outlook on VC+
This visual is part of an exclusive special dispatch for VC+ members which breaks down the key takeaways from the IMF’s 2024 World Economic Outlook.
For the full set of charts and analysis, sign up for VC+.

-

 Markets1 week ago
U.S. Debt Interest Payments Reach $1 Trillion
-

 Business2 weeks ago
Charted: Big Four Market Share by S&P 500 Audits
-

 Real Estate2 weeks ago
Ranked: The Most Valuable Housing Markets in America
-

 Money2 weeks ago
Which States Have the Highest Minimum Wage in America?
-

 AI2 weeks ago
Ranked: Semiconductor Companies by Industry Revenue Share
-

 Markets2 weeks ago
Ranked: The World’s Top Flight Routes, by Revenue
-

 Demographics2 weeks ago
Population Projections: The World’s 6 Largest Countries in 2075
-

 Markets2 weeks ago
The Top 10 States by Real GDP Growth in 2023