Markets
The Megacity Economy: How Seven Types of Global Cities Stack Up
Megacity Economy: How Seven Types of Global Cities Stack Up
Back in 1950, close to 30% of the global population lived in cities.
That since has shifted dramatically. By 2050, a whopping 70% of people will live in urban areas – some of which will be megacities housing tens of millions of people.
This trend of urbanization has been a boon to global growth and the economy. In fact, it is estimated today by McKinsey that the 600 top urban centers contribute a whopping 60% to the world’s total GDP.
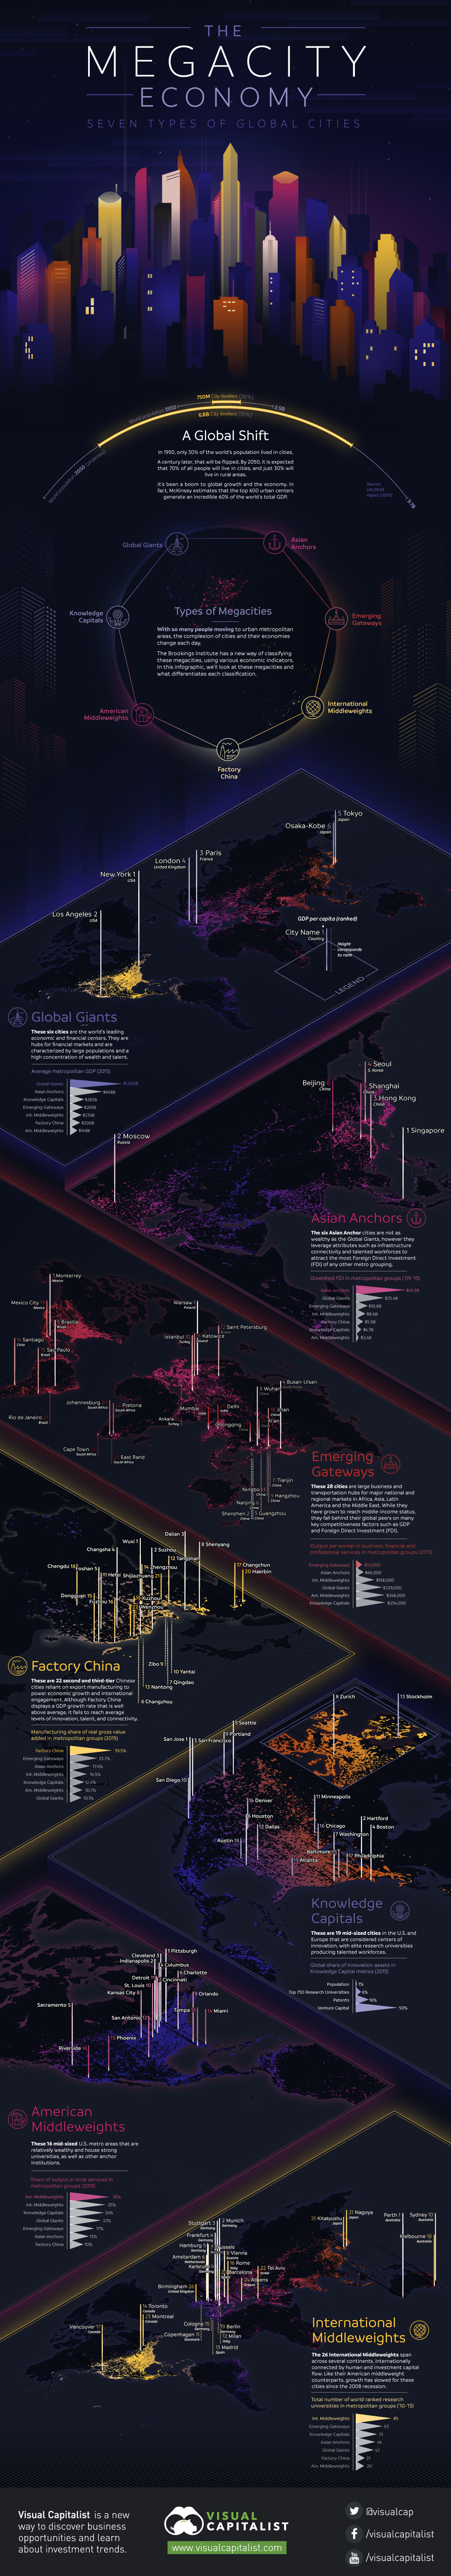
Seven Types of Global Cities
With so many people moving to urban metropolitan areas, the complexion of cities and their economies change each day.
The Brookings Institute has a new way of classifying these megacities, using various economic indicators.
According to their analysis, here’s what differentiates the seven types of global cities:
Important note: This isn’t intended to be a “ranking” of cities. However, on the infographic, cities are sorted by GDP per capita within each typology, and given a number based on where they stand in terms of this metric. This is just intended to show how wealthy the average citizen is per city, and is not a broader indicator relating to the success or overall ranking of a city.
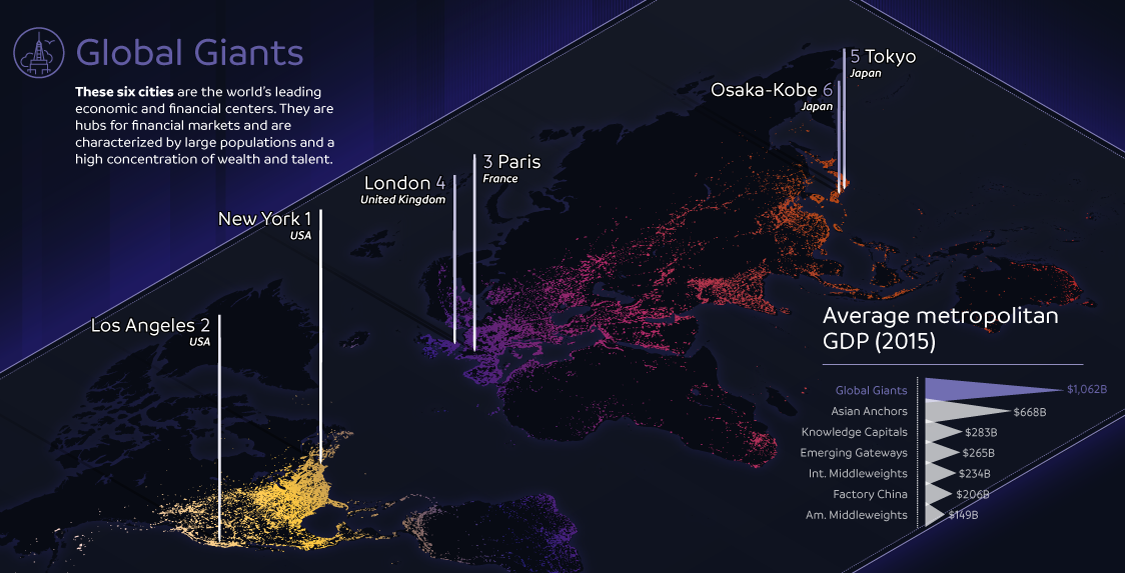
1. Global Giants
These six cities are the world’s leading economic and financial centers. They are hubs for financial markets and are characterized by large populations and a high concentration of wealth and talent.
Examples: New York City, Tokyo, London
2. Asian Anchors
The six Asian Anchor cities are not as wealthy as the Global Giants, however they leverage attributes such as infrastructure connectivity and talented workforces to attract the most Foreign Direct Investment (FDI) out of any other metro grouping.
Examples: Hong Kong, Seoul, Singapore
3. Emerging Gateways
These 28 cities are large business and transportation hubs for major national and regional markets in Africa, Asia, Latin America, and the Middle East. While they have grown to reach middle-income status, they fall behind other global cities on many key competitiveness factors such as GDP and FDI.
Examples: Mumbai, Cape Town, Mexico City, Hangzhou
4. Factory China
There are 22 second and third-tier Chinese cities reliant on export manufacturing to power economic growth and international engagement. Although Factory China displays a GDP growth rate that is well above average, it fails to reach average levels of innovation, talent, and connectivity.
Examples: Shenyang, Changchun, Chengdu
5. Knowledge Capitals
These are 19 mid-sized cities in the U.S. and Europe that are considered centers of innovation, with elite research universities producing talented workforces.
Examples: San Francisco, Boston, Zurich
6. American Middleweights
These 16 mid-sized U.S. metro areas are relatively wealthy and house strong universities, as well as other anchor institutions.
Examples: Orlando, Sacramento, Phoenix
7. International Middleweights
These 26 cities span across several continents, internationally connected by human and investment capital flow. Like their American middleweight counterparts, growth has slowed for these cities since the 2008 recession.
Examples: Vancouver, Melbourne, Brussels, Tel Aviv


Markets
U.S. Debt Interest Payments Reach $1 Trillion
U.S. debt interest payments have surged past the $1 trillion dollar mark, amid high interest rates and an ever-expanding debt burden.


U.S. Debt Interest Payments Reach $1 Trillion
This was originally posted on our Voronoi app. Download the app for free on iOS or Android and discover incredible data-driven charts from a variety of trusted sources.
The cost of paying for America’s national debt crossed the $1 trillion dollar mark in 2023, driven by high interest rates and a record $34 trillion mountain of debt.
Over the last decade, U.S. debt interest payments have more than doubled amid vast government spending during the pandemic crisis. As debt payments continue to soar, the Congressional Budget Office (CBO) reported that debt servicing costs surpassed defense spending for the first time ever this year.
This graphic shows the sharp rise in U.S. debt payments, based on data from the Federal Reserve.
A $1 Trillion Interest Bill, and Growing
Below, we show how U.S. debt interest payments have risen at a faster pace than at another time in modern history:
| Date | Interest Payments | U.S. National Debt |
|---|---|---|
| 2023 | $1.0T | $34.0T |
| 2022 | $830B | $31.4T |
| 2021 | $612B | $29.6T |
| 2020 | $518B | $27.7T |
| 2019 | $564B | $23.2T |
| 2018 | $571B | $22.0T |
| 2017 | $493B | $20.5T |
| 2016 | $460B | $20.0T |
| 2015 | $435B | $18.9T |
| 2014 | $442B | $18.1T |
| 2013 | $425B | $17.2T |
| 2012 | $417B | $16.4T |
| 2011 | $433B | $15.2T |
| 2010 | $400B | $14.0T |
| 2009 | $354B | $12.3T |
| 2008 | $380B | $10.7T |
| 2007 | $414B | $9.2T |
| 2006 | $387B | $8.7T |
| 2005 | $355B | $8.2T |
| 2004 | $318B | $7.6T |
| 2003 | $294B | $7.0T |
| 2002 | $298B | $6.4T |
| 2001 | $318B | $5.9T |
| 2000 | $353B | $5.7T |
| 1999 | $353B | $5.8T |
| 1998 | $360B | $5.6T |
| 1997 | $368B | $5.5T |
| 1996 | $362B | $5.3T |
| 1995 | $357B | $5.0T |
| 1994 | $334B | $4.8T |
| 1993 | $311B | $4.5T |
| 1992 | $306B | $4.2T |
| 1991 | $308B | $3.8T |
| 1990 | $298B | $3.4T |
| 1989 | $275B | $3.0T |
| 1988 | $254B | $2.7T |
| 1987 | $240B | $2.4T |
| 1986 | $225B | $2.2T |
| 1985 | $219B | $1.9T |
| 1984 | $205B | $1.7T |
| 1983 | $176B | $1.4T |
| 1982 | $157B | $1.2T |
| 1981 | $142B | $1.0T |
| 1980 | $113B | $930.2B |
| 1979 | $96B | $845.1B |
| 1978 | $84B | $789.2B |
| 1977 | $69B | $718.9B |
| 1976 | $61B | $653.5B |
| 1975 | $55B | $576.6B |
| 1974 | $50B | $492.7B |
| 1973 | $45B | $469.1B |
| 1972 | $39B | $448.5B |
| 1971 | $36B | $424.1B |
| 1970 | $35B | $389.2B |
| 1969 | $30B | $368.2B |
| 1968 | $25B | $358.0B |
| 1967 | $23B | $344.7B |
| 1966 | $21B | $329.3B |
Interest payments represent seasonally adjusted annual rate at the end of Q4.
At current rates, the U.S. national debt is growing by a remarkable $1 trillion about every 100 days, equal to roughly $3.6 trillion per year.
As the national debt has ballooned, debt payments even exceeded Medicaid outlays in 2023—one of the government’s largest expenditures. On average, the U.S. spent more than $2 billion per day on interest costs last year. Going further, the U.S. government is projected to spend a historic $12.4 trillion on interest payments over the next decade, averaging about $37,100 per American.
Exacerbating matters is that the U.S. is running a steep deficit, which stood at $1.1 trillion for the first six months of fiscal 2024. This has accelerated due to the 43% increase in debt servicing costs along with a $31 billion dollar increase in defense spending from a year earlier. Additionally, a $30 billion increase in funding for the Federal Deposit Insurance Corporation in light of the regional banking crisis last year was a major contributor to the deficit increase.
Overall, the CBO forecasts that roughly 75% of the federal deficit’s increase will be due to interest costs by 2034.

-

 Mining2 weeks ago
Charted: The Value Gap Between the Gold Price and Gold Miners
-

 Real Estate1 week ago
Ranked: The Most Valuable Housing Markets in America
-

 Business1 week ago
Charted: Big Four Market Share by S&P 500 Audits
-

 AI1 week ago
The Stock Performance of U.S. Chipmakers So Far in 2024
-

 Misc1 week ago
Almost Every EV Stock is Down After Q1 2024
-

 Money2 weeks ago
Where Does One U.S. Tax Dollar Go?
-

 Green2 weeks ago
Ranked: Top Countries by Total Forest Loss Since 2001
-

 Real Estate2 weeks ago
Visualizing America’s Shortage of Affordable Homes