Advertising
How COVID-19 Has Impacted Media Consumption, by Generation
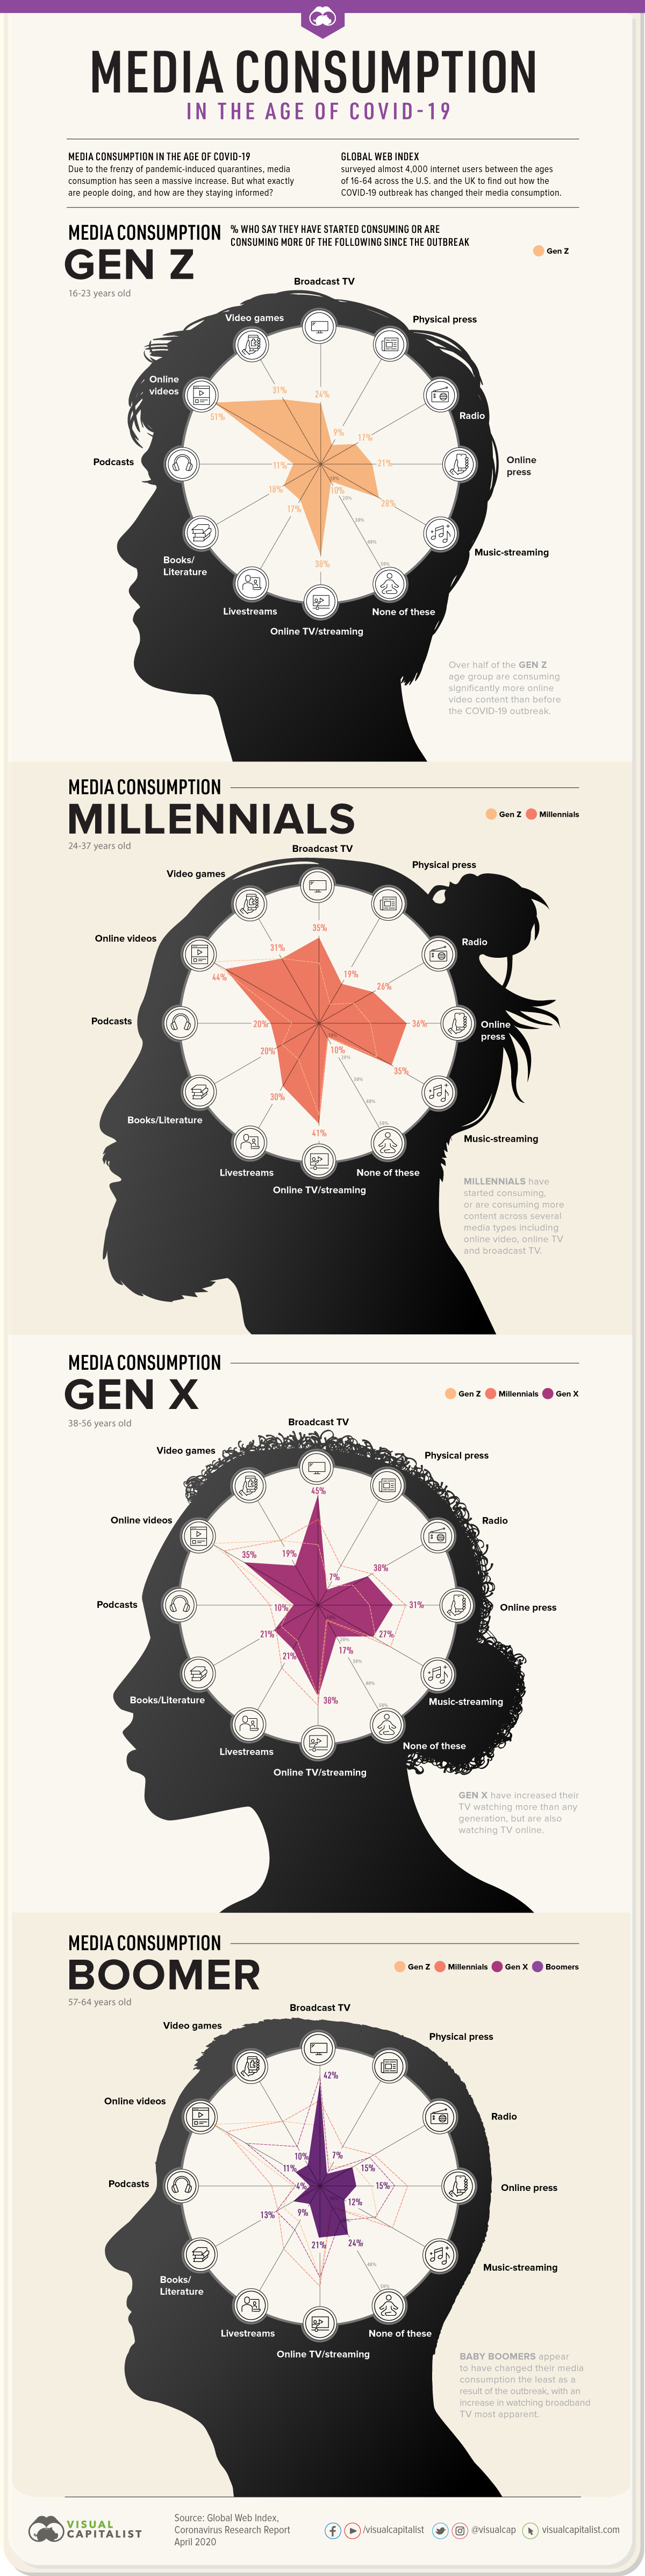


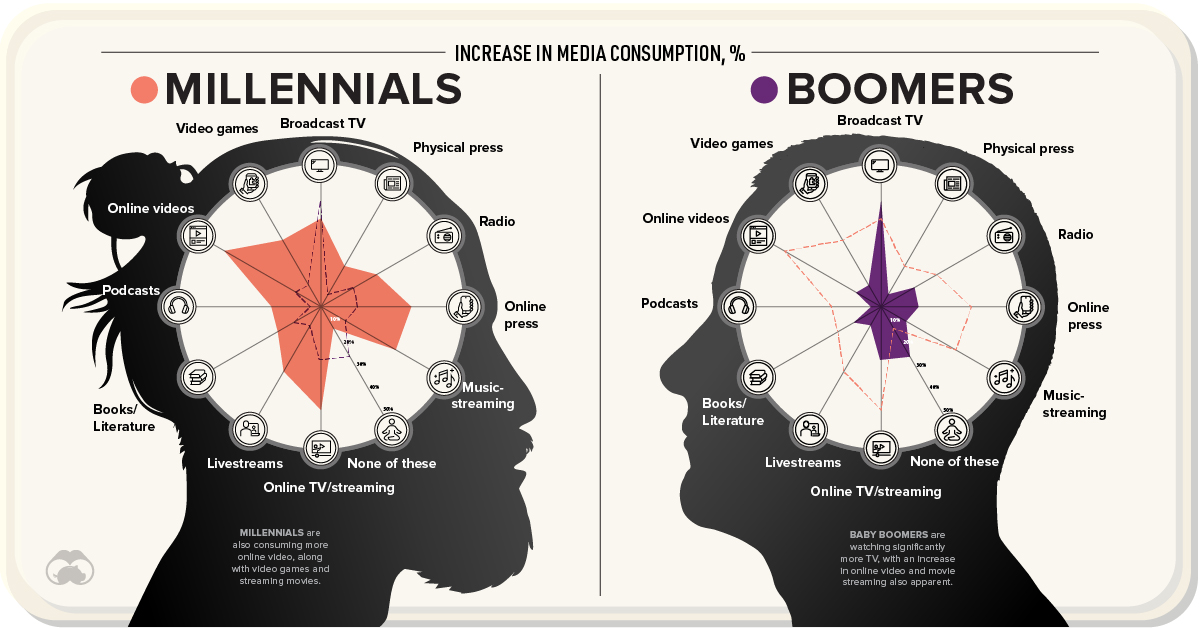
Media Consumption in the Age of COVID-19
As the coronavirus outbreak continues to wreak havoc across the globe, people’s time that would have otherwise been spent perusing malls or going to live events, is now being spent on the sofa.
During this period of pandemic-induced social isolation, it’s no surprise that people are consuming vast amounts of media. Today’s graphics use data from a Global Web Index report to explore how people have increased their media consumption as a result of the outbreak, and how it differs across each generation.
More Time to Kill
Global Web Index found that over 80% of consumers in the U.S. and UK say they consume more content since the outbreak, with broadcast TV and online videos (YouTube, TikTok) being the primary mediums across all generations and genders.
Unsurprisingly, 68% of consumers are seeking out pandemic updates online over any other activity. Gen Zers however, have other plans, as they are the only generation more likely to be listening to music than searching for news.
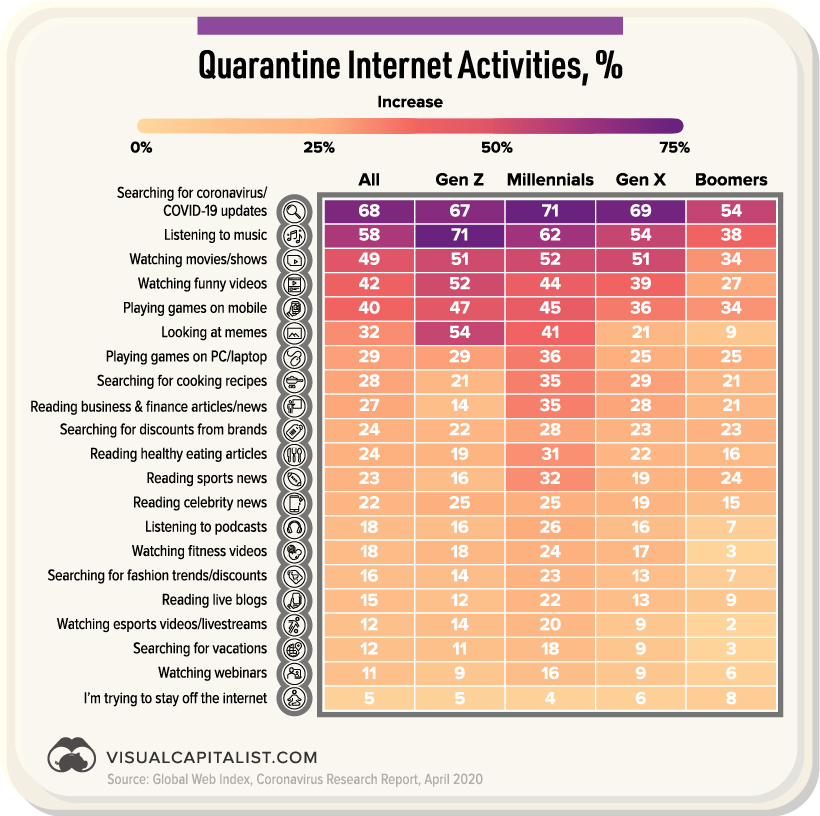
Overall, younger generations are more likely to entertain themselves by playing games on their mobile or computer. Millennials also stand out as the foodie generation, as they are the most likely to be searching for cooking recipes or reading up on healthy eating.
Leaning on a Pillar of Trust
Across the board, consumers view the World Health Organization (WHO) as the most trusted source of information for any COVID-19 related updates.
This isn’t true everywhere on a regional basis, however. For example, while U.S. consumers trust WHO the most, UK consumers view their government as their most trusted news source overall.
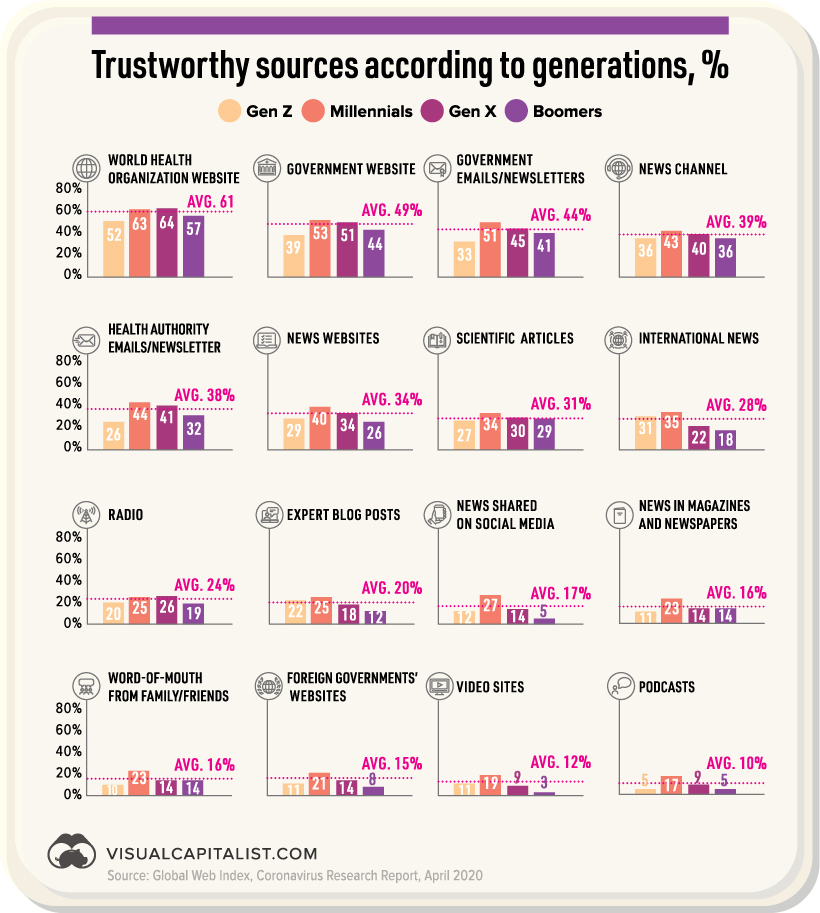
Trust in information shared on social media is higher than word of mouth from friends and family, and even foreign government websites. That said, it is lower than information shared on the radio or news websites.
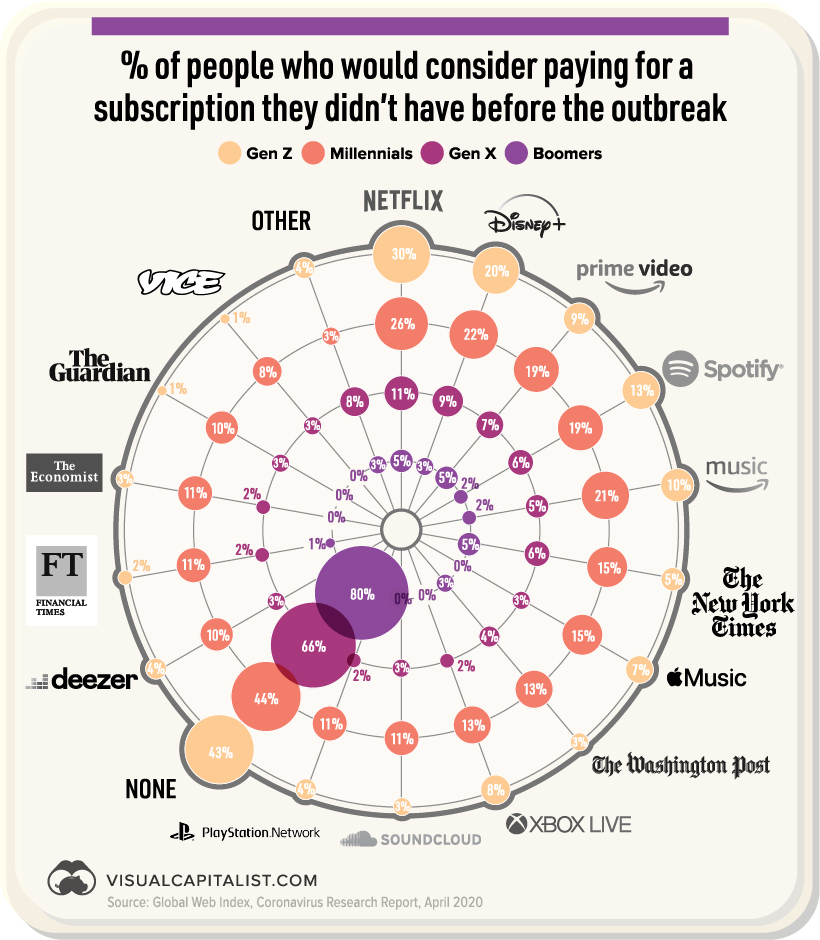
The Need for Pandemic Positivity
While staying abreast of pandemic updates is important, ultimately, a positive mindset and the ability to switch off will help people cope better day-to-day.
Therefore, it seems reasonable that people are more inclined to invest in new subscription services since they have been in isolation, with almost one-third of Gen Zers considering purchasing Netflix, followed by Disney+.
Understandably, people are becoming increasingly worried about how much time they are dedicating to their screens. However, research suggests that screen time itself is no cause for concern. Rather, it’s the content we choose to consume that could have a significant impact our psychological well-being.
Perhaps most intriguingly, the TV shows and movies that are increasing in popularity on Netflix are about pandemics—which could signify the need for people to fictionalize the chaos we find ourselves in.
Regardless of what type of content we are consuming, the fact is that every generation is relying on their devices during this pandemic to inform and distract more than ever before, creating a huge opportunity for media companies to engage a captive audience.


Revenue
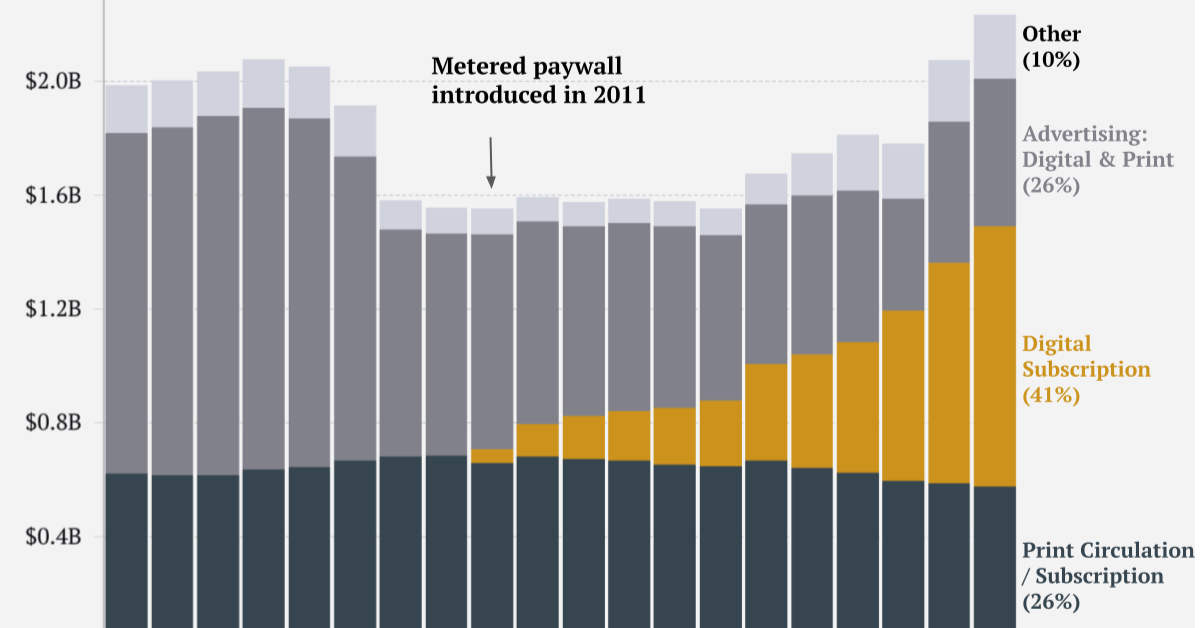
Charting Revenue: How The New York Times Makes Money
This graphic tracks the New York Times’ revenue streams over the past two decades, identifying its transition from advertising to subscription-reliant.
 Creator Program
When it comes to quality and accessible content, whether it be entertainment or news, consumers are often willing to pay for it.
Similar to the the precedent set by the music industry, many news outlets have also been figuring out how to transition into a paid digital monetization model. Over the past decade or so, The New York Times (NY Times)—one of the world’s most iconic and widely read news organizations—has been transforming its revenue model to fit this trend.
This chart from creator Trendline uses annual reports from the The New York Times Company to visualize how this seemingly simple transition helped the organization adapt to the digital era.
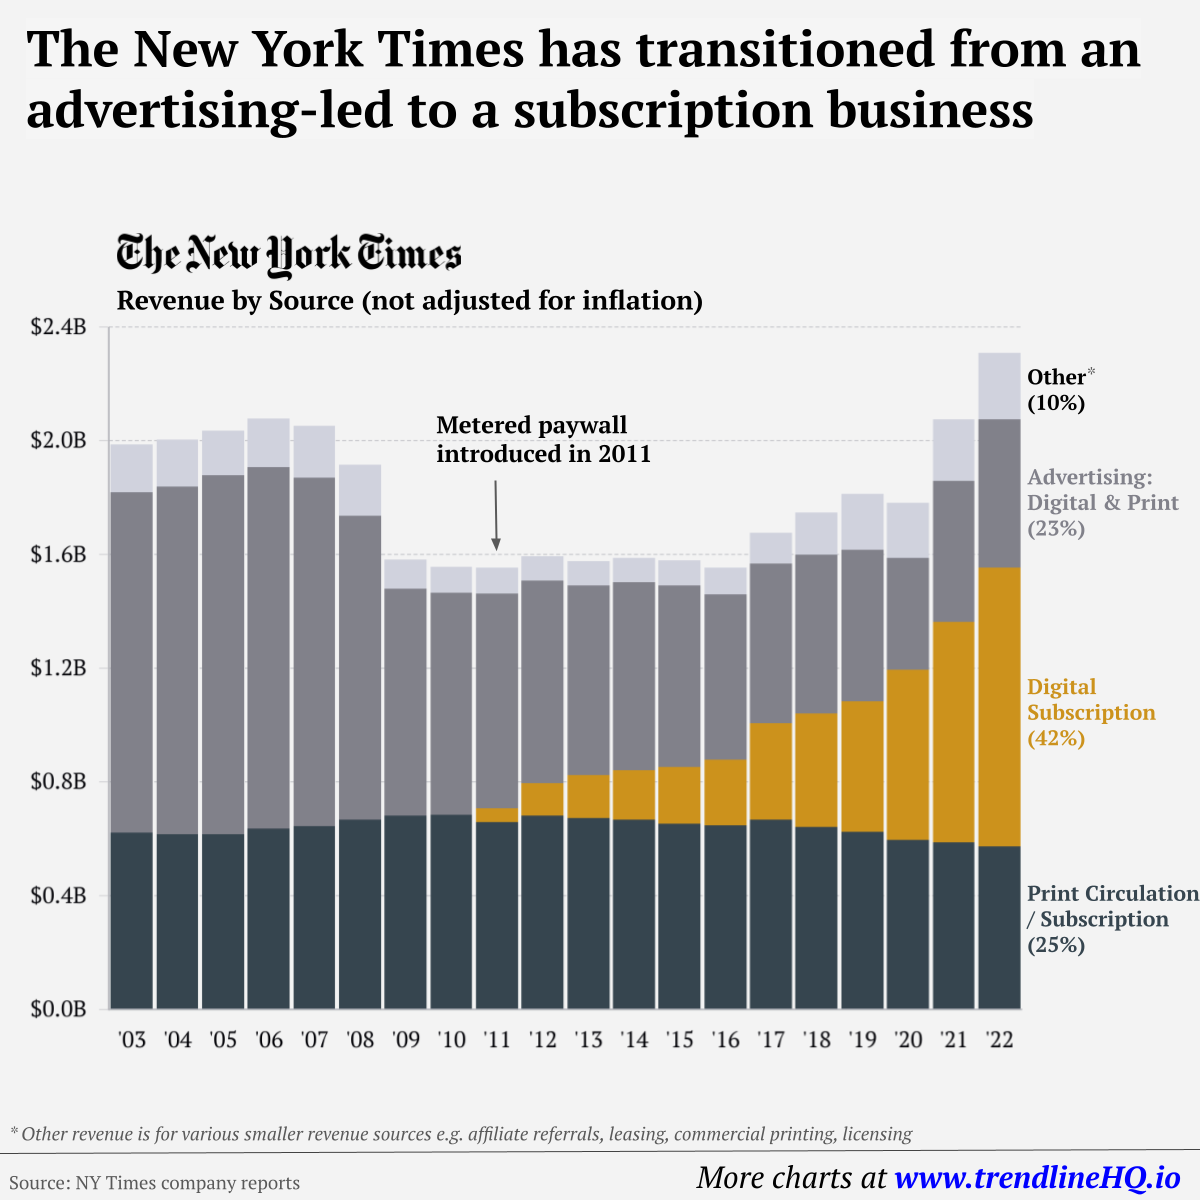
The New York Times’ Revenue Transition
The NY Times has always been one of the world’s most-widely circulated papers. Before the launch of its digital subscription model, it earned half its revenue from print and online advertisements.
The rest of its income came in through circulation and other avenues including licensing, referrals, commercial printing, events, and so on. But after annual revenues dropped by more than $500 million from 2006 to 2010, something had to change.
| NY Revenue By Year | Print Circulation | Digital Subscription | Advertising | Other | Total |
|---|---|---|---|---|---|
| 2003 | $623M | $1,196M | $168M | $1,987M | |
| 2004 | $616M | $1,222M | $165M | $2,003M | |
| 2005 | $616M | $1,262M | $157M | $2,035M | |
| 2006 | $637M | $1,269M | $172M | $2,078M | |
| 2007 | $646M | $1,223M | $183M | $2,052M | |
| 2008 | $668M | $1,068M | $181M | $1,917M | |
| 2009 | $683M | $797M | $101M | $1,581M | |
| 2010 | $684M | $780M | $93M | $1,557M | |
| 2011 | $659M | $47M | $756M | $93M | $1,555M |
| 2012 | $681M | $114M | $712M | $88M | $1,595M |
| 2013 | $673M | $151M | $667M | $86M | $1,577M |
| 2014 | $668M | $172M | $662M | $86M | $1,588M |
| 2015 | $653M | $199M | $639M | $89M | $1,580M |
| 2016 | $647M | $232M | $581M | $94M | $1,554M |
| 2017 | $668M | $340M | $559M | $109M | $1,676M |
| 2018 | $642M | $400M | $558M | $148M | $1,748M |
| 2019 | $624M | $460M | $531M | $198M | $1,813M |
| 2020 | $597M | $598M | $392M | $196M | $1,783M |
| 2021 | $588M | $774M | $498M | $215M | $2,075M |
| 2022 | $574M | $979M | $523M | $233M | $2,308M |
In 2011, the NY Times launched its new digital subscription model and put some of its online articles behind a paywall. It bet that consumers would be willing to pay for quality content.
And while it faced a rocky start, with revenue through print circulation and advertising slowly dwindling and some consumers frustrated that once-available content was now paywalled, its income through digital subscriptions began to climb.
After digital subscription revenues first launched in 2011, they totaled to $47 million of revenue in their first year. By 2022 they had climbed to $979 million and accounted for 42% of total revenue.
Why Are Readers Paying for News?
More than half of U.S. adults subscribe to the news in some format. That (perhaps surprisingly) includes around four out of 10 adults under the age of 35.
One of the main reasons cited for this was the consistency of publications in covering a variety of news topics.
And given the NY Times’ popularity, it’s no surprise that it recently ranked as the most popular news subscription.

-

 Green1 week ago
Ranked: The Countries With the Most Air Pollution in 2023
-

 Automotive2 weeks ago
Almost Every EV Stock is Down After Q1 2024
-

 AI2 weeks ago
The Stock Performance of U.S. Chipmakers So Far in 2024
-

 Markets2 weeks ago
Charted: Big Four Market Share by S&P 500 Audits
-

 Real Estate2 weeks ago
Ranked: The Most Valuable Housing Markets in America
-

 Money2 weeks ago
Which States Have the Highest Minimum Wage in America?
-

 AI2 weeks ago
Ranked: Semiconductor Companies by Industry Revenue Share
-

 Travel2 weeks ago
Ranked: The World’s Top Flight Routes, by Revenue