Technology
The Massive Impact of EVs on Commodities in One Chart
The Massive Impact of EVs on Commodities
How demand would change in a 100% EV world
The Chart of the Week is a weekly Visual Capitalist feature on Fridays.
What would happen if you flipped a switch, and suddenly every new car that came off assembly lines was electric?
It’s obviously a thought experiment, since right now EVs have close to just 1% market share worldwide. We’re still years away from EVs even hitting double-digit demand on a global basis, and the entire supply chain is built around the internal combustion engine, anyways.
At the same time, however, the scenario is interesting to consider. One recent projection, for example, put EVs at a 16% penetration by 2030 and then 51% by 2040. This could be conservative depending on the changing regulatory environment for manufacturers – after all, big markets like China, France, and the U.K. have recently announced that they plan on banning gas-powered vehicles in the near future.
The Thought Experiment
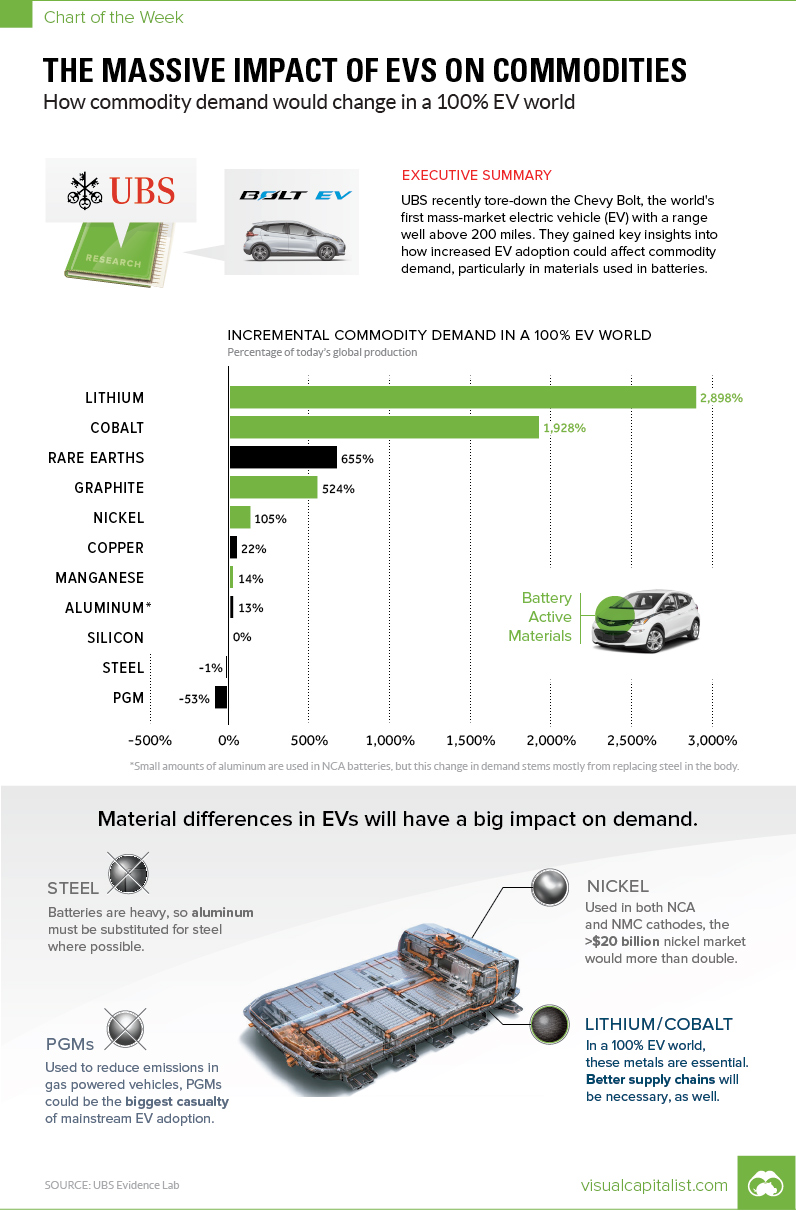
We discovered this “100% EV world” thought experiment in a UBS report that everyone should read. As a part of their UBS Evidence Lab initiative, they tore down a Chevy Bolt to see exactly what is inside, and then had 39 of the bank’s analysts weigh in on the results.
After breaking down the metals and other materials used in the vehicle, they noticed a considerable amount of variance from what gets used in a standard gas-powered car. It wasn’t just the battery pack that made a difference – it was also the body and the permanent-magnet synchronous motor that had big implications.
As a part of their analysis, they extrapolated the data for a potential scenario where 100% of the world’s auto demand came from Chevy Bolts, instead of the current auto mix.
The Implications
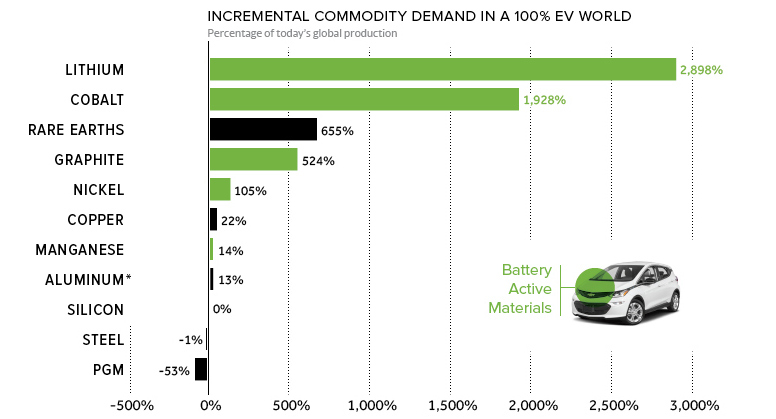
If global demand suddenly flipped in this fashion, here’s what would happen:
| Material | Demand increase | Notes |
|---|---|---|
| Lithium | 2,898% | Needed in all lithium-ion batteries |
| Cobalt | 1,928% | Used in the Bolt's NMC cathode |
| Rare Earths | 655% | Bolt uses neodymium in permanent magnet motor |
| Graphite | 524% | Used in the anode of lithium-ion batteries |
| Nickel | 105% | Used in the Bolt's NMC cathode |
| Copper | 22% | Used in permanent magnet motor and wiring |
| Manganese | 14% | Used in the Bolt's NMC cathode |
| Aluminum | 13% | Used to reduce weight of vehicle |
| Silicon | 0% | Bolt uses 6-10x more semiconductors |
| Steel | -1% | Uses 7% less steel, but fairly minimal impact on market |
| PGMs | -53% | Catalytic converters not needed in EVs |
Some caveats we think are worth noting:
The Bolt is not a Tesla
The Bolt uses an NMC cathode formulation (nickel, manganese, and cobalt in a 1:1:1 ratio), versus Tesla vehicles which use NCA cathodes (nickel, cobalt, and aluminum, in an estimated 16:3:1 ratio). Further, the Bolt uses an permanent-magnet synchronous motor, which is different from Tesla’s AC induction motor – the key difference there being rare earth usage.
Big Markets, small markets:
Lithium, cobalt, and graphite have tiny markets, and they will explode in size with any notable increase in EV demand. The nickel market, which is more than $20 billion per year, will also more than double in this scenario. It’s also worth noting that the Bolt uses low amounts of nickel in comparison to Tesla cathodes, which are 80% nickel.
Meanwhile, the 100% EV scenario barely impacts the steel market, which is monstrous to begin with. The same can be said for silicon, even though the Bolt uses 6-10x more semiconductors than a regular car. The market for PGMs like platinum and palladium, however, gets decimated in this hypothetical scenario – that’s because their use as catalysts in combustion engines are a primary source of demand.


Technology
Visualizing AI Patents by Country
See which countries have been granted the most AI patents each year, from 2012 to 2022.


Visualizing AI Patents by Country
This was originally posted on our Voronoi app. Download the app for free on iOS or Android and discover incredible data-driven charts from a variety of trusted sources.
This infographic shows the number of AI-related patents granted each year from 2010 to 2022 (latest data available). These figures come from the Center for Security and Emerging Technology (CSET), accessed via Stanford University’s 2024 AI Index Report.
From this data, we can see that China first overtook the U.S. in 2013. Since then, the country has seen enormous growth in the number of AI patents granted each year.
| Year | China | EU and UK | U.S. | RoW | Global Total |
|---|---|---|---|---|---|
| 2010 | 307 | 137 | 984 | 571 | 1,999 |
| 2011 | 516 | 129 | 980 | 581 | 2,206 |
| 2012 | 926 | 112 | 950 | 660 | 2,648 |
| 2013 | 1,035 | 91 | 970 | 627 | 2,723 |
| 2014 | 1,278 | 97 | 1,078 | 667 | 3,120 |
| 2015 | 1,721 | 110 | 1,135 | 539 | 3,505 |
| 2016 | 1,621 | 128 | 1,298 | 714 | 3,761 |
| 2017 | 2,428 | 144 | 1,489 | 1,075 | 5,136 |
| 2018 | 4,741 | 155 | 1,674 | 1,574 | 8,144 |
| 2019 | 9,530 | 322 | 3,211 | 2,720 | 15,783 |
| 2020 | 13,071 | 406 | 5,441 | 4,455 | 23,373 |
| 2021 | 21,907 | 623 | 8,219 | 7,519 | 38,268 |
| 2022 | 35,315 | 1,173 | 12,077 | 13,699 | 62,264 |
In 2022, China was granted more patents than every other country combined.
While this suggests that the country is very active in researching the field of artificial intelligence, it doesn’t necessarily mean that China is the farthest in terms of capability.
Key Facts About AI Patents
According to CSET, AI patents relate to mathematical relationships and algorithms, which are considered abstract ideas under patent law. They can also have different meaning, depending on where they are filed.
In the U.S., AI patenting is concentrated amongst large companies including IBM, Microsoft, and Google. On the other hand, AI patenting in China is more distributed across government organizations, universities, and tech firms (e.g. Tencent).
In terms of focus area, China’s patents are typically related to computer vision, a field of AI that enables computers and systems to interpret visual data and inputs. Meanwhile America’s efforts are more evenly distributed across research fields.
Learn More About AI From Visual Capitalist
If you want to see more data visualizations on artificial intelligence, check out this graphic that shows which job departments will be impacted by AI the most.

-

 Markets1 week ago
U.S. Debt Interest Payments Reach $1 Trillion
-

 Business2 weeks ago
Charted: Big Four Market Share by S&P 500 Audits
-

 Real Estate2 weeks ago
Ranked: The Most Valuable Housing Markets in America
-

 Money2 weeks ago
Which States Have the Highest Minimum Wage in America?
-

 AI2 weeks ago
Ranked: Semiconductor Companies by Industry Revenue Share
-

 Markets2 weeks ago
Ranked: The World’s Top Flight Routes, by Revenue
-

 Demographics2 weeks ago
Population Projections: The World’s 6 Largest Countries in 2075
-

 Markets2 weeks ago
The Top 10 States by Real GDP Growth in 2023