Misc
Mapping the World’s Busiest Air Routes
Mapping the World’s Busiest Air Routes
Modern air travel gives us almost unlimited possibilities for getting around.
Whether you are acting on your wanderlust to explore new and exotic destinations, hopping to a familiar island for a well-deserved vacation, or jetsetting to London in the comfort of business class, the modern airline industry can get you almost anywhere you need to go.
But while flying allows us to have unique experiences, it’s often the case that we are all coming and going from many of the same popular destinations. As a result, the world’s busiest air routes have hundreds of flights per day connecting important city pairs together.
Ranking City Pairs
Today’s chart pulls data from OAG, which has compiled a detailed report ranking the busiest domestic and international air routes from around the globe.
It’s worth noting that the data is over the period of March 2018 to February 2019, and it excludes carriers that operate fewer than 500 routes per year.
Let’s dive in to see which city pairs have the most air travel between them.
Domestic Routes
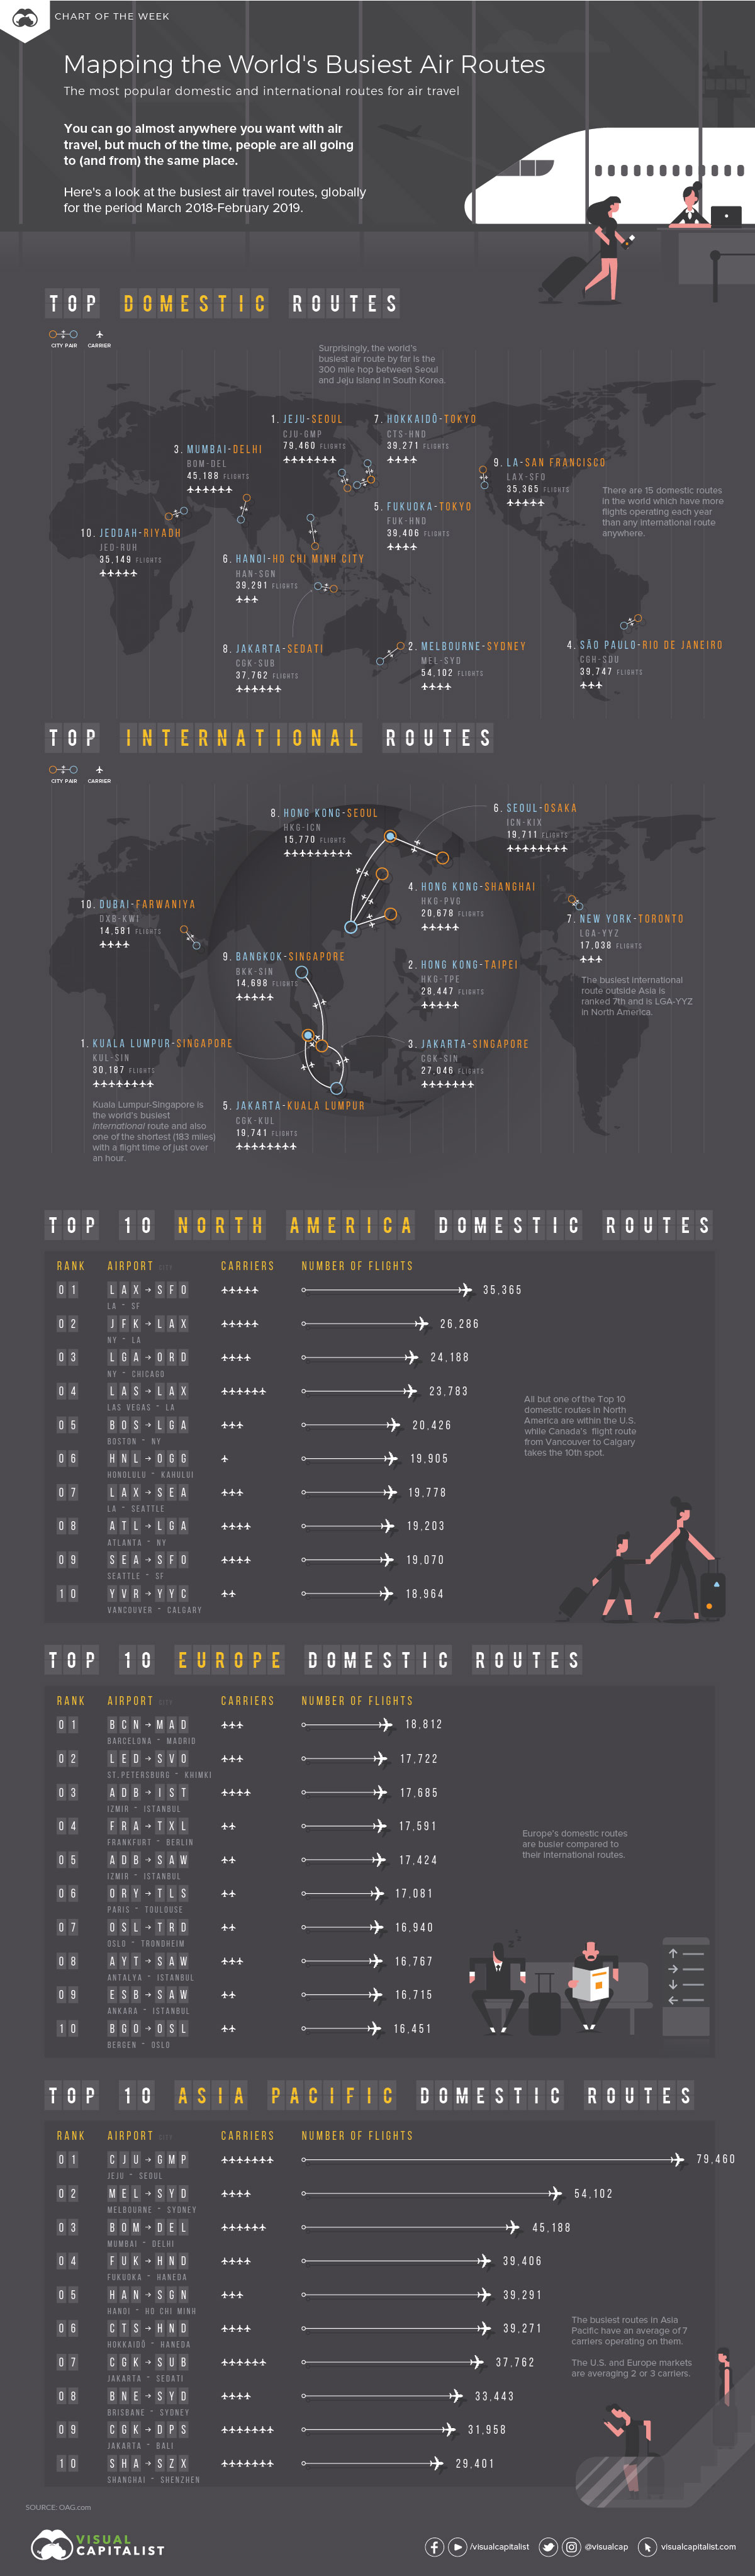
Domestic routes are far more popular than international routes globally. According to the report, there are 15 domestic routes that have more operating flights per year than any international route anywhere.
Here’s a look at the top 10 domestic routes:
| Rank | Country | City Pair | Flights (Annually) | Carriers |
|---|---|---|---|---|
| #1 | 🇰🇷 | Jeju ↔️ Seoul | 79,460 | 7 |
| #2 | 🇦🇺 | Melbourne ↔️ Sydney | 54,102 | 4 |
| #3 | 🇮🇳 | Mumbai ↔️ Delhi | 45,188 | 6 |
| #4 | 🇧🇷 | São Paulo ↔️ Rio de Janeiro | 39,747 | 3 |
| #5 | 🇯🇵 | Fukuoka ↔️ Toyko | 39,406 | 4 |
| #6 | 🇻🇳 | Hanoi ↔️ Ho Chi Minh City | 39,291 | 3 |
| #7 | 🇯🇵 | Hokkaido ↔️ Tokyo | 39,271 | 4 |
| #8 | 🇮🇩 | Jakarta ↔️ Surabaya City | 37,762 | 6 |
| #9 | 🇺🇸 | Los Angeles ↔️ San Francisco | 35,365 | 5 |
| #10 | 🇸🇦 | Jeddah ↔️ Riyadh | 35,149 | 5 |
The busiest domestic route might be a surprise, unless you are familiar with Asian geography.
With almost 80,000 annual flights, the 300-mile hop between Seoul and Jeju Island in South Korea is the busiest air route in the world by a large margin. Overall, there are seven carriers competing on it each day, with over 200 daily flights available between them.
What makes Jeju so popular?
Known as the “Hawaii of South Korea”, this volcanic island is an extremely popular vacation destination within the country, and it hosts roughly 15 million guests per year.
International Routes
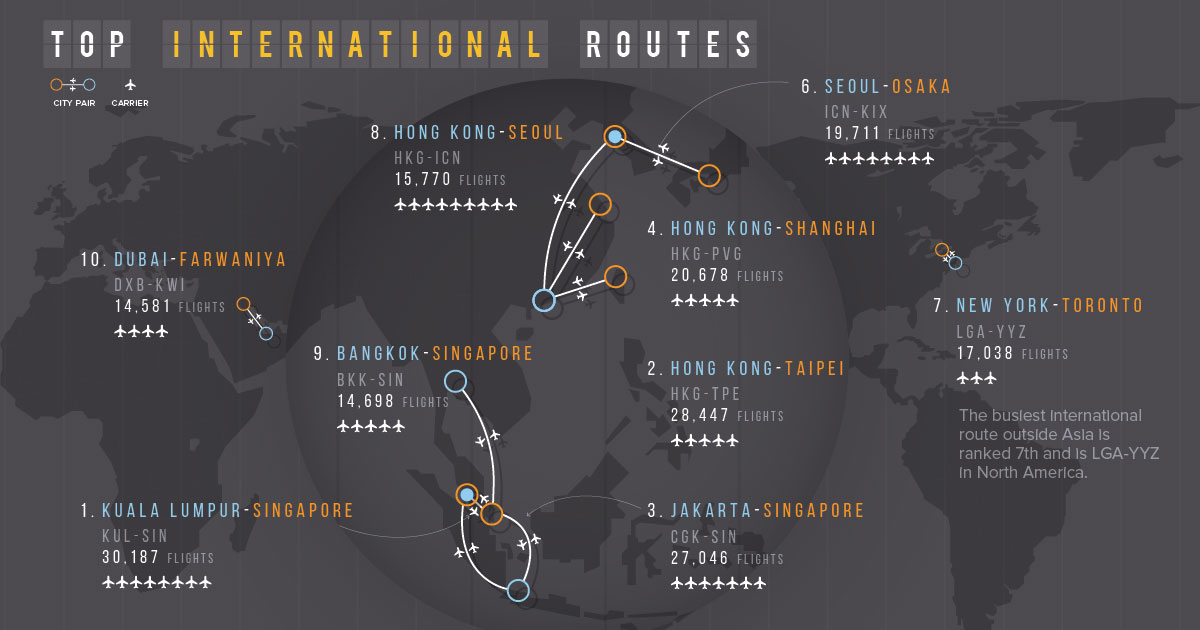
On an international basis, the busiest route has almost 50,000 fewer flights per year than the Jeju-Seoul city pair listed above. Not surprisingly, this route – and many other top international routes – are also located in the Asia Pacific region.
| Rank | Countries | City Pair | Flights (Annually) | Carriers |
|---|---|---|---|---|
| #1 | 🇲🇾🇸🇬 | Kuala Lumpur ↔️ Singapore | 30,187 | 8 |
| #2 | 🇭🇰🇹🇼 | Hong Kong ↔️ Taipei | 28,447 | 5 |
| #3 | 🇮🇩🇸🇬 | Jakarta ↔️ Singapore | 27,046 | 7 |
| #4 | 🇭🇰🇨🇳 | Hong Kong ↔️ Shanghai | 20,678 | 5 |
| #5 | 🇮🇩🇲🇾 | Jakarta ↔️ Kuala Lumpur | 19,741 | 8 |
| #6 | 🇰🇷🇯🇵 | Seoul ↔️ Osaka | 19,711 | 8 |
| #7 | 🇺🇸🇨🇦 | New York (LGA) ↔️ Toronto | 17,038 | 3 |
| #8 | 🇭🇰🇰🇷 | Hong Kong ↔️ Seoul | 15,770 | 9 |
| #9 | 🇹🇭🇸🇬 | Bangkok ↔️ Singapore | 14,698 | 5 |
| #10 | 🇦🇪🇰🇼 | Dubai ↔️ Kuwait | 14,581 | 4 |
The short hop between Singapore and Kuala Lumpur takes only one hour, and it connects two major Southeast Asian commercial hubs. The route has 41 flights per day between eight airlines, making it one of the most competitive routes globally.
The busiest international route outside of the Asia Pacific is between Toronto and New York (LaGuardia) with 17,038 annual flights. Interestingly, it only has three competing carriers – the lowest of any of the top 10 routes.


Misc
How Hard Is It to Get Into an Ivy League School?
We detail the admission rates and average annual cost for Ivy League schools, as well as the median SAT scores required to be accepted.


How Hard Is It to Get Into an Ivy League School?
This was originally posted on our Voronoi app. Download the app for free on iOS or Android and discover incredible data-driven charts from a variety of trusted sources.
Ivy League institutions are renowned worldwide for their academic excellence and long-standing traditions. But how hard is it to get into one of the top universities in the U.S.?
In this graphic, we detail the admission rates and average annual cost for Ivy League schools, as well as the median SAT scores required to be accepted. The data comes from the National Center for Education Statistics and was compiled by 24/7 Wall St.
Note that “average annual cost” represents the net price a student pays after subtracting the average value of grants and/or scholarships received.
Harvard is the Most Selective
The SAT is a standardized test commonly used for college admissions in the United States. It’s taken by high school juniors and seniors to assess their readiness for college-level academic work.
When comparing SAT scores, Harvard and Dartmouth are among the most challenging universities to gain admission to. The median SAT scores for their students are 760 for reading and writing and 790 for math. Still, Harvard has half the admission rate (3.2%) compared to Dartmouth (6.4%).
| School | Admission rate (%) | SAT Score: Reading & Writing | SAT Score: Math | Avg Annual Cost* |
|---|---|---|---|---|
| Harvard University | 3.2 | 760 | 790 | $13,259 |
| Columbia University | 3.9 | 750 | 780 | $12,836 |
| Yale University | 4.6 | 760 | 780 | $16,341 |
| Brown University | 5.1 | 760 | 780 | $26,308 |
| Princeton University | 5.7 | 760 | 780 | $11,080 |
| Dartmouth College | 6.4 | 760 | 790 | $33,023 |
| University of Pennsylvania | 6.5 | 750 | 790 | $14,851 |
| Cornell University | 7.5 | 750 | 780 | $29,011 |
*Costs after receiving federal financial aid.
Additionally, Dartmouth has the highest average annual cost at $33,000. Princeton has the lowest at $11,100.
While student debt has surged in the United States in recent years, hitting $1.73 trillion in 2023, the worth of obtaining a degree from any of the schools listed surpasses mere academics. This is evidenced by the substantial incomes earned by former students.
Harvard grads, for example, have the highest average starting salary in the country, at $91,700.

-

 Real Estate2 weeks ago
Visualizing America’s Shortage of Affordable Homes
-

 Technology1 week ago
Ranked: Semiconductor Companies by Industry Revenue Share
-

 Money1 week ago
Which States Have the Highest Minimum Wage in America?
-

 Real Estate1 week ago
Ranked: The Most Valuable Housing Markets in America
-

 Business2 weeks ago
Charted: Big Four Market Share by S&P 500 Audits
-

 AI2 weeks ago
The Stock Performance of U.S. Chipmakers So Far in 2024
-

 Misc2 weeks ago
Almost Every EV Stock is Down After Q1 2024
-

 Money2 weeks ago
Where Does One U.S. Tax Dollar Go?