Markets
Mapping the World’s Key Maritime Choke Points


Mapping the World’s Key Maritime Choke Points
Maritime transport is an essential part of international trade—approximately 80% of global merchandise is shipped via sea.
Because of its importance, commercial shipping relies on strategic trade routes to move goods efficiently. These waterways are used by thousands of vessels a year—but it’s not always smooth sailing. In fact, there are certain points along these routes that pose a risk to the whole system.
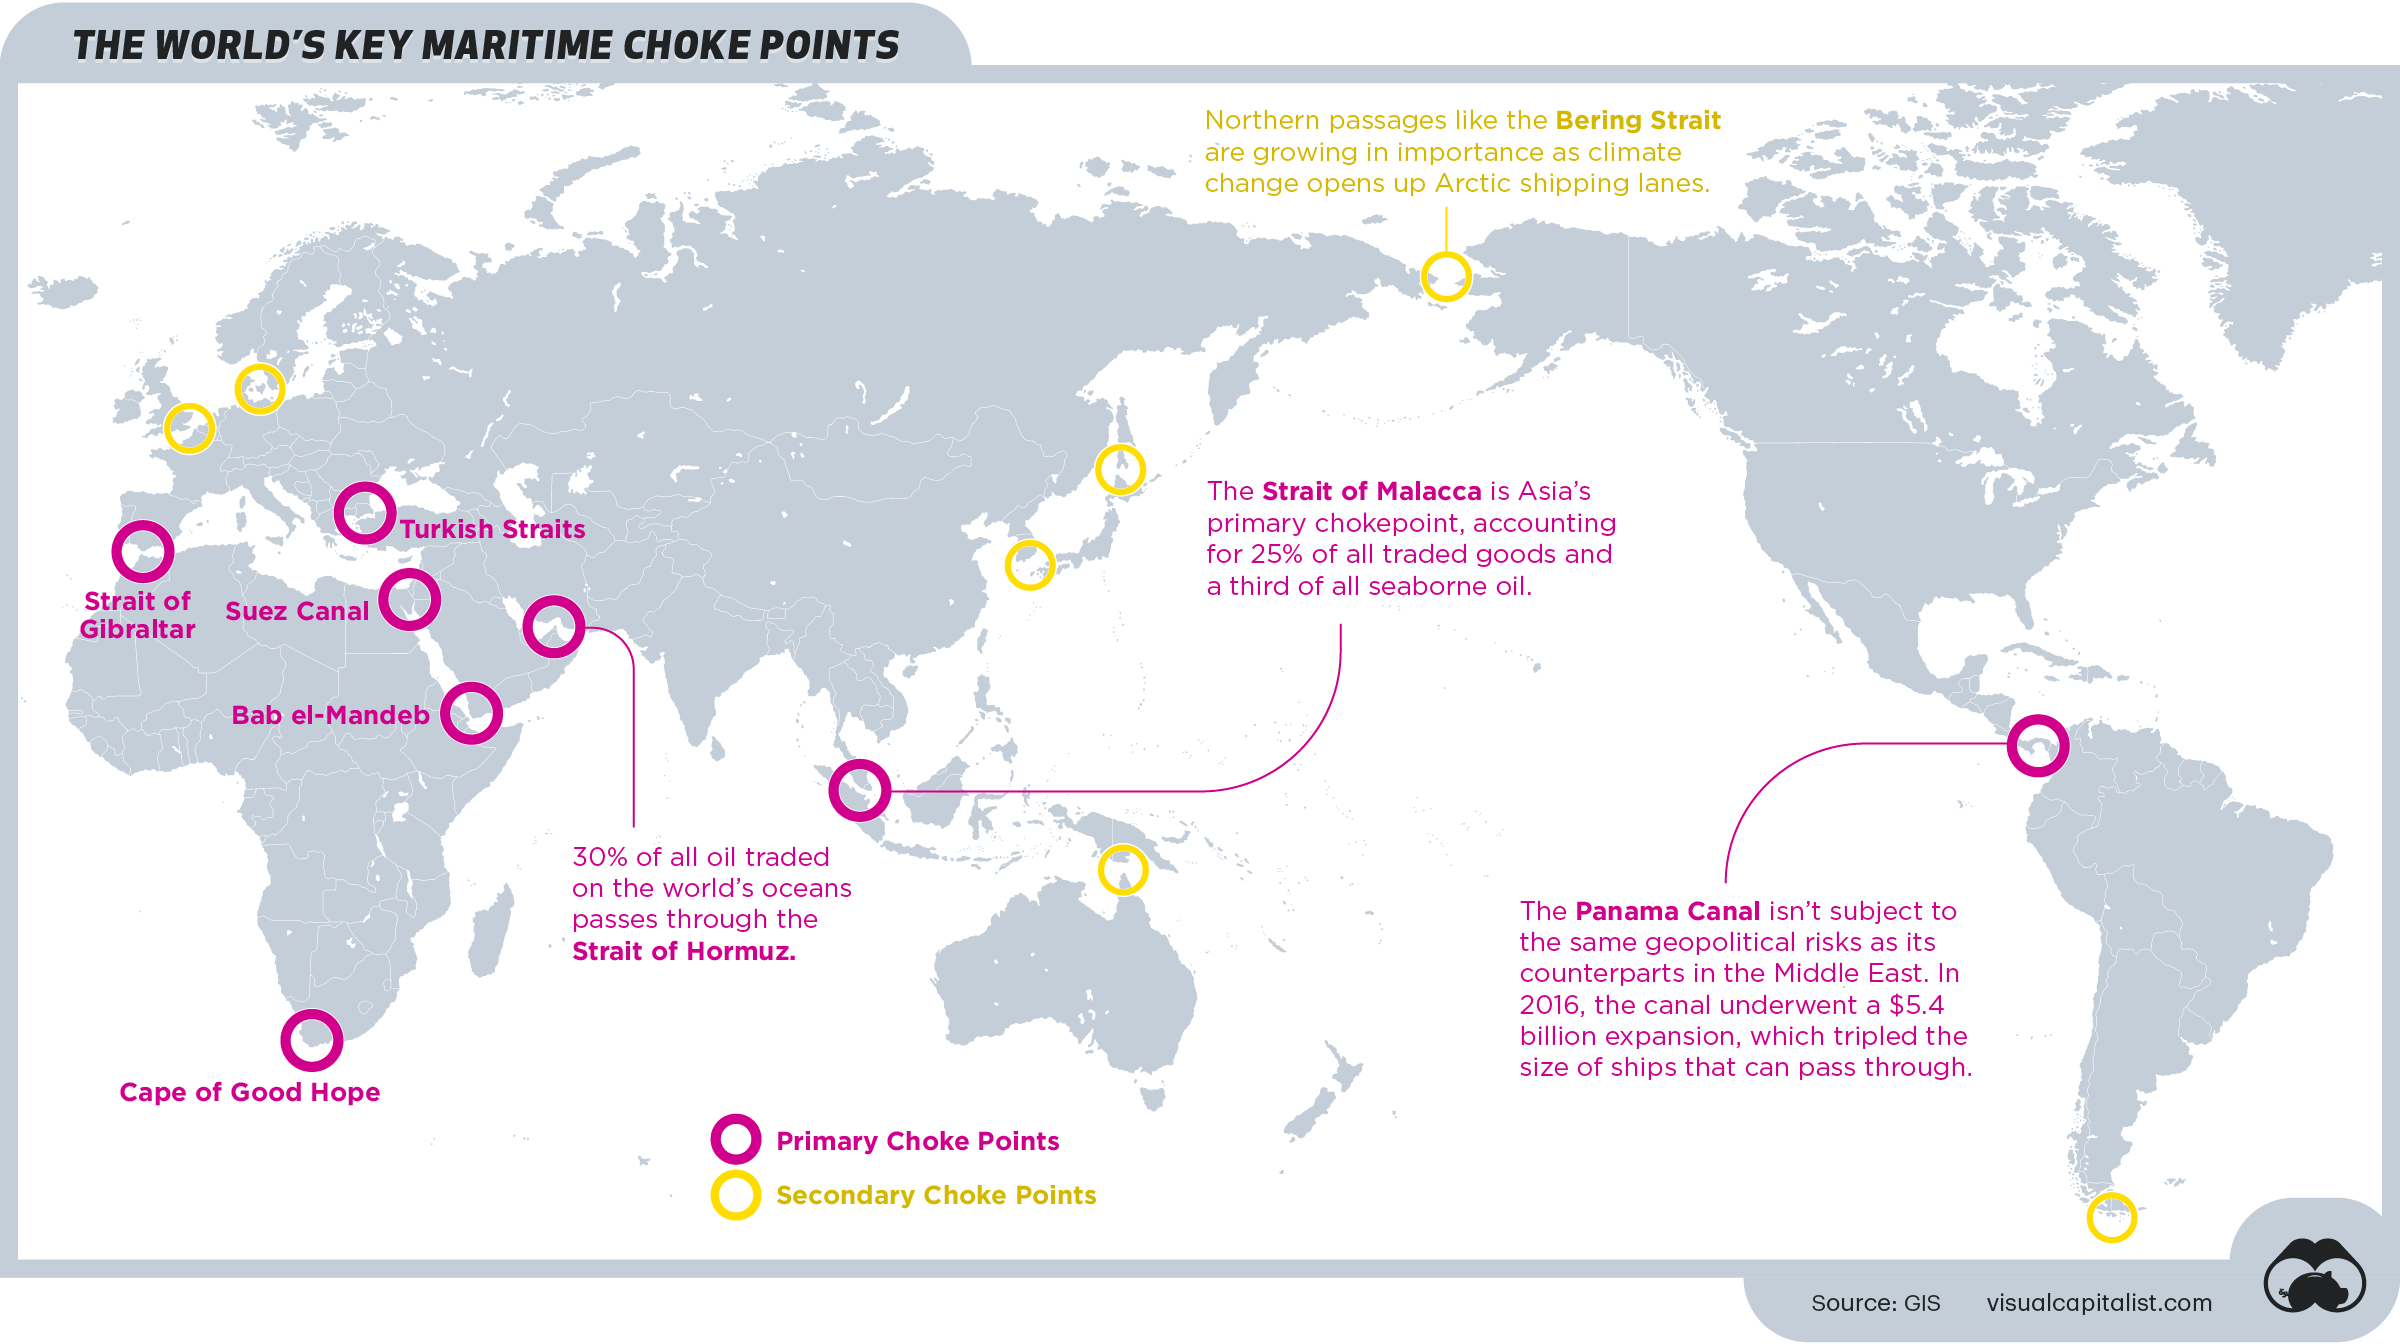
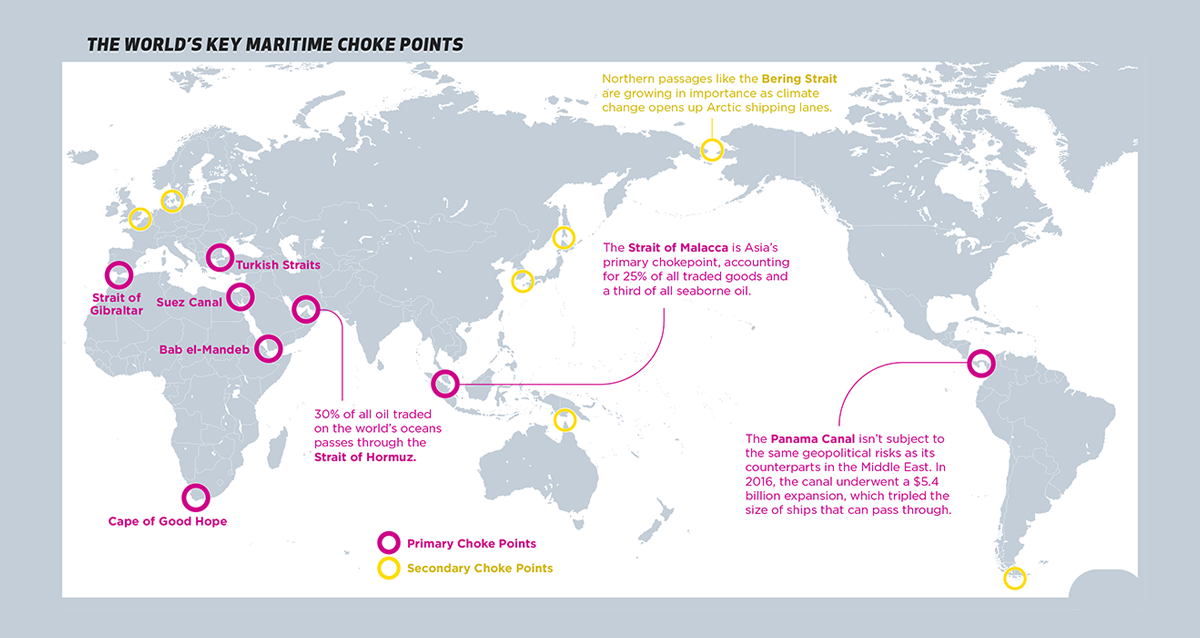
Here’s a look at the world’s most vulnerable maritime bottlenecks—also known as choke points—as identified by GIS.
What’s a Choke Point?
Choke points are strategic, narrow passages that connect two larger areas to one another. When it comes to maritime trade, these are typically straits or canals that see high volumes of traffic because of their optimal location.
Despite their convenience, these vital points pose several risks:
- Structural risks: As demonstrated in the recent Suez Canal blockage, ships can crash along the shore of a canal if the passage is too narrow, causing traffic jams that can last for days.
- Geopolitical risks: Because of their high traffic, choke points are particularly vulnerable to blockades or deliberate disruptions during times of political unrest.
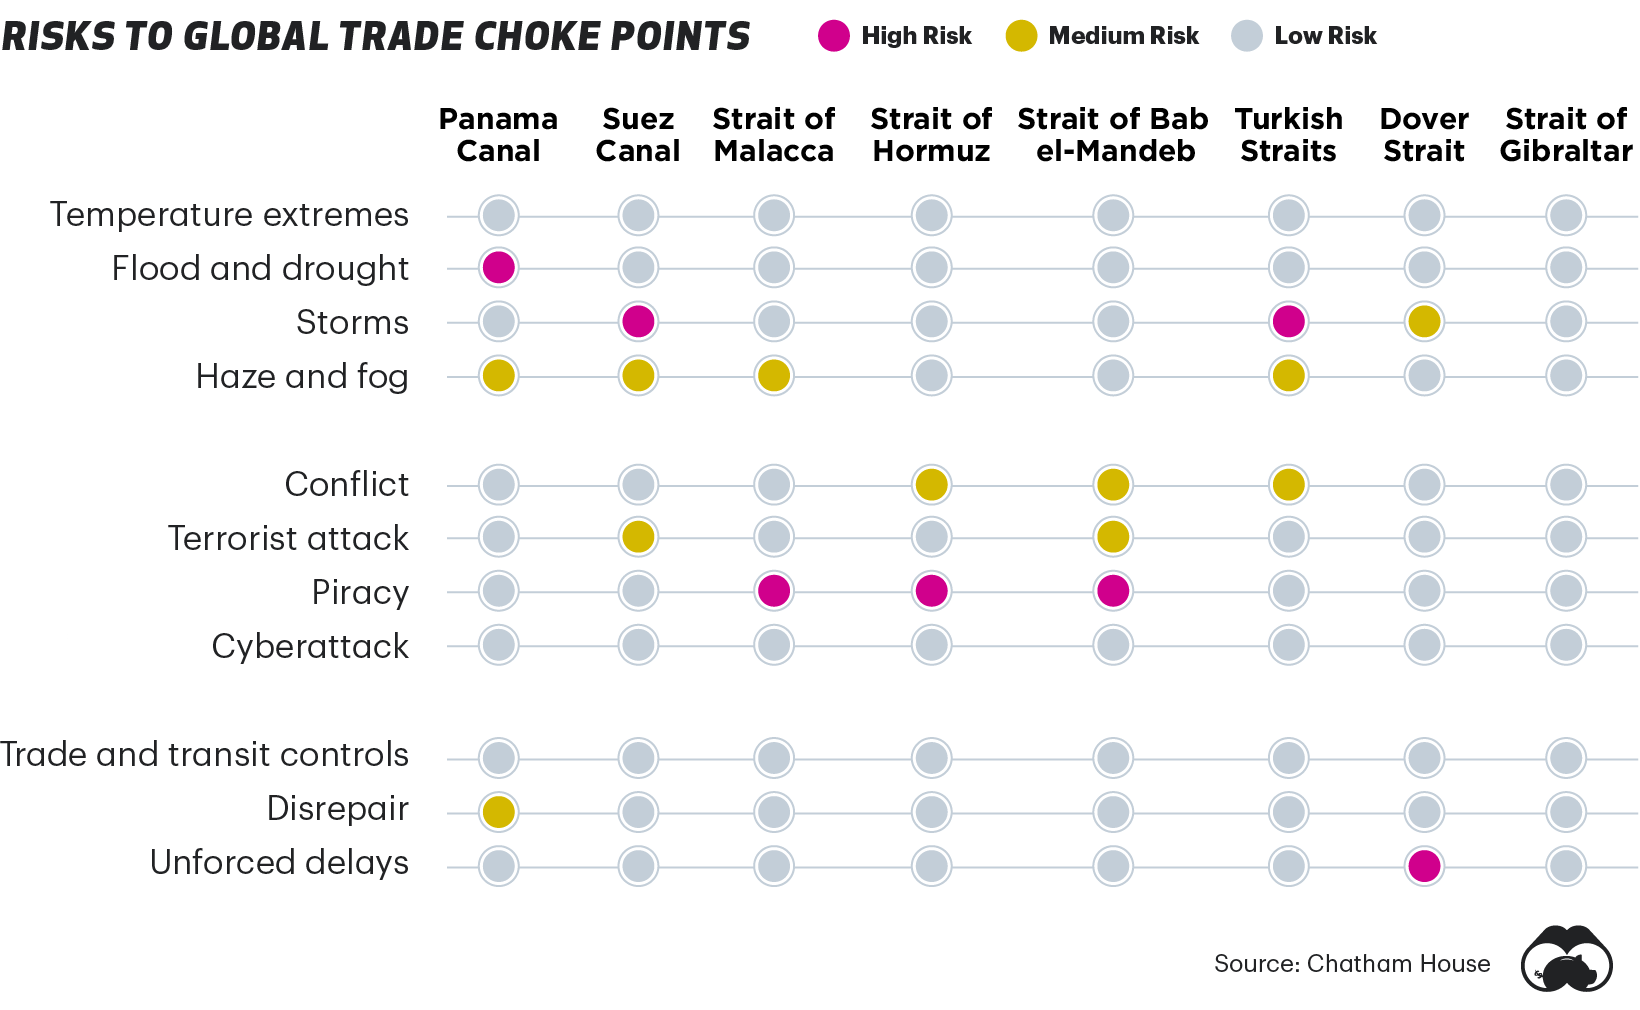
The type and degree of risk varies, depending on location. Here’s a look at some of the biggest threats, at eight of the world’s major choke points.
Because of their high risk, alternatives for some of these key routes have been proposed in the past—for instance, in 2013 Nicaraguan Congress approved a $40 billion dollar project proposal to build a canal that was meant to rival the Panama Canal.
As of today, it has yet to materialize.
A Closer Look: Key Maritime Choke Points
Despite their vulnerabilities, these choke points remain critical waterways that facilitate international trade. Below, we dive into a few of the key areas to provide some context on just how important they are to global trade.
The Panama Canal
The Panama Canal is a lock-type canal that provides a shortcut for ships traveling between the Pacific and Atlantic oceans. Ships sailing between the east and west coasts of the U.S. save over 8,000 nautical miles by using the canal—which roughly shortens their trip by 21 days.
In 2019, 252 million long tons of goods were transported through the Panama Canal, which generated over $2.6 billion in tolls.
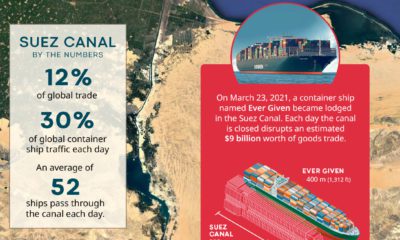
The Suez Canal
The Suez Canal is an Egyptian waterway that connects Europe to Asia. Without this route, ships would need to sail around Africa, which would add approximately seven days to their trips. In 2019, nearly 19,000 vessels, and 1 billion tons of cargo, traveled through the Suez Canal.
In an effort to mitigate risk, the Egyptian government embarked on a major expansion project for the canal back in 2015. But, given the recent blockage caused by a Taiwanese container ship, it’s clear that the waterway is still vulnerable to obstruction.
The Strait of Malacca
At its smallest point, the Strait of Malacca is approximately 1.5 nautical miles, making it one of the world’s narrowest choke points. Despite its size, it’s one of Asia’s most critical waterways, since it provides a critical connection between China, India, and Southeast Asia. This choke point creates a risky situation for the 130,000 or so ships that visit the Port of Singapore each year.
The area is also known to have problems with piracy—in 2019, there were 30 piracy incidents, according to private information group ReCAAP ISC.
The Strait of Hormuz
Controlled by Iran, the Strait of Hormuz links the Persian Gulf to the Gulf of Oman, ultimately draining into the Arabian Sea. It’s a primary vein for the world’s oil supply, transporting approximately 21 million barrels per day.
Historically, it’s also been a site of regional conflict. For instance, tankers and commercial ships were attacked in that area during the Iran-Iraq war in the 1980s.
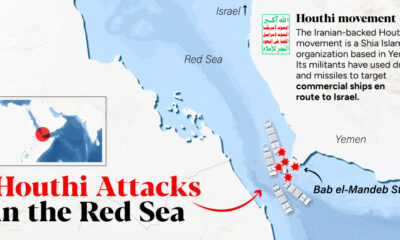
The Bab el-Mandeb Strait
The Bab el-Mandeb Strait is another primary waterway for the world’s oil and natural gas. Nestled between Africa and the Middle East, the critical route connects the Mediterranean Sea (via the Suez Canal) to the Indian Ocean.
Like the Strait of Malacca, it’s well known as a high-risk area for pirate attacks. In May 2020, a UK chemical tanker was attacked off the coast of Yemen–the ninth pirate attack in the area that year.
Due to the strategic nature of the region, there is a strong military presence in nearby Djibouti, including China’s first ever foreign military base.


Markets
U.S. Debt Interest Payments Reach $1 Trillion
U.S. debt interest payments have surged past the $1 trillion dollar mark, amid high interest rates and an ever-expanding debt burden.


U.S. Debt Interest Payments Reach $1 Trillion
This was originally posted on our Voronoi app. Download the app for free on iOS or Android and discover incredible data-driven charts from a variety of trusted sources.
The cost of paying for America’s national debt crossed the $1 trillion dollar mark in 2023, driven by high interest rates and a record $34 trillion mountain of debt.
Over the last decade, U.S. debt interest payments have more than doubled amid vast government spending during the pandemic crisis. As debt payments continue to soar, the Congressional Budget Office (CBO) reported that debt servicing costs surpassed defense spending for the first time ever this year.
This graphic shows the sharp rise in U.S. debt payments, based on data from the Federal Reserve.
A $1 Trillion Interest Bill, and Growing
Below, we show how U.S. debt interest payments have risen at a faster pace than at another time in modern history:
| Date | Interest Payments | U.S. National Debt |
|---|---|---|
| 2023 | $1.0T | $34.0T |
| 2022 | $830B | $31.4T |
| 2021 | $612B | $29.6T |
| 2020 | $518B | $27.7T |
| 2019 | $564B | $23.2T |
| 2018 | $571B | $22.0T |
| 2017 | $493B | $20.5T |
| 2016 | $460B | $20.0T |
| 2015 | $435B | $18.9T |
| 2014 | $442B | $18.1T |
| 2013 | $425B | $17.2T |
| 2012 | $417B | $16.4T |
| 2011 | $433B | $15.2T |
| 2010 | $400B | $14.0T |
| 2009 | $354B | $12.3T |
| 2008 | $380B | $10.7T |
| 2007 | $414B | $9.2T |
| 2006 | $387B | $8.7T |
| 2005 | $355B | $8.2T |
| 2004 | $318B | $7.6T |
| 2003 | $294B | $7.0T |
| 2002 | $298B | $6.4T |
| 2001 | $318B | $5.9T |
| 2000 | $353B | $5.7T |
| 1999 | $353B | $5.8T |
| 1998 | $360B | $5.6T |
| 1997 | $368B | $5.5T |
| 1996 | $362B | $5.3T |
| 1995 | $357B | $5.0T |
| 1994 | $334B | $4.8T |
| 1993 | $311B | $4.5T |
| 1992 | $306B | $4.2T |
| 1991 | $308B | $3.8T |
| 1990 | $298B | $3.4T |
| 1989 | $275B | $3.0T |
| 1988 | $254B | $2.7T |
| 1987 | $240B | $2.4T |
| 1986 | $225B | $2.2T |
| 1985 | $219B | $1.9T |
| 1984 | $205B | $1.7T |
| 1983 | $176B | $1.4T |
| 1982 | $157B | $1.2T |
| 1981 | $142B | $1.0T |
| 1980 | $113B | $930.2B |
| 1979 | $96B | $845.1B |
| 1978 | $84B | $789.2B |
| 1977 | $69B | $718.9B |
| 1976 | $61B | $653.5B |
| 1975 | $55B | $576.6B |
| 1974 | $50B | $492.7B |
| 1973 | $45B | $469.1B |
| 1972 | $39B | $448.5B |
| 1971 | $36B | $424.1B |
| 1970 | $35B | $389.2B |
| 1969 | $30B | $368.2B |
| 1968 | $25B | $358.0B |
| 1967 | $23B | $344.7B |
| 1966 | $21B | $329.3B |
Interest payments represent seasonally adjusted annual rate at the end of Q4.
At current rates, the U.S. national debt is growing by a remarkable $1 trillion about every 100 days, equal to roughly $3.6 trillion per year.
As the national debt has ballooned, debt payments even exceeded Medicaid outlays in 2023—one of the government’s largest expenditures. On average, the U.S. spent more than $2 billion per day on interest costs last year. Going further, the U.S. government is projected to spend a historic $12.4 trillion on interest payments over the next decade, averaging about $37,100 per American.
Exacerbating matters is that the U.S. is running a steep deficit, which stood at $1.1 trillion for the first six months of fiscal 2024. This has accelerated due to the 43% increase in debt servicing costs along with a $31 billion dollar increase in defense spending from a year earlier. Additionally, a $30 billion increase in funding for the Federal Deposit Insurance Corporation in light of the regional banking crisis last year was a major contributor to the deficit increase.
Overall, the CBO forecasts that roughly 75% of the federal deficit’s increase will be due to interest costs by 2034.

-

 Maps2 weeks ago
Mapped: Average Wages Across Europe
-

 Money1 week ago
Which States Have the Highest Minimum Wage in America?
-

 Real Estate1 week ago
Ranked: The Most Valuable Housing Markets in America
-

 Markets1 week ago
Charted: Big Four Market Share by S&P 500 Audits
-

 AI1 week ago
The Stock Performance of U.S. Chipmakers So Far in 2024
-

 Automotive2 weeks ago
Almost Every EV Stock is Down After Q1 2024
-

 Money2 weeks ago
Where Does One U.S. Tax Dollar Go?
-

 Green2 weeks ago
Ranked: Top Countries by Total Forest Loss Since 2001