Green
Mapping the Flow of the World’s Plastic Waste
Mapping the Flow of the World’s Plastic Waste
The first plastic material, Bakelite, was invented in 1907. It made its way into everything you can imagine: telephones, chess pieces, Chanel jewelry, and electric guitars.
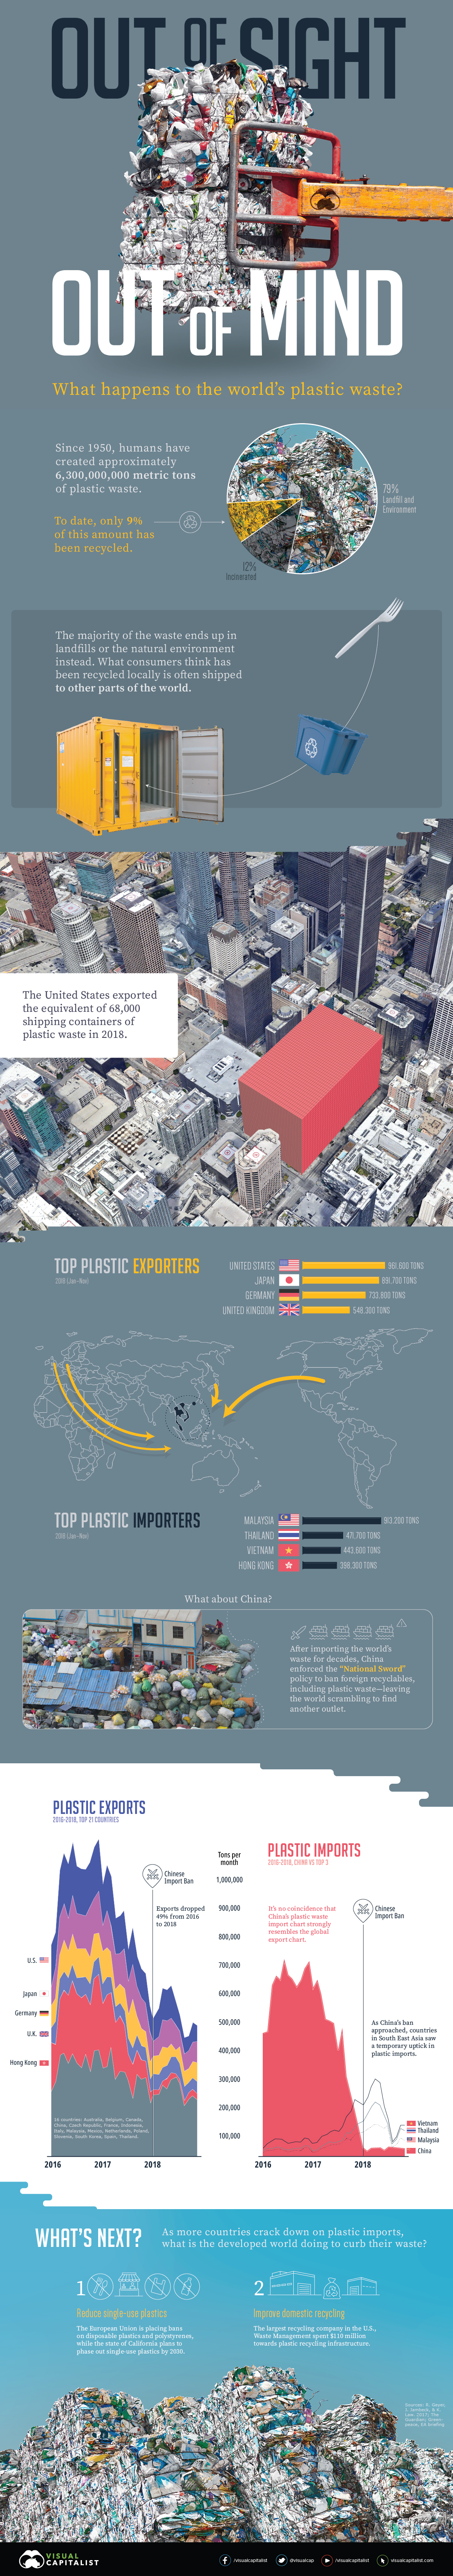
But it was in 1950 that our thirst for plastic truly began. In just 65 years, plastic production soared almost 200 times, resulting in about 6,300 million metric tons of waste today.
How does the world deal with this much debris? The truth is, a lot of plastic waste—both trash and recycled materials—is often shipped overseas to become someone else’s problem.
The Top Exporters and Importers of Plastic Waste
In honor of International Plastic Bag-Free day, today’s graphic uses data from The Guardian to uncover where the world’s plastic waste comes from, and who receives the bulk of these flows.
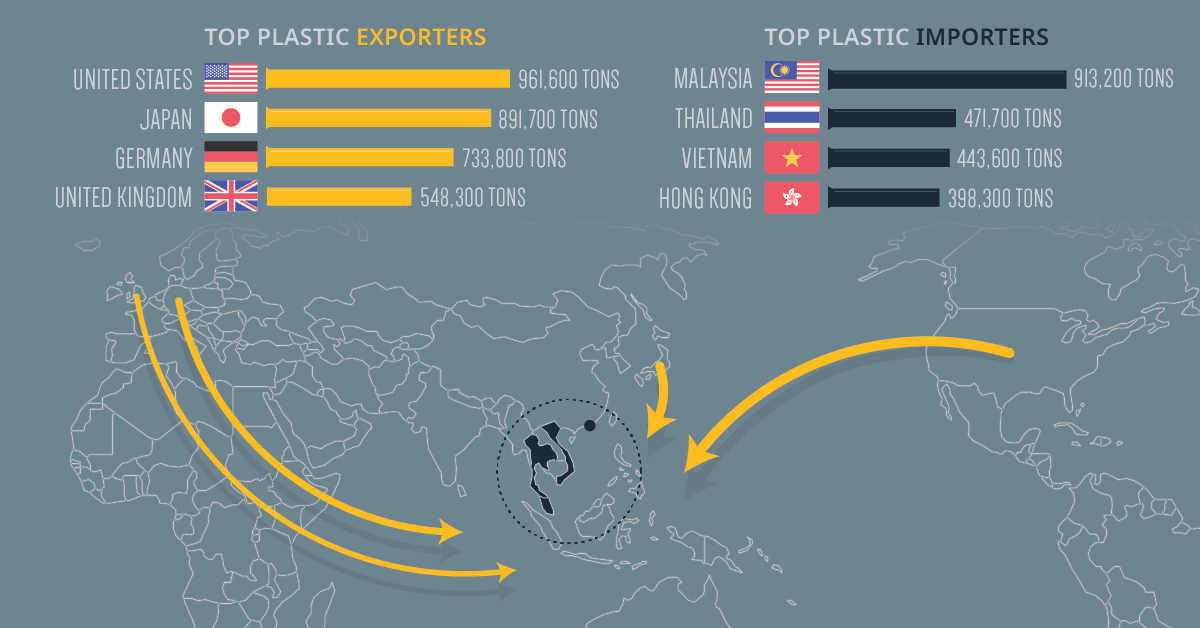
| Top Exporters, Jan-Nov 2018 | Top Importers, Jan-Nov 2018 | ||
|---|---|---|---|
| 🇺🇸 United States | 961,563 tons | 🇲🇾 Malaysia | 913,165 tons |
| 🇯🇵 Japan | 891,719 tons | 🇹🇭 Thailand | 471,724 tons |
| 🇩🇪 Germany | 733,756 tons | 🇻🇳 Vietnam | 443,615 tons |
| 🇬🇧 United Kingdom | 548,256 tons | 🇭🇰 Hong Kong | 398,261 tons |
The U.S. could fill up 68,000 shipping containers with its annual plastic waste exports. Put another way, 6,000 blue whales would weigh less than this nearly one million tons of waste exports.
Given the amount of plastic which ends up in our oceans, this comparison is just cause for alarm. But one interesting thing to note is that overall totals have halved since 2016:
- Top 21 total exports (Jan-Nov 2016): 11,342,439 tons
- Top 21 total exports (Jan-Nov 2018): 5,828,257 tons
- Percentage change (2016 to 2018): -49%
The world didn’t suddenly stop producing plastic waste overnight. So what caused the decline?
China Cuts Ties with International Plastic Imports
Over recent years, the trajectory of plastic exports has mimicked the movement of plastic waste into China, including the steep plummet that starts in 2018. After being the world’s dumping ground for decades, China enacted a new policy, dubbed “National Sword”, to ban foreign recyclables. The ban, which includes plastics, has left the world scrambling to find other outlets for its waste.
In response, top exporters quickly turned to other countries in Southeast Asia, such as Malaysia, Vietnam, and Thailand.
That didn’t completely stop plastic waste from seeping through, though. China previously imported 600,000 tons of plastic monthly, but since the policy only restricted 24 types of solid waste, 30,000 tons per month still entered the country post-ban, primarily from these countries:
- 🇮🇩 Indonesia: 7,000 tons per month
- 🇲🇾 Malaysia: 6,000 tons per month
- 🇺🇸 United States: 5,500 tons per month
- 🇯🇵 Japan: 4,000 tons per month
Many countries bearing the load of the world’s garbage are planning to follow in China’s footsteps and issue embargoes of their own. What does that mean for the future?
Recycle and Reuse; But Above All, Reduce
The immense amounts of plastic waste sent overseas include recycled and recyclable materials. That’s because most countries don’t have the means to manage their recycling properly, contrary to public belief. What is being done to mitigate waste in the future?
- Improve domestic recycling
Waste Management is the largest recycling company in the United States. In 2018, it put $110 million towards building more plastic recycling infrastructure.
Meanwhile, tech giant Amazon invested $10 million in a fund that creates recycling infrastructure and services in different cities. - Reduce single-use plastics
Recycling on its own may not be enough, which is why countries are thinking bigger to cut down on “throwaway” culture.
The European Union passed a directive to ban disposable plastics and polystyrene “clamshell” containers, among other items, by 2021. More recently, California passed an ambitious bill to phase out single-use plastics by 2030.


Green
Ranking the Top 15 Countries by Carbon Tax Revenue
This graphic highlights France and Canada as the global leaders when it comes to generating carbon tax revenue.


Top 15 Countries by Carbon Tax Revenue
This was originally posted on our Voronoi app. Download the app for free on iOS or Android and discover incredible data-driven charts from a variety of trusted sources.
Carbon taxes are designed to discourage CO2 emissions by increasing the cost of carbon-intensive activities and incentivizing the adoption of cleaner energy alternatives.
In this graphic we list the top 15 countries by carbon tax revenue as of 2022. The data is from the World Bank’s State and Trends of Carbon Pricing Report, published in April 2023.
France and Canada Lead in Global Carbon Tax Revenue
In 2022, the top 15 countries generated approximately $30 billion in revenue from carbon taxes.
France and Canada lead in this regard, accounting for over half of the total amount. Both countries have implemented comprehensive carbon pricing systems that cover a wide range of sectors, including transportation and industry, and they have set relatively high carbon tax rates.
| Country | Government revenue in 2022 ($ billions) |
|---|---|
| 🇫🇷 France | $8.9 |
| 🇨🇦 Canada | $7.8 |
| 🇸🇪 Sweden | $2.3 |
| 🇳🇴 Norway | $2.1 |
| 🇯🇵 Japan | $1.8 |
| 🇫🇮 Finland | $1.7 |
| 🇨🇭 Switzerland | $1.6 |
| 🇬🇧 United Kingdom | $0.9 |
| 🇮🇪 Ireland | $0.7 |
| 🇩🇰 Denmark | $0.5 |
| 🇵🇹 Portugal | $0.5 |
| 🇦🇷 Argentina | $0.3 |
| 🇲🇽 Mexico | $0.2 |
| 🇸🇬 Singapore | $0.1 |
| 🇿🇦 South Africa | $0.1 |
In Canada, the total carbon tax revenue includes both national and provincial taxes.
While carbon pricing has been recognized internationally as one of the more efficient mechanisms for reducing CO2 emissions, research is divided over what the global average carbon price should be to achieve the goals of the Paris Climate Agreement, which aims to limit global warming to 1.5–2°C by 2100 relative to pre-industrial levels.
A recent study has shown that carbon pricing must be supported by other policy measures and innovations. According to a report from Queen’s University, there is no feasible carbon pricing scenario that is high enough to limit emissions sufficiently to achieve anything below 2.4°C warming on its own.

-

 Real Estate2 weeks ago
Visualizing America’s Shortage of Affordable Homes
-

 Technology1 week ago
Ranked: Semiconductor Companies by Industry Revenue Share
-

 Money1 week ago
Which States Have the Highest Minimum Wage in America?
-

 Real Estate1 week ago
Ranked: The Most Valuable Housing Markets in America
-

 Business1 week ago
Charted: Big Four Market Share by S&P 500 Audits
-

 AI1 week ago
The Stock Performance of U.S. Chipmakers So Far in 2024
-

 Misc2 weeks ago
Almost Every EV Stock is Down After Q1 2024
-

 Money2 weeks ago
Where Does One U.S. Tax Dollar Go?