Green
Mapping the Flow of the World’s Plastic Waste
Mapping the Flow of the World’s Plastic Waste
The first plastic material, Bakelite, was invented in 1907. It made its way into everything you can imagine: telephones, chess pieces, Chanel jewelry, and electric guitars.
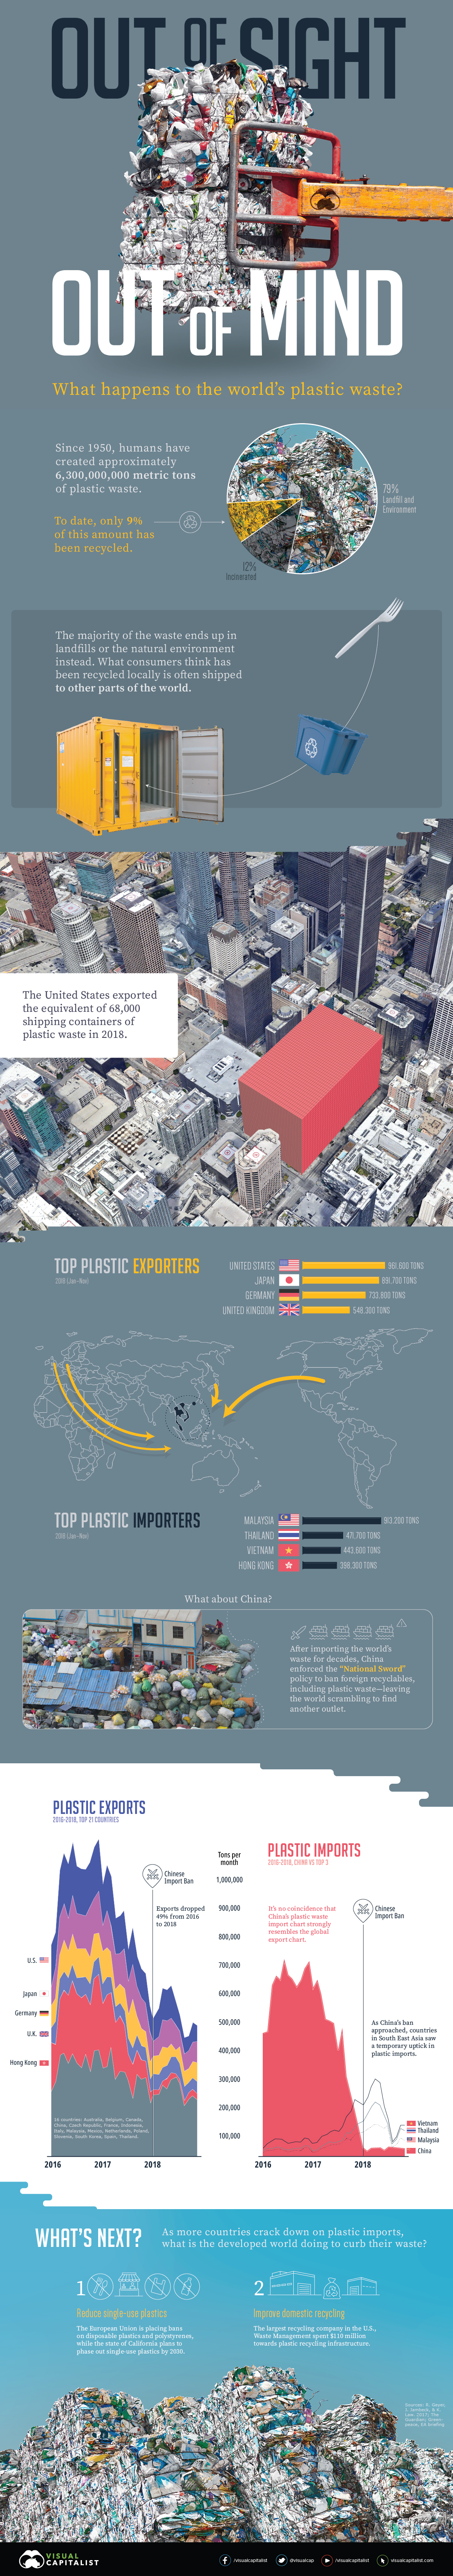
But it was in 1950 that our thirst for plastic truly began. In just 65 years, plastic production soared almost 200 times, resulting in about 6,300 million metric tons of waste today.
How does the world deal with this much debris? The truth is, a lot of plastic waste—both trash and recycled materials—is often shipped overseas to become someone else’s problem.
The Top Exporters and Importers of Plastic Waste
In honor of International Plastic Bag-Free day, today’s graphic uses data from The Guardian to uncover where the world’s plastic waste comes from, and who receives the bulk of these flows.
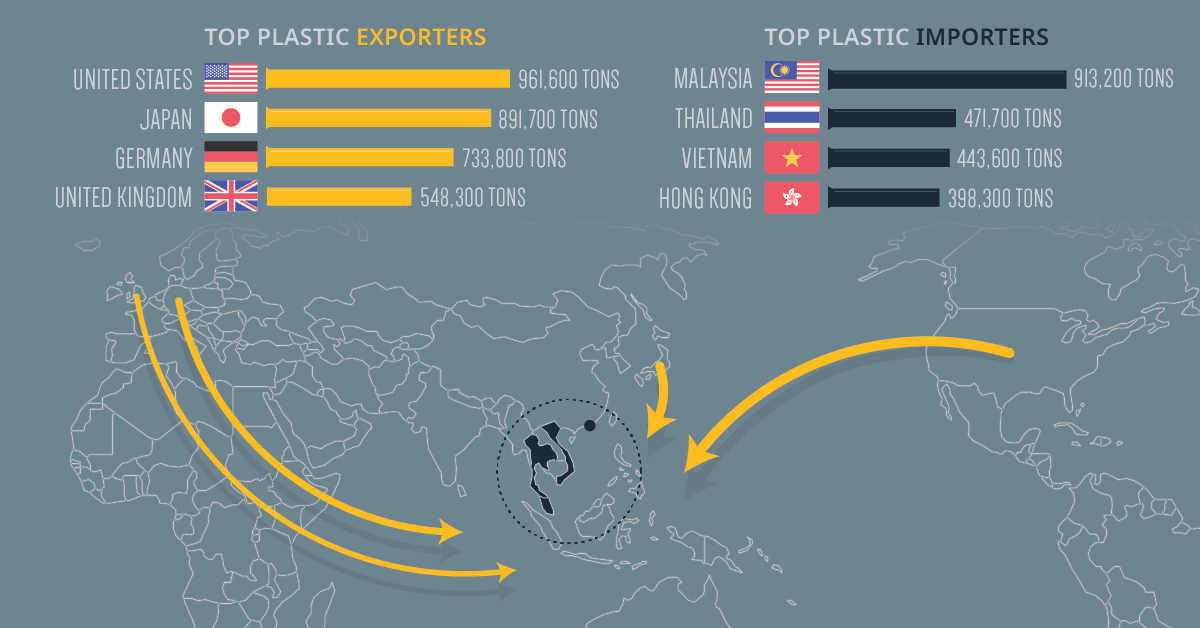
| Top Exporters, Jan-Nov 2018 | Top Importers, Jan-Nov 2018 | ||
|---|---|---|---|
| 🇺🇸 United States | 961,563 tons | 🇲🇾 Malaysia | 913,165 tons |
| 🇯🇵 Japan | 891,719 tons | 🇹🇭 Thailand | 471,724 tons |
| 🇩🇪 Germany | 733,756 tons | 🇻🇳 Vietnam | 443,615 tons |
| 🇬🇧 United Kingdom | 548,256 tons | 🇭🇰 Hong Kong | 398,261 tons |
The U.S. could fill up 68,000 shipping containers with its annual plastic waste exports. Put another way, 6,000 blue whales would weigh less than this nearly one million tons of waste exports.
Given the amount of plastic which ends up in our oceans, this comparison is just cause for alarm. But one interesting thing to note is that overall totals have halved since 2016:
- Top 21 total exports (Jan-Nov 2016): 11,342,439 tons
- Top 21 total exports (Jan-Nov 2018): 5,828,257 tons
- Percentage change (2016 to 2018): -49%
The world didn’t suddenly stop producing plastic waste overnight. So what caused the decline?
China Cuts Ties with International Plastic Imports
Over recent years, the trajectory of plastic exports has mimicked the movement of plastic waste into China, including the steep plummet that starts in 2018. After being the world’s dumping ground for decades, China enacted a new policy, dubbed “National Sword”, to ban foreign recyclables. The ban, which includes plastics, has left the world scrambling to find other outlets for its waste.
In response, top exporters quickly turned to other countries in Southeast Asia, such as Malaysia, Vietnam, and Thailand.
That didn’t completely stop plastic waste from seeping through, though. China previously imported 600,000 tons of plastic monthly, but since the policy only restricted 24 types of solid waste, 30,000 tons per month still entered the country post-ban, primarily from these countries:
- 🇮🇩 Indonesia: 7,000 tons per month
- 🇲🇾 Malaysia: 6,000 tons per month
- 🇺🇸 United States: 5,500 tons per month
- 🇯🇵 Japan: 4,000 tons per month
Many countries bearing the load of the world’s garbage are planning to follow in China’s footsteps and issue embargoes of their own. What does that mean for the future?
Recycle and Reuse; But Above All, Reduce
The immense amounts of plastic waste sent overseas include recycled and recyclable materials. That’s because most countries don’t have the means to manage their recycling properly, contrary to public belief. What is being done to mitigate waste in the future?
- Improve domestic recycling
Waste Management is the largest recycling company in the United States. In 2018, it put $110 million towards building more plastic recycling infrastructure.
Meanwhile, tech giant Amazon invested $10 million in a fund that creates recycling infrastructure and services in different cities. - Reduce single-use plastics
Recycling on its own may not be enough, which is why countries are thinking bigger to cut down on “throwaway” culture.
The European Union passed a directive to ban disposable plastics and polystyrene “clamshell” containers, among other items, by 2021. More recently, California passed an ambitious bill to phase out single-use plastics by 2030.


Green
How Carbon Credits Can Help Close the Climate Funding Gap
To keep a 1.5℃ world within reach, global emissions need to fall by as much as 45% by 2030, and carbon credits could help close the gap.


How Carbon Credits Can Help Close the Climate Funding Gap
Governments around the world have committed to the goals of the Paris Agreement, but their climate pledges are insufficient. To keep a 1.5℃ world within reach, global emissions need to fall by as much as 45% by 2030.
Bold and immediate action is essential, but so are resources that will make it happen.
In this graphic, we have partnered with Carbon Streaming to look at the role that the voluntary carbon market and carbon credits can play in closing that gap.
More Funds are Needed for Climate Finance
According to data from the Climate Policy Initiative, climate finance, which includes funds for both adaptation and mitigation, needs to increase at least five-fold, from $1.3T in 2021/2022, to an average $8.6T annually until 2030, and then to just over $10T in the two decades leading up to 2050.
That adds up to a very large number, but consider that in 2022, $7.0T went to fossil fuel subsidies, which almost covers the annual estimated outlay. And the world has shown that when pressed, governments can come up with the money, if the global pandemic is any indication.
Mobilizing Carbon Finance to the Developing World
But the same cannot be said of the developing world, where debt, inequality, and poverty reduce the ability of governments to act. And this is where carbon credits can play an important role. According to analyses from Ecosystem Marketplace, carbon credits help move capital from developed countries, to where funds are needed in the developing world.
For example, in 2019, 69.2% of the carbon credits by volume in the voluntary carbon market were purchased by buyers in Europe, and nearly a third from North America. Compare that to over 90% of the volume of carbon credits sold in the voluntary carbon market in 2022 came from projects that were located outside of those two regions.
Carbon Credits Can Complement Decarbonization Efforts
Carbon credits can also complement decarbonization efforts in the corporate world, where more and more companies have been signing up to reduce emissions. According to the 2022 monitoring report from the Science Based Targets initiative, 4,230 companies around the world had approved targets and commitments, which represented an 88% increase from the prior year. However, as of year end 2022, combined scope 1 and 2 emissions covered by science-based targets totaled approximately 2 GtCO2e, which represents just a fraction of global emissions.
The fine print is that this is just scope 1 and 2 emissions, and doesn’t include scope 3 emissions, which can account for more than 70% of a company’s total emissions. And as these emissions come under greater and greater scrutiny the closer we get to 2030 and beyond, the voluntary carbon credit market could expand exponentially to help meet the need to compensate for these emissions.
Potential Carbon Credit Market Size in 2030
OK, but how big? In 2022, the voluntary carbon credit market was around $2B, but some analysts predict that it could grow to between $5–250 billion by 2030.
| Firm | Low Estimate | High Estimate |
|---|---|---|
| Bain & Company | $15B | $30B |
| Barclays | N/A | $250B |
| Citigroup | $5B | $50B |
| McKinsey & Company | $5B | $50B |
| Morgan Stanley | N/A | $100B |
| Shell / Boston Consulting Group | $10B | $40B |
Morgan Stanley and Barclays were the most bullish on the size of the voluntary carbon credit market in 2030, but the latter firm was even more optimistic about 2050, and predicted that the voluntary carbon credit market could grow to a colossal $1.5 trillion.
Carbon Streaming is Focused on Carbon Credit Integrity
Ultimately, carbon credits could have an important role to play in marshaling the resources needed to keep the world on track to net zero by 2050, and avoiding the worst consequences of a warming world.
Carbon Streaming uses streaming transactions, a proven and flexible funding model, to scale high-integrity carbon credit projects to advance global climate action and UN Sustainable Development Goals.
Learn more at www.carbonstreaming.com.

-

 Green1 week ago
Ranking the Top 15 Countries by Carbon Tax Revenue
This graphic highlights France and Canada as the global leaders when it comes to generating carbon tax revenue.
-

 Green1 week ago
Ranked: The Countries With the Most Air Pollution in 2023
South Asian nations are the global hotspot for pollution. In this graphic, we rank the world’s most polluted countries according to IQAir.
-

 Environment2 weeks ago
Top Countries By Forest Growth Since 2001
One country is taking reforestation very seriously, registering more than 400,000 square km of forest growth in two decades.
-

 Green3 weeks ago
Ranked: Top Countries by Total Forest Loss Since 2001
The country with the most forest loss since 2001 lost as much forest cover as the next four countries combined.
-

 Markets2 months ago
The World’s Top Cocoa Producing Countries
Here are the largest cocoa producing countries globally—from Côte d’Ivoire to Brazil—as cocoa prices hit record highs.
-

 Environment2 months ago
Charted: Share of World Forests by Country
We visualize which countries have the biggest share of world forests by area—and while country size plays a factor, so too, does the environment.

-

 Markets1 week ago
U.S. Debt Interest Payments Reach $1 Trillion
-

 Business2 weeks ago
Charted: Big Four Market Share by S&P 500 Audits
-

 Real Estate2 weeks ago
Ranked: The Most Valuable Housing Markets in America
-

 Money2 weeks ago
Which States Have the Highest Minimum Wage in America?
-

 AI2 weeks ago
Ranked: Semiconductor Companies by Industry Revenue Share
-

 Markets2 weeks ago
Ranked: The World’s Top Flight Routes, by Revenue
-

 Demographics2 weeks ago
Population Projections: The World’s 6 Largest Countries in 2075
-

 Markets2 weeks ago
The Top 10 States by Real GDP Growth in 2023