Economy
Mapping The Biggest Companies By Market Cap in 60 Countries
View the full-size version of this infographic
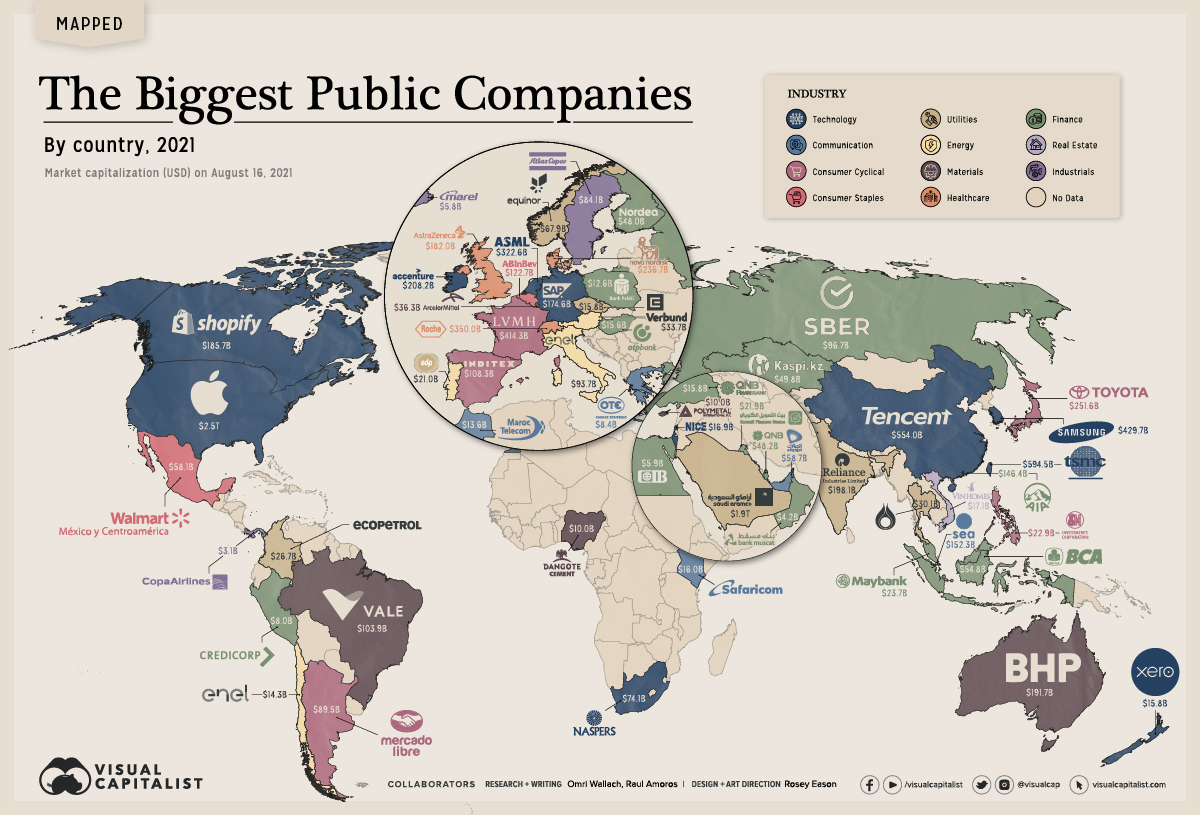


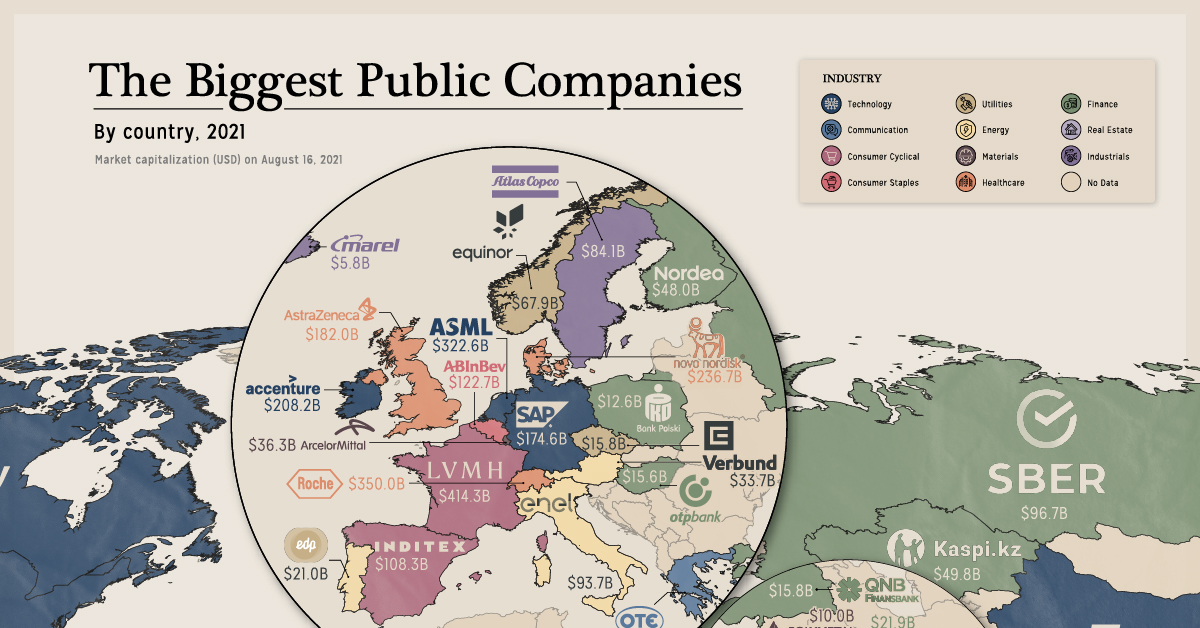
The Biggest Companies By Market Cap in 60 Countries
Tech giants are increasingly making up more of the Fortune 500, but the world’s biggest companies by market cap aren’t so cut and dry.
Despite accounting for the largest market caps worldwide—with trillion-dollar companies like Apple and contenders including Tencent and Samsung—tech wealth is largely concentrated in just a handful of countries.
So what are the biggest companies in each country? We mapped the largest company by market cap across 60 countries in August 2021 using market data from CompaniesMarketCap, TradingView, and MarketScreener.
What are the Largest Companies in the World?
The world has 60+ stock exchanges, and each one has a top company. We looked at the largest local company, since many of the world’s largest firms trade on multiple exchanges, and converted market cap to USD.
| Country | Company | Industry | Market Cap (August 2021) |
|---|---|---|---|
| USA | Apple | Technology | $2.5T |
| Saudi Arabia | Saudi Aramco | Energy | $1.9T |
| Taiwan | TSMC | Technology | $594.5B |
| China | Tencent | Technology | $554.0B |
| South Korea | Samsung | Technology | $429.7B |
| France | LVMH | Consumer Cyclical | $414.3B |
| Switzerland | Roche | Healthcare | $350.0B |
| Netherlands | ASML | Technology | $322.6B |
| Japan | Toyota | Consumer Cyclical | $251.6B |
| Denmark | Novo Nordisk | Healthcare | $236.7B |
| Ireland | Accenture | Technology | $208.2B |
| India | Reliance Industries | Energy | $198.1B |
| Australia | BHP Group | Materials | $191.7B |
| Canada | Shopify | Technology | $185.7B |
| UK | Astrazeneca | Healthcare | $182.0B |
| Germany | SAP | Technology | $174.6B |
| Singapore | SEA | Technology | $152.3B |
| Hong Kong | AIA | Financials | $146.4B |
| Belgium | Anheuser-Busch Inbev | Consumer Staples | $122.7B |
| Spain | Inditex | Consumer Cyclical | $108.3B |
| Brazil | VALE | Materials | $103.9B |
| Russia | Sberbank | Financials | $96.7B |
| Italy | Enel | Utilities | $93.7B |
| Argentina | MercadoLibre | Consumer Cyclical | $89.5B |
| Sweden | Atlas Copco | Industrials | $84.1B |
| South Africa | Naspers | Technology | $74.1B |
| Norway | Equinor | Energy | $67.9B |
| UAE | Etisalat | Communication | $58.7B |
| Mexico | Walmex | Consumer Staples | $58.1B |
| Indonesia | Bank Cental Asia | Financials | $54.8B |
| Kazakhstan | Kaspi.kz | Financials | $49.8B |
| Qatar | QNB | Financials | $48.2B |
| Finland | Nordea Bank | Financials | $48.0B |
| Luxembourg | ArcelorMittal | Materials | $36.3B |
| Austria | Verbund | Utilities | $33.7B |
| Thailand | PTT PCL | Energy | $30.1B |
| Colombia | Ecopetrol | Energy | $26.7B |
| Malaysia | Maybank | Financials | $23.7B |
| Philippines | SM Investments | Consumer Cyclical | $22.9B |
| Kuwait | Kuwait Finance House | Financials | $21.9B |
| Portugal | EDP Group | Utilities | $21.0B |
| Vietnam | Vinhomes | Real Estate | $17.1B |
| Israel | NICE | Technology | $16.9B |
| Kenya | Safaricom | Communication | $16.0B |
| Czech Republic | ÄŒEZ Group | Energy | $15.8B |
| New Zealand | Xero | Technology | $15.8B |
| Turkey | QNB Finansbank | Financials | $15.8B |
| Hungary | OTP Bank | Financials | $15.6B |
| Chile | Enel Americas | Utilities | $14.3B |
| Morocco | Maroc Telecom | Communication | $13.6B |
| Poland | PKO Bank Polski | Financials | $12.6B |
| Cyprus | Polymetal | Materials | $10.0B |
| Nigeria | Dangote Group | Materials | $10.0B |
| Bahrain | Ahli United Bank | Financials | $8.6B |
| Greece | OTE Group | Communication | $8.4B |
| Peru | Credicorp | Financials | $8.0B |
| Egypt | Commercial International Bank | Financials | $5.9B |
| Iceland | Marel | Industrials | $5.8B |
| Oman | Bank Muscat | Financials | $4.2B |
| Panama | Copa Holdings | Industrials | $3.1B |
Many are former monopolies or massive conglomerates that have grown in the public space, such as South Africa’s Naspers and India’s Reliance Industries.
Others are local subsidiaries of foreign corporations, including Mexico’s Walmex, Chile’s Enel and Turkey’s QNB Finansbank.
But even more noticeable is the economic discrepancy. Apple and Saudi Aramco are worth trillions of dollars, while the smallest companies we tracked—including Panama’s Copa Group and Oman’s Bank Muscat—are worth less than $5 billion.
Finance and Tech Dominate The Biggest Companies By Market Cap
Across the board, the largest companies were able to accumulate wealth and value.
Some are newer to the top thanks to recent success. Canada’s Shopify has become one of the world’s largest e-commerce providers, and the UK’s AstraZeneca developed one of the world’s COVID-19 vaccines.
But the reality is most companies here are old guards that grew on existing resources, or in the case of banks, accumulated wealth.
| Industry | Biggest Companies by Country |
|---|---|
| Financials | 16 |
| Technology | 12 |
| Energy | 6 |
| Materials | 5 |
| Communication | 4 |
| Consumer Cyclical | 4 |
| Utilities | 4 |
| Healthcare | 3 |
| Industrials | 3 |
| Consumer Staples | 2 |
| Real Estate | 1 |
Banks were the most commonly found at the top of each country’s stock market. Closely behind were oil and gas giants, mining companies, and former state-owned corporations that drove most of a country’s wealth generation.
But as more economies develop and catch up to Western economies (where tech is dominant), newer innovative companies will likely put up a fight for each country’s top company crown.


Markets
Ranked: The Largest U.S. Corporations by Number of Employees
We visualized the top U.S. companies by employees, revealing the massive scale of retailers like Walmart, Target, and Home Depot.


The Largest U.S. Corporations by Number of Employees
This was originally posted on our Voronoi app. Download the app for free on Apple or Android and discover incredible data-driven charts from a variety of trusted sources.
Revenue and profit are common measures for measuring the size of a business, but what about employee headcount?
To see how big companies have become from a human perspective, we’ve visualized the top U.S. companies by employees. These figures come from companiesmarketcap.com, and were accessed in March 2024. Note that this ranking includes publicly-traded companies only.
Data and Highlights
The data we used to create this list of largest U.S. corporations by number of employees can be found in the table below.
| Company | Sector | Number of Employees |
|---|---|---|
| Walmart | Consumer Staples | 2,100,000 |
| Amazon | Consumer Discretionary | 1,500,000 |
| UPS | Industrials | 500,000 |
| Home Depot | Consumer Discretionary | 470,000 |
| Concentrix | Information Technology | 440,000 |
| Target | Consumer Staples | 440,000 |
| Kroger | Consumer Staples | 430,000 |
| UnitedHealth | Health Care | 400,000 |
| Berkshire Hathaway | Financials | 383,000 |
| Starbucks | Consumer Discretionary | 381,000 |
| Marriott International | Consumer Discretionary | 377,000 |
| Cognizant | Information Technology | 346,600 |
Retail and Logistics Top the List
Companies like Walmart, Target, and Kroger have a massive headcount due to having many locations spread across the country, which require everything from cashiers to IT professionals.
Moving goods around the world is also highly labor intensive, explaining why UPS has half a million employees globally.
Below the Radar?
Two companies that rank among the largest U.S. corporations by employees which may be less familiar to the public include Concentrix and Cognizant. Both of these companies are B2B brands, meaning they primarily work with other companies rather than consumers. This contrasts with brands like Amazon or Home Depot, which are much more visible among average consumers.
A Note on Berkshire Hathaway
Warren Buffett’s company doesn’t directly employ 383,000 people. This headcount actually includes the employees of the firm’s many subsidiaries, such as GEICO (insurance), Dairy Queen (retail), and Duracell (batteries).
If you’re curious to see how Buffett’s empire has grown over the years, check out this animated graphic that visualizes the growth of Berkshire Hathaway’s portfolio from 1994 to 2022.

-

 Technology2 weeks ago
Ranked: The Most Popular Smartphone Brands in the U.S.
-

 Automotive1 week ago
Almost Every EV Stock is Down After Q1 2024
-

 Money1 week ago
Where Does One U.S. Tax Dollar Go?
-

 Green2 weeks ago
Ranked: Top Countries by Total Forest Loss Since 2001
-

 Real Estate2 weeks ago
Visualizing America’s Shortage of Affordable Homes
-

 Maps2 weeks ago
Mapped: Average Wages Across Europe
-

 Mining2 weeks ago
Charted: The Value Gap Between the Gold Price and Gold Miners
-

 Demographics2 weeks ago
Visualizing the Size of the Global Senior Population