Misc
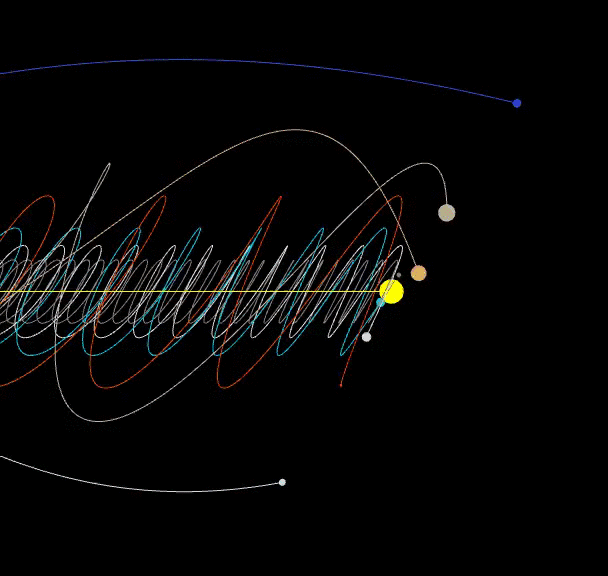
A Map of Every Object in Our Solar System
View the full-size version of this infographic.

A Map of Every Object in Our Solar System
View the high resolution version of this incredible map by clicking here
The path through the solar system is a rocky road.
Asteroids, comets, planets and moons and all kinds of small bodies of rock, metals, minerals and ice are continually moving as they orbit the sun. In contrast to the simple diagrams we’re used to seeing, our solar system is a surprisingly crowded place.
In this stunning visualization, biologist Eleanor Lutz painstakingly mapped out every known object in Earth’s solar system (>10km in diameter), hopefully helping you on your next journey through space.
Data-Driven Solar System
This particular visualization combines five different data sets from NASA:
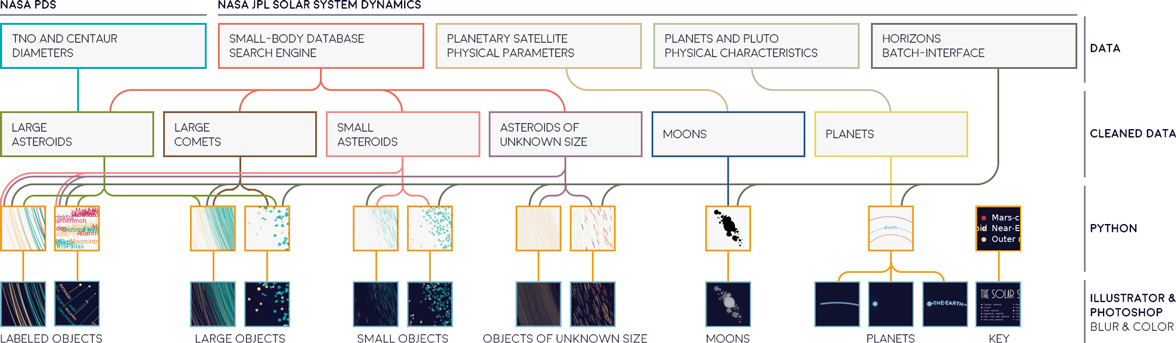
Source: Tabletop Whale
From this data, Lutz mapped all the orbits of over 18,000 asteroids in the solar system, including 10,000 that were at least 10km in diameter, and about 8,000 objects of unknown size.
This map shows each asteroid’s position on New Year’s Eve 1999.
The Pull of Gravity
When plotting the objects, Lutz observed that the solar system is not arranged in linear distances. Rather, it is logarithmic, with exponentially more objects situated close to the sun. Lutz made use of this observation to space out their various orbits of the 18,000 objects in her map.
What she is visualizing is the pull of the sun, as the majority of objects tend to gravitate towards the inner part of the solar system. This is the same observation Sir Isaac Newton used to develop the concept of gravity, positing that heavier objects produce a bigger gravitational pull than lighter ones. Since the sun is the largest object in our solar system, it has the strongest gravitational pull.
If the sun is continually pulling at the planets, why don’t they all fall into the sun? It’s because the planets are moving sideways at the same time.
Without that sideways motion, the objects would fall to the center – and without the pull toward the center, it would go flying off in a straight line.
This explains the clustering of patterns in solar systems, and why the farther you travel through the solar system, the bigger the distance and the fewer the objects.
The Top Ten Non-Planets in the Solar System
We all know that the sun and the planets are the largest objects in our corner of the universe, but there are many noteworthy objects as well.
| Rank | Name | Diameter | Notes |
|---|---|---|---|
| 1 | Ganymede | 3,273 mi (5,268 km) | Jupiter's largest moon |
| 2 | Titan | 3,200 mi (5,151 km) | Saturn's largest moon |
| 3 | Callisto | 2,996 mi (4,821 km) | Jupiter's second largest moon |
| 4 | Io | 2,264 mi (3,643 km) | Moon orbiting Jupiter |
| 5 | Moon | 2,159 mi (3,474 km) | Earth's only moon |
| 6 | Europa | 1,940 mi (3,122 km) | Moon orbiting Jupiter |
| 7 | Triton | 1,680 mi (2,710 km) | Neptune's largest moon |
| 8 | Pluto | 1,476 mi (2,376 km) | Dwarf planet |
| 9 | Eris | 1,473 mi (2,372 km) | Dwarf planet |
| 10 | Titania | 981 mi (1,578 km) | Uranus' largest moon |
Source: Ourplnt.com
While the map only shows objects greater than 10 kilometers in diameter, there are plenty of smaller objects to watch out for as well.
An Atlas of Space
This map is one among many of Lutz’s space related visualizations. She is also in the process of creating an Atlas of Space to showcase her work.
As we reach further and further beyond the boundaries of earth, her work may come in handy the next time you make a wrong turn at Mars and find yourself lost in an asteroid belt.
“I knew I shoulda taken that left turn at Albuquerque!”


VC+
VC+: Get Our Key Takeaways From the IMF’s World Economic Outlook
A sneak preview of the exclusive VC+ Special Dispatch—your shortcut to understanding IMF’s World Economic Outlook report.

Have you read IMF’s latest World Economic Outlook yet? At a daunting 202 pages, we don’t blame you if it’s still on your to-do list.
But don’t worry, you don’t need to read the whole April release, because we’ve already done the hard work for you.
To save you time and effort, the Visual Capitalist team has compiled a visual analysis of everything you need to know from the report—and our upcoming VC+ Special Dispatch will be available exclusively to VC+ members on Thursday, April 25th.
If you’re not already subscribed to VC+, make sure you sign up now to receive the full analysis of the IMF report, and more (we release similar deep dives every week).
For now, here’s what VC+ members can expect to receive.
Your Shortcut to Understanding IMF’s World Economic Outlook
With long and short-term growth prospects declining for many countries around the world, this Special Dispatch offers a visual analysis of the key figures and takeaways from the IMF’s report including:
- The global decline in economic growth forecasts
- Real GDP growth and inflation forecasts for major nations in 2024
- When interest rate cuts will happen and interest rate forecasts
- How debt-to-GDP ratios have changed since 2000
- And much more!

Get the Full Breakdown in the Next VC+ Special Dispatch
VC+ members will receive the full Special Dispatch on Thursday, April 25th.
Make sure you join VC+ now to receive exclusive charts and the full analysis of key takeaways from IMF’s World Economic Outlook.
Don’t miss out. Become a VC+ member today.
What You Get When You Become a VC+ Member
VC+ is Visual Capitalist’s premium subscription. As a member, you’ll get the following:
- Special Dispatches: Deep dive visual briefings on crucial reports and global trends
- Markets This Month: A snappy summary of the state of the markets and what to look out for
- The Trendline: Weekly curation of the best visualizations from across the globe
- Global Forecast Series: Our flagship annual report that covers everything you need to know related to the economy, markets, geopolitics, and the latest tech trends
- VC+ Archive: Hundreds of previously released VC+ briefings and reports that you’ve been missing out on, all in one dedicated hub
You can get all of the above, and more, by joining VC+ today.

-

 Markets1 week ago
U.S. Debt Interest Payments Reach $1 Trillion
-

 Business2 weeks ago
Charted: Big Four Market Share by S&P 500 Audits
-

 Real Estate2 weeks ago
Ranked: The Most Valuable Housing Markets in America
-

 Money2 weeks ago
Which States Have the Highest Minimum Wage in America?
-

 AI2 weeks ago
Ranked: Semiconductor Companies by Industry Revenue Share
-

 Markets2 weeks ago
Ranked: The World’s Top Flight Routes, by Revenue
-

 Demographics2 weeks ago
Population Projections: The World’s 6 Largest Countries in 2075
-

 Markets2 weeks ago
The Top 10 States by Real GDP Growth in 2023