Business
Mapped: The Uneven Recovery of U.S. Small Businesses
Mapped: The Uneven Recovery of U.S. Small Businesses
Small businesses are the backbone of the U.S. economy, employing nearly half of the private sector workforce.
Unfortunately, lockdown and work-from-home measures brought about by COVID-19 have disproportionately affected small businesses – particularly in the leisure and hospitality sectors.
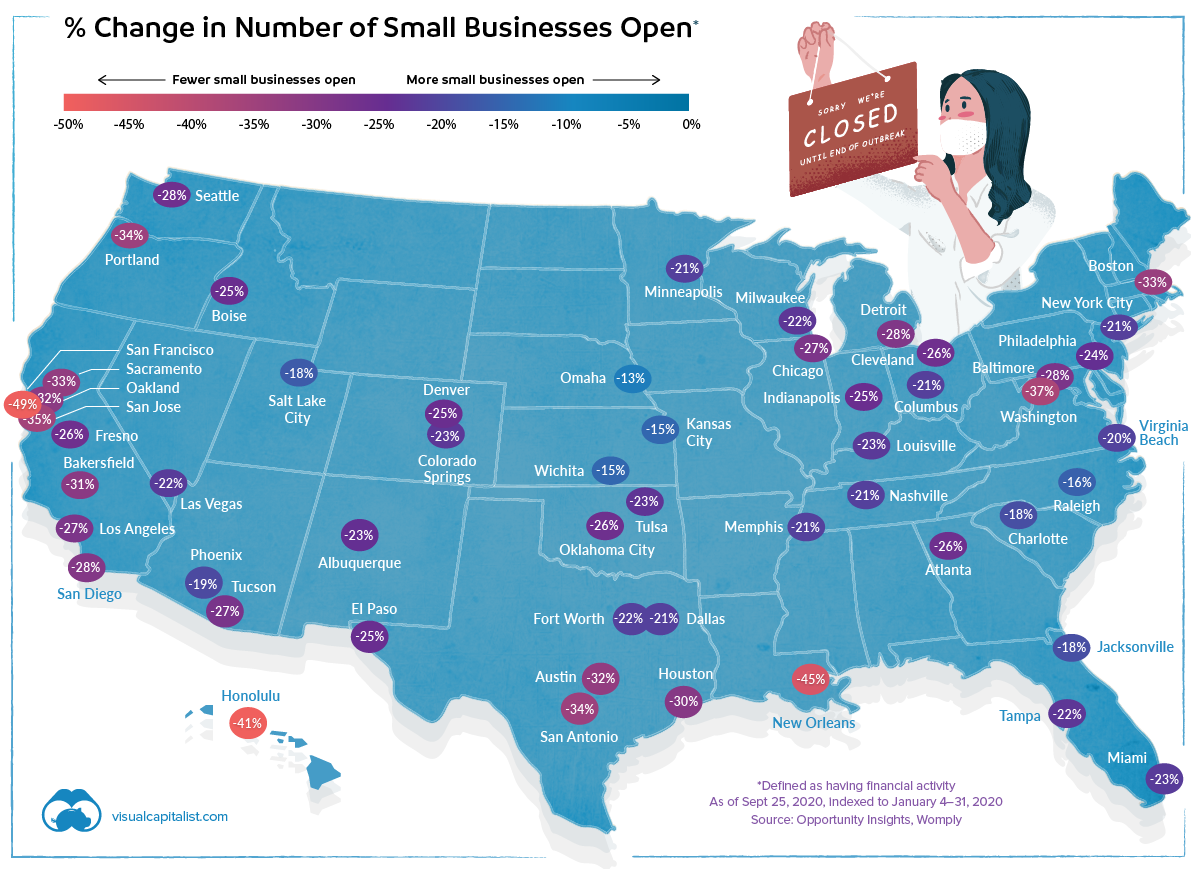
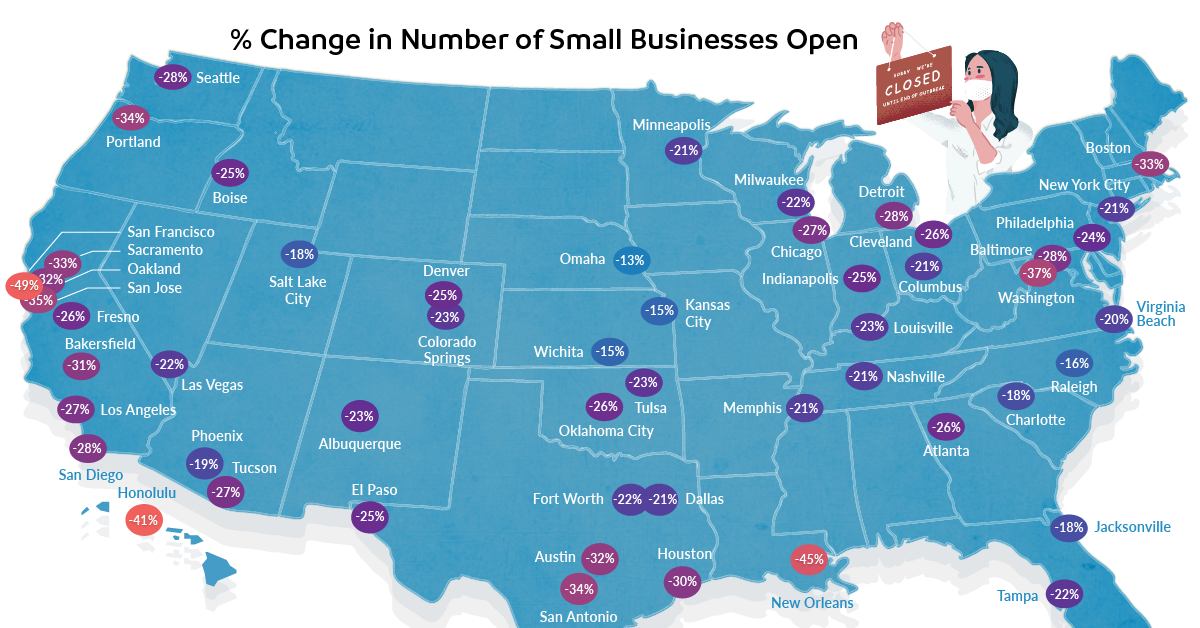
As metro-level data from Opportunity Insights points out, geography makes a great deal of difference in the proportion of U.S. small businesses that have flipped their open sign. While some cities are mostly back to business as usual, others are in a situation where the majority of small businesses are still shuttered.
The Big Picture
In the U.S. as a whole, data suggests that nearly a quarter of all small businesses remain closed. Of course, the situation on the ground differs from place to place. Here’s how cities around the country are doing, sorted by percentage of small businesses closed as of September 2020:
| Metros | Small Businesses Closed | Small Businesses Closed (Leisure & Hosp.) |
|---|---|---|
| San Francisco | -49% | -65% |
| New Orleans | -45% | -72% |
| Honolulu | -41% | -39% |
| Washington DC | -37% | -55% |
| San Jose | -35% | -41% |
| Portland | -34% | -46% |
| San Antonio | -34% | -60% |
| Sacramento | -33% | -43% |
| Boston | -33% | -42% |
| Oakland | -32% | -52% |
| Austin | -32% | -65% |
| Bakersfield | -31% | -64% |
| Houston | -30% | -58% |
| Seattle | -28% | -47% |
| San Diego | -28% | -41% |
| Baltimore | -28% | -43% |
| Detroit | -28% | -44% |
| Los Angeles | -27% | -39% |
| Chicago | -27% | -37% |
| Tucson | -27% | -37% |
| Atlanta | -26% | -33% |
| Fresno | -26% | -50% |
| Oklahoma City | -26% | -56% |
| Cleveland | -26% | -39% |
| Denver | -26% | -56% |
| Indianapolis | -25% | -29% |
| Denver | -25% | -38% |
| El Paso | -25% | -34% |
| Philadelphia | -24% | -34% |
| Tulsa | -23% | -40% |
| Albuquerque | -23% | -42% |
| Colorado Springs | -23% | -37% |
| Louisville | -23% | -25% |
| Miami | -23% | -38% |
| Fort Worth | -22% | -34% |
| Las Vegas | -22% | -35% |
| Tampa | -22% | -45% |
| Milwaukee | -22% | -30% |
| New York City | -21% | -40% |
| Dallas | -21% | -38% |
| Memphis | -21% | -37% |
| Minneapolis | -21% | -36% |
| Nashville | -21% | -39% |
| Columbus | -21% | -35% |
| Phoenix | -19% | -36% |
| Jacksonville | -18% | -35% |
| Salt Lake City | -18% | -24% |
| Charlotte | -18% | -42% |
| Raleigh | -16% | -34% |
| Wichita | -15% | -29% |
| Kansas City | -15% | -24% |
| Omaha | -13% | -14% |
New Orleans and the Bay Area are still experiencing rates of small business closures that are almost double the national median.
Small businesses in the leisure and hospitality sector have been particularly hard hit, with 37% reporting no transaction data.
Getting Back to Business
Some cities are seeing rates of small business operation that are nearing pre-pandemic levels.
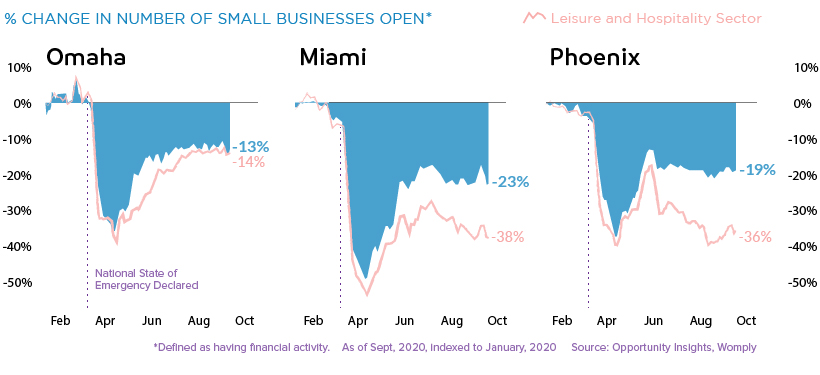
Of the cities covered in the data set, Omaha had the highest rate of small businesses open.
Still Shuttered
In cities with a large technology sector, such as San Francisco and Austin, COVID-19 is shaking up the economic patterns as entire companies switched to remote working almost overnight. This is bad news for the constellation of restaurants and services that cater to those workers.
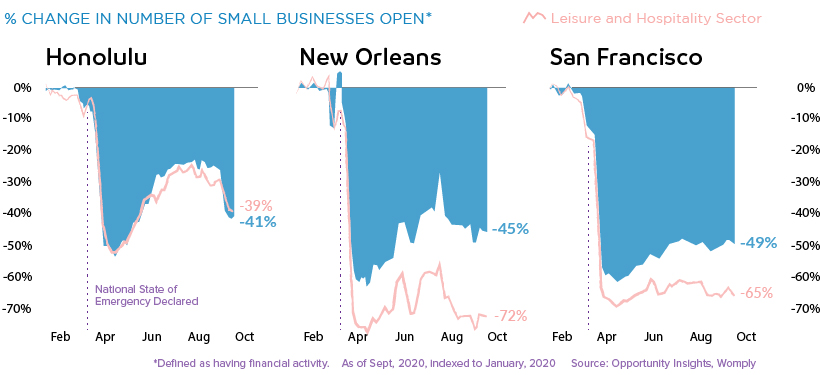
Likewise, cities that have an economy built around serving visitors – Honolulu and New Orleans, for example – have seen a very high rate of small business closures as vacations and conferences have been paused indefinitely.
As the pandemic drags on, many of these temporary closures are looking to be permanent. Yelp recently reported that of the restaurants marked as closed on their platform, 61% are shut down permanently. As well, businesses in the retail and nightlife categories also saw more than half of closures become permanent.
In Remembrance of Revenue
A business being completely closed is a definitive measure, but it doesn’t tell the whole story. Even for businesses that remained open, revenue is often far below pre-pandemic rates.
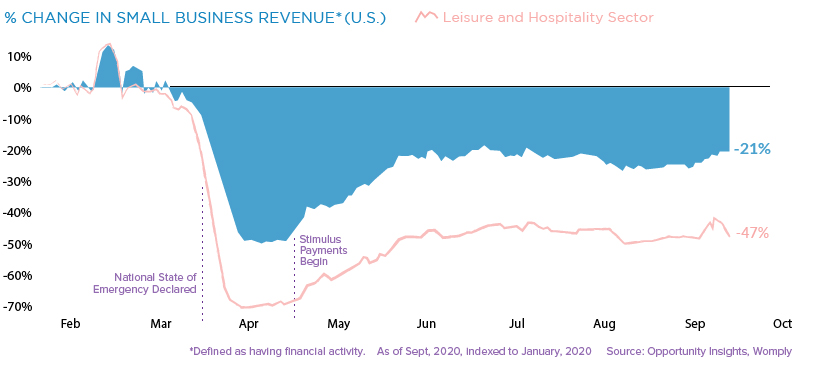
Once again, businesses in the leisure and hospitality sector have been hit the hardest, with revenue falling by almost half since the beginning of 2020.
At present, it’s hard to predict when, or even if, economic activity will completely recover. Though travel and some level of in-office work will eventually ramp back up, the small business landscape will continue to face major upheaval in the meantime.


Brands
How Tech Logos Have Evolved Over Time
From complete overhauls to more subtle tweaks, these tech logos have had quite a journey. Featuring: Google, Apple, and more.


How Tech Logos Have Evolved Over Time
This was originally posted on our Voronoi app. Download the app for free on iOS or Android and discover incredible data-driven charts from a variety of trusted sources.
One would be hard-pressed to find a company that has never changed its logo. Granted, some brands—like Rolex, IBM, and Coca-Cola—tend to just have more minimalistic updates. But other companies undergo an entire identity change, thus necessitating a full overhaul.
In this graphic, we visualized the evolution of prominent tech companies’ logos over time. All of these brands ranked highly in a Q1 2024 YouGov study of America’s most famous tech brands. The logo changes are sourced from 1000logos.net.
How Many Times Has Google Changed Its Logo?
Google and Facebook share a 98% fame rating according to YouGov. But while Facebook’s rise was captured in The Social Network (2010), Google’s history tends to be a little less lionized in popular culture.
For example, Google was initially called “Backrub” because it analyzed “back links” to understand how important a website was. Since its founding, Google has undergone eight logo changes, finally settling on its current one in 2015.
| Company | Number of Logo Changes |
|---|---|
| 8 | |
| HP | 8 |
| Amazon | 6 |
| Microsoft | 6 |
| Samsung | 6 |
| Apple | 5* |
Note: *Includes color changes. Source: 1000Logos.net
Another fun origin story is Microsoft, which started off as Traf-O-Data, a traffic counter reading company that generated reports for traffic engineers. By 1975, the company was renamed. But it wasn’t until 2012 that Microsoft put the iconic Windows logo—still the most popular desktop operating system—alongside its name.
And then there’s Samsung, which started as a grocery trading store in 1938. Its pivot to electronics started in the 1970s with black and white television sets. For 55 years, the company kept some form of stars from its first logo, until 1993, when the iconic encircled blue Samsung logo debuted.
Finally, Apple’s first logo in 1976 featured Isaac Newton reading under a tree—moments before an apple fell on his head. Two years later, the iconic bitten apple logo would be designed at Steve Jobs’ behest, and it would take another two decades for it to go monochrome.

-

 Green1 week ago
Ranked: The Countries With the Most Air Pollution in 2023
-

 Automotive2 weeks ago
Almost Every EV Stock is Down After Q1 2024
-

 AI2 weeks ago
The Stock Performance of U.S. Chipmakers So Far in 2024
-

 Markets2 weeks ago
Charted: Big Four Market Share by S&P 500 Audits
-

 Real Estate2 weeks ago
Ranked: The Most Valuable Housing Markets in America
-

 Money2 weeks ago
Which States Have the Highest Minimum Wage in America?
-

 AI2 weeks ago
Ranked: Semiconductor Companies by Industry Revenue Share
-

 Travel2 weeks ago
Ranked: The World’s Top Flight Routes, by Revenue