Markets
Mapped: Unemployment Forecasts, by Country in 2023
Mapped: Unemployment Forecasts, by Country in 2023
This was originally posted on Advisor Channel. Sign up to the free mailing list to get beautiful visualizations on financial markets that help advisors and their clients.
As 2022 clearly illustrated, the global job market can surprise expectations.
So far, this year is no different. The unemployment rate in six of the G7 countries hovers near the lowest in a century. With an unemployment rate of 3.4%, the U.S. jobless rate hasn’t fallen this low since 1969.
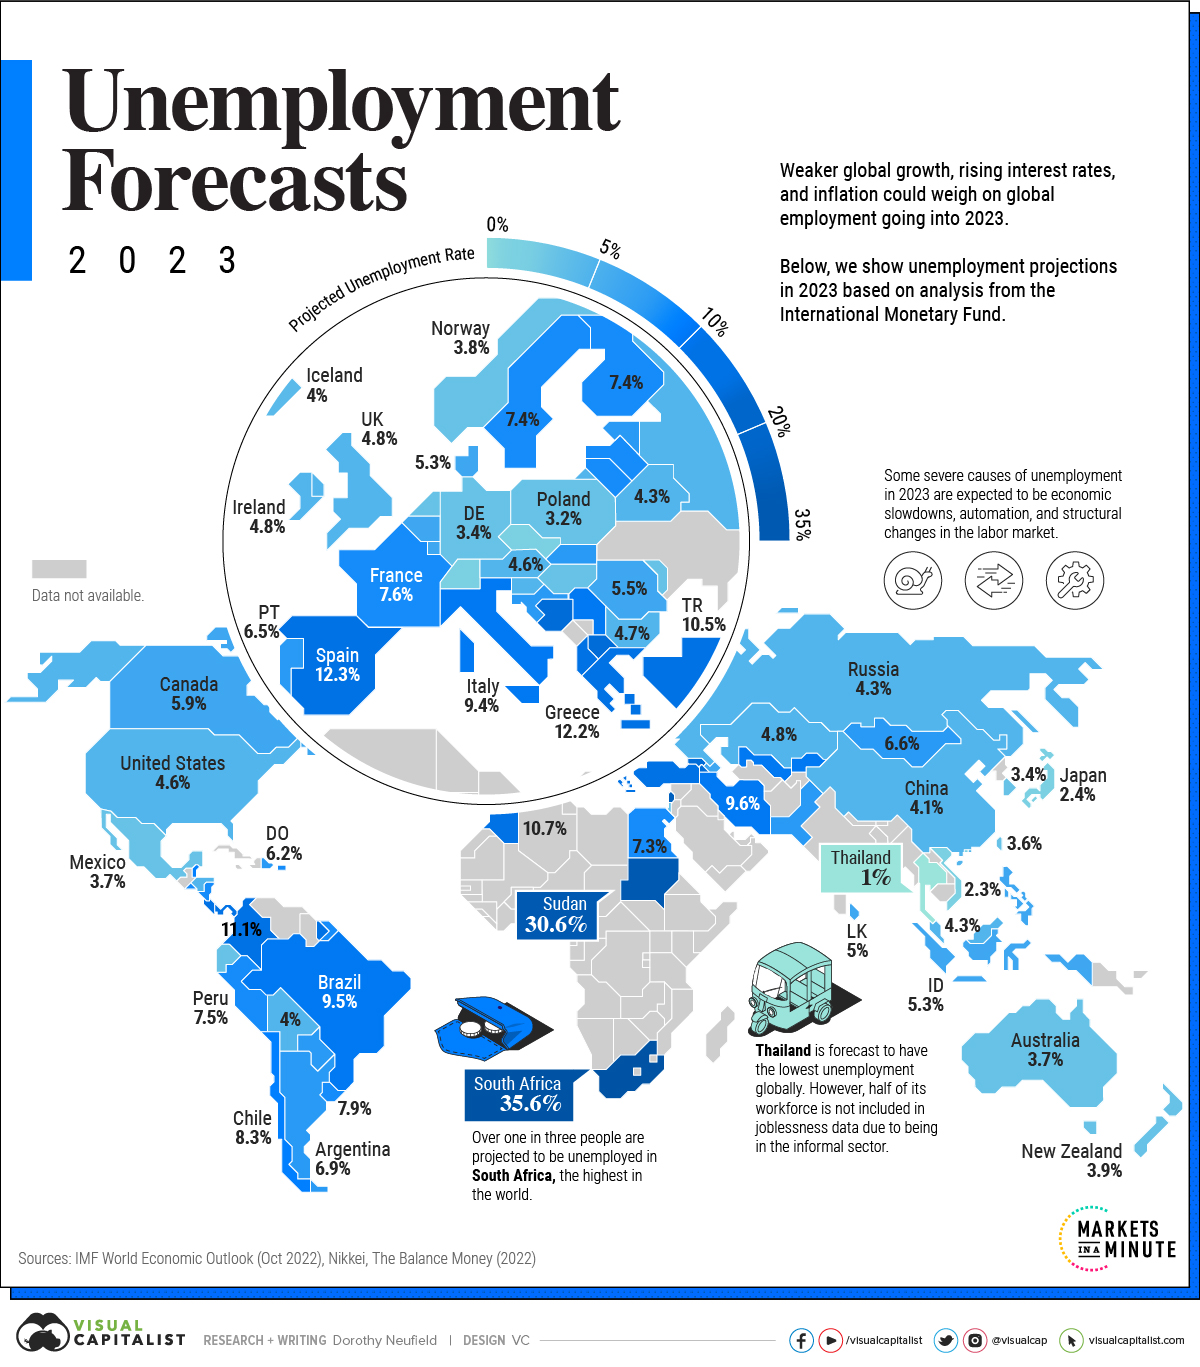
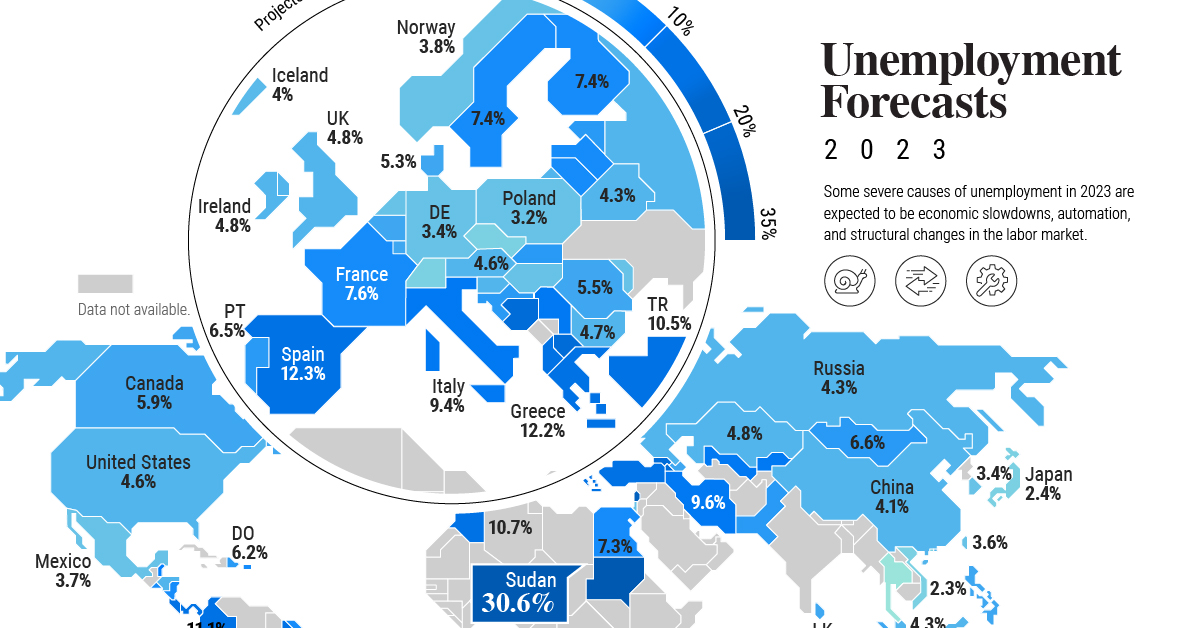
But as some economies navigate a strong labor market against high inflation and hawkish monetary policy, others are facing more challenging conditions. In the above graphic, we map unemployment forecasts in 2023 using data from the IMF’s World Economic Outlook.
Uncertainty Clouds the Surface
Across many countries, the pandemic has made entrenched labor trends worse. It has also altered job market conditions.
South Africa is projected to see the highest jobless rate globally. As the most industrialized nation on the continent, unemployment is estimated to hit 35.6% in 2023. Together, slow economic growth and stringent labor laws have prevented firms from hiring workers. Over the last two decades, unemployment has hovered around 20%.
| Country / Region | 2023 Unemployment Rate(Projected) |
|---|---|
| 🇿🇦 South Africa | 35.6% |
| 🇸🇩 Sudan | 30.6% |
| 🇵🇸 West Bank and Gaza | 25.0% |
| 🇬🇪 Georgia | 19.5% |
| 🇧🇦 Bosnia and Herzegovina | 17.2% |
| 🇦🇲 Armenia | 15.1% |
| 🇲🇰 North Macedonia | 15.0% |
| 🇨🇷 Costa Rica | 13.2% |
| 🇧🇸 The Bahamas | 12.7% |
| 🇪🇸 Spain | 12.3% |
| 🇬🇷 Greece | 12.2% |
| 🇨🇴 Colombia | 11.1% |
| 🇲🇦 Morocco | 10.7% |
| 🇸🇷 Suriname | 10.6% |
| 🇹🇷 Turkiye | 10.5% |
| 🇧🇧 Barbados | 10.0% |
| 🇦🇱 Albania | 10.0% |
| 🇵🇦 Panama | 10.0% |
| 🇷🇸 Serbia | 9.7% |
| 🇮🇷 Iran | 9.6% |
| 🇺🇿 Uzbekistan | 9.5% |
| 🇧🇷 Brazil | 9.5% |
| 🇮🇹 Italy | 9.4% |
| 🇰🇬 Kyrgyz Republic | 9.0% |
| 🇨🇻 Cabo Verde | 8.5% |
| 🇨🇱 Chile | 8.3% |
| 🇧🇿 Belize | 8.0% |
| 🇵🇷 Puerto Rico | 7.9% |
| 🇺🇾 Uruguay | 7.9% |
| 🇦🇼 Aruba | 7.7% |
| 🇫🇷 France | 7.6% |
| 🇵🇪 Peru | 7.5% |
| 🇸🇻 El Salvador | 7.5% |
| 🇸🇪 Sweden | 7.4% |
| 🇫🇮 Finland | 7.4% |
| 🇲🇺 Mauritius | 7.4% |
| 🇪🇬 Egypt | 7.3% |
| 🇱🇻 Latvia | 7.2% |
| 🇳🇮 Nicaragua | 7.2% |
| 🇱🇹 Lithuania | 7.0% |
| 🇦🇷 Argentina | 6.9% |
| 🇪🇪 Estonia | 6.8% |
| 🇧🇳 Brunei Darussalam | 6.8% |
| 🇲🇳 Mongolia | 6.6% |
| 🇭🇷 Croatia | 6.6% |
| 🇨🇾 Cyprus | 6.5% |
| 🇵🇹 Portugal | 6.5% |
| 🇵🇰 Pakistan | 6.4% |
| 🇵🇾 Paraguay | 6.4% |
| 🇸🇰 Slovak Republic | 6.2% |
| 🇩🇴 Dominican Republic | 6.2% |
| 🇨🇦 Canada | 5.9% |
| 🇦🇿 Azerbaijan | 5.8% |
| 🇸🇲 San Marino | 5.7% |
| 🇧🇪 Belgium | 5.6% |
| 🇷🇴 Romania | 5.5% |
| 🇫🇯 Fiji | 5.5% |
| 🇵🇭 Philippines | 5.4% |
| 🇮🇩 Indonesia | 5.3% |
| 🇩🇰 Denmark | 5.3% |
| 🇱🇰 Sri Lanka | 5.0% |
| 🇱🇺 Luxembourg | 5.0% |
| 🇮🇪 Ireland | 4.8% |
| 🇰🇿 Kazakhstan | 4.8% |
| 🇬🇧 United Kingdom | 4.8% |
| 🇧🇬 Bulgaria | 4.7% |
| 🇦🇹 Austria | 4.6% |
| 🇭🇳 Honduras | 4.6% |
| 🇺🇸 U.S. | 4.6% |
| 🇧🇭 Bahrain | 4.4% |
| 🇷🇺 Russia | 4.3% |
| 🇧🇾 Belarus | 4.3% |
| 🇸🇮 Slovenia | 4.3% |
| 🇲🇾 Malaysia | 4.3% |
| 🇨🇳 China | 4.1% |
| 🇮🇸 Iceland | 4.0% |
| 🇧🇴 Bolivia | 4.0% |
| 🇭🇰 Hong Kong SAR | 4.0% |
| 🇳🇱 Netherlands | 3.9% |
| 🇳🇿 New Zealand | 3.9% |
| 🇭🇺 Hungary | 3.8% |
| 🇳🇴 Norway | 3.8% |
| 🇮🇱 Israel | 3.8% |
| 🇪🇨 Ecuador | 3.8% |
| 🇦🇺 Australia | 3.7% |
| 🇲🇽 Mexico | 3.7% |
| 🇹🇼 Taiwan | 3.6% |
| 🇲🇩 Moldova | 3.5% |
| 🇰🇷 South Korea | 3.4% |
| 🇩🇪 Germany | 3.4% |
| 🇲🇹 Malta | 3.3% |
| 🇵🇱 Poland | 3.2% |
| 🇸🇨 Seychelles | 3.0% |
| 🇲🇴 Macao SAR | 2.7% |
| 🇯🇵 Japan | 2.4% |
| 🇨🇭 Switzerland | 2.4% |
| 🇻🇳 Vietnam | 2.3% |
| 🇨🇿 Czech Republic | 2.3% |
| 🇸🇬 Singapore | 2.1% |
| 🇹🇭 Thailand | 1.0% |
In Europe, Bosnia and Herzegovina is estimated to see the highest unemployment rate, at over 17%. It is followed by North Macedonia (15.0%) and Spain (12.7%). These jobless rates are more than double the projections for advanced economies in Europe.
The U.S. is forecast to see an unemployment rate of 4.6%, or 1.2% higher than current levels.
This suggests that today’s labor market strength will ease as U.S. economic indicators weaken. One marker is the Conference Board’s Leading Economic Index, which fell for its tenth straight month in December. Lower manufacturing orders, declining consumer expectations, and shorter work weeks are among the indicators it tracks.
Like the U.S., many advanced countries are witnessing labor market strength, especially in the United Kingdom, Asia, and Europe, although how long it will last is unknown.
A Closer Look at U.S. Numbers
Unlike some declining economic indicators mentioned above, the job market is one of the strongest areas of the global economy. Even as the tech sector reports mass layoffs, unemployment claims in the U.S. fall below recent averages. (It’s worth noting the tech sector makes up just 4% of the workforce).
In 2022, 4.8 million jobs were added, more than double the average seen between 2015-2019. Of course, the pandemic recovery has impacted these figures.
Some analysts suggest that despite a bleaker economic outlook, companies are hesitant to conduct layoffs. At the same time, the labor market is absorbing workers who have lost employment.
Consider the manufacturing sector. Even as the January ISM Purchasing Managers Index posted lower readings, hitting 47.4—a level of 48.7 and below generally indicates a recession—factories are not laying off many workers. Instead, manufacturers are saying they are confident conditions will improve in the second half of the year.
Containing Aftershocks
Today, strong labor markets pose a key challenge for central bankers globally.
This is because the robust job market is contributing to high inflation numbers. Yet despite recent rate increases, the impact has yet to prompt major waves in unemployment. Typically, monetary policy moves like these takes about a year to take peak effect. To combat inflation, monetary policy has been shown to take over three or even four years.
The good news is that inflation can potentially be tamed by other means. Fixing supply-side dynamics, such as preventing supply shortages and improving transportation systems and infrastructure could cool inflation.
As investors closely watch economic data, rising unemployment could come on the heels of higher interest rates, but so far this has yet to unravel.


Markets
U.S. Debt Interest Payments Reach $1 Trillion
U.S. debt interest payments have surged past the $1 trillion dollar mark, amid high interest rates and an ever-expanding debt burden.


U.S. Debt Interest Payments Reach $1 Trillion
This was originally posted on our Voronoi app. Download the app for free on iOS or Android and discover incredible data-driven charts from a variety of trusted sources.
The cost of paying for America’s national debt crossed the $1 trillion dollar mark in 2023, driven by high interest rates and a record $34 trillion mountain of debt.
Over the last decade, U.S. debt interest payments have more than doubled amid vast government spending during the pandemic crisis. As debt payments continue to soar, the Congressional Budget Office (CBO) reported that debt servicing costs surpassed defense spending for the first time ever this year.
This graphic shows the sharp rise in U.S. debt payments, based on data from the Federal Reserve.
A $1 Trillion Interest Bill, and Growing
Below, we show how U.S. debt interest payments have risen at a faster pace than at another time in modern history:
| Date | Interest Payments | U.S. National Debt |
|---|---|---|
| 2023 | $1.0T | $34.0T |
| 2022 | $830B | $31.4T |
| 2021 | $612B | $29.6T |
| 2020 | $518B | $27.7T |
| 2019 | $564B | $23.2T |
| 2018 | $571B | $22.0T |
| 2017 | $493B | $20.5T |
| 2016 | $460B | $20.0T |
| 2015 | $435B | $18.9T |
| 2014 | $442B | $18.1T |
| 2013 | $425B | $17.2T |
| 2012 | $417B | $16.4T |
| 2011 | $433B | $15.2T |
| 2010 | $400B | $14.0T |
| 2009 | $354B | $12.3T |
| 2008 | $380B | $10.7T |
| 2007 | $414B | $9.2T |
| 2006 | $387B | $8.7T |
| 2005 | $355B | $8.2T |
| 2004 | $318B | $7.6T |
| 2003 | $294B | $7.0T |
| 2002 | $298B | $6.4T |
| 2001 | $318B | $5.9T |
| 2000 | $353B | $5.7T |
| 1999 | $353B | $5.8T |
| 1998 | $360B | $5.6T |
| 1997 | $368B | $5.5T |
| 1996 | $362B | $5.3T |
| 1995 | $357B | $5.0T |
| 1994 | $334B | $4.8T |
| 1993 | $311B | $4.5T |
| 1992 | $306B | $4.2T |
| 1991 | $308B | $3.8T |
| 1990 | $298B | $3.4T |
| 1989 | $275B | $3.0T |
| 1988 | $254B | $2.7T |
| 1987 | $240B | $2.4T |
| 1986 | $225B | $2.2T |
| 1985 | $219B | $1.9T |
| 1984 | $205B | $1.7T |
| 1983 | $176B | $1.4T |
| 1982 | $157B | $1.2T |
| 1981 | $142B | $1.0T |
| 1980 | $113B | $930.2B |
| 1979 | $96B | $845.1B |
| 1978 | $84B | $789.2B |
| 1977 | $69B | $718.9B |
| 1976 | $61B | $653.5B |
| 1975 | $55B | $576.6B |
| 1974 | $50B | $492.7B |
| 1973 | $45B | $469.1B |
| 1972 | $39B | $448.5B |
| 1971 | $36B | $424.1B |
| 1970 | $35B | $389.2B |
| 1969 | $30B | $368.2B |
| 1968 | $25B | $358.0B |
| 1967 | $23B | $344.7B |
| 1966 | $21B | $329.3B |
Interest payments represent seasonally adjusted annual rate at the end of Q4.
At current rates, the U.S. national debt is growing by a remarkable $1 trillion about every 100 days, equal to roughly $3.6 trillion per year.
As the national debt has ballooned, debt payments even exceeded Medicaid outlays in 2023—one of the government’s largest expenditures. On average, the U.S. spent more than $2 billion per day on interest costs last year. Going further, the U.S. government is projected to spend a historic $12.4 trillion on interest payments over the next decade, averaging about $37,100 per American.
Exacerbating matters is that the U.S. is running a steep deficit, which stood at $1.1 trillion for the first six months of fiscal 2024. This has accelerated due to the 43% increase in debt servicing costs along with a $31 billion dollar increase in defense spending from a year earlier. Additionally, a $30 billion increase in funding for the Federal Deposit Insurance Corporation in light of the regional banking crisis last year was a major contributor to the deficit increase.
Overall, the CBO forecasts that roughly 75% of the federal deficit’s increase will be due to interest costs by 2034.

-

 Real Estate2 weeks ago
Visualizing America’s Shortage of Affordable Homes
-

 Technology1 week ago
Ranked: Semiconductor Companies by Industry Revenue Share
-

 Money1 week ago
Which States Have the Highest Minimum Wage in America?
-

 Real Estate1 week ago
Ranked: The Most Valuable Housing Markets in America
-

 Business1 week ago
Charted: Big Four Market Share by S&P 500 Audits
-

 AI1 week ago
The Stock Performance of U.S. Chipmakers So Far in 2024
-

 Misc2 weeks ago
Almost Every EV Stock is Down After Q1 2024
-

 Money2 weeks ago
Where Does One U.S. Tax Dollar Go?