Energy
Mapped: U.S. Wind Electricity Generation by State
![]() Subscribe to the Elements free mailing list for more like this
Subscribe to the Elements free mailing list for more like this
Mapping U.S. Wind Energy by State
This was originally posted on Elements. Sign up to the free mailing list to get beautiful visualizations on natural resource megatrends in your email every week.
Wind power is the most productive renewable energy source in the U.S., generating nearly half of America’s renewable energy.
But wind doesn’t blow fairly across the nation, so which states are contributing the most to U.S. wind energy generation?
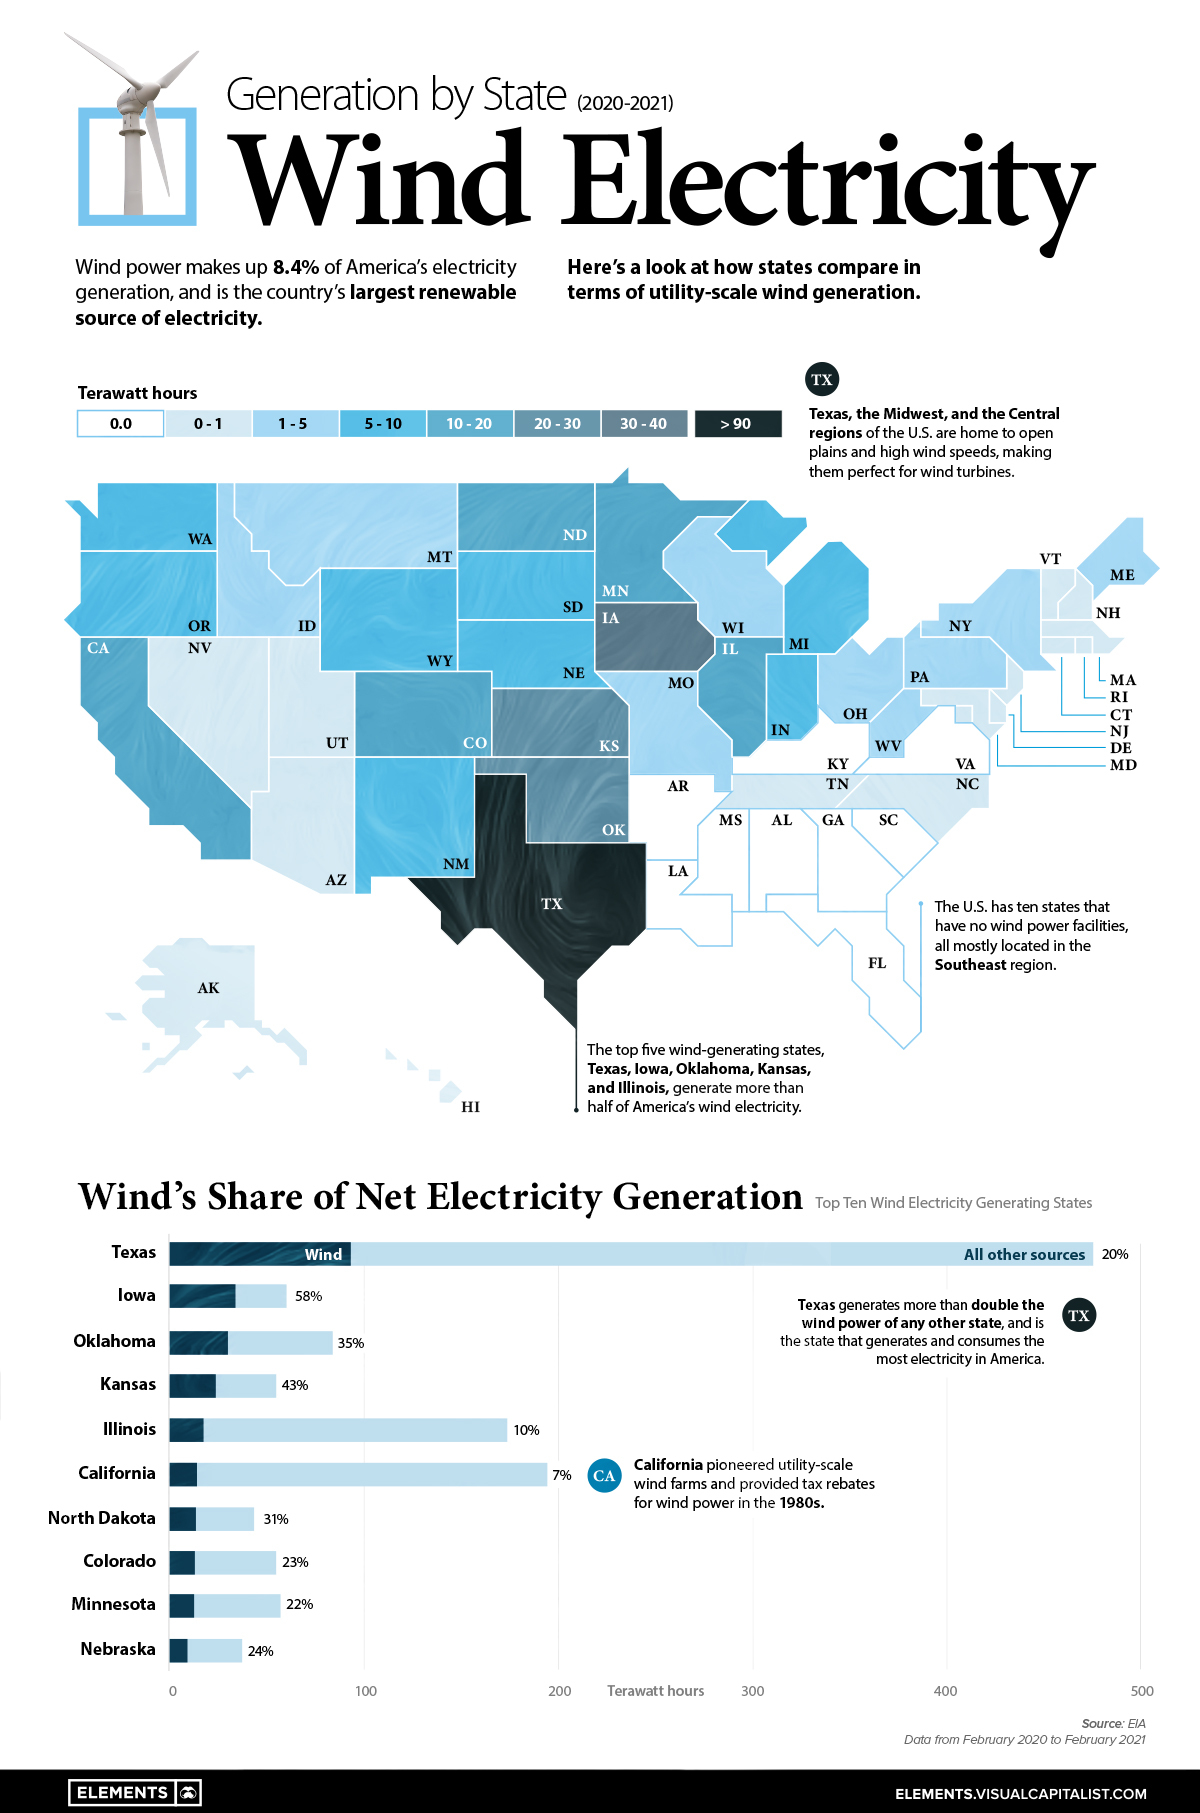
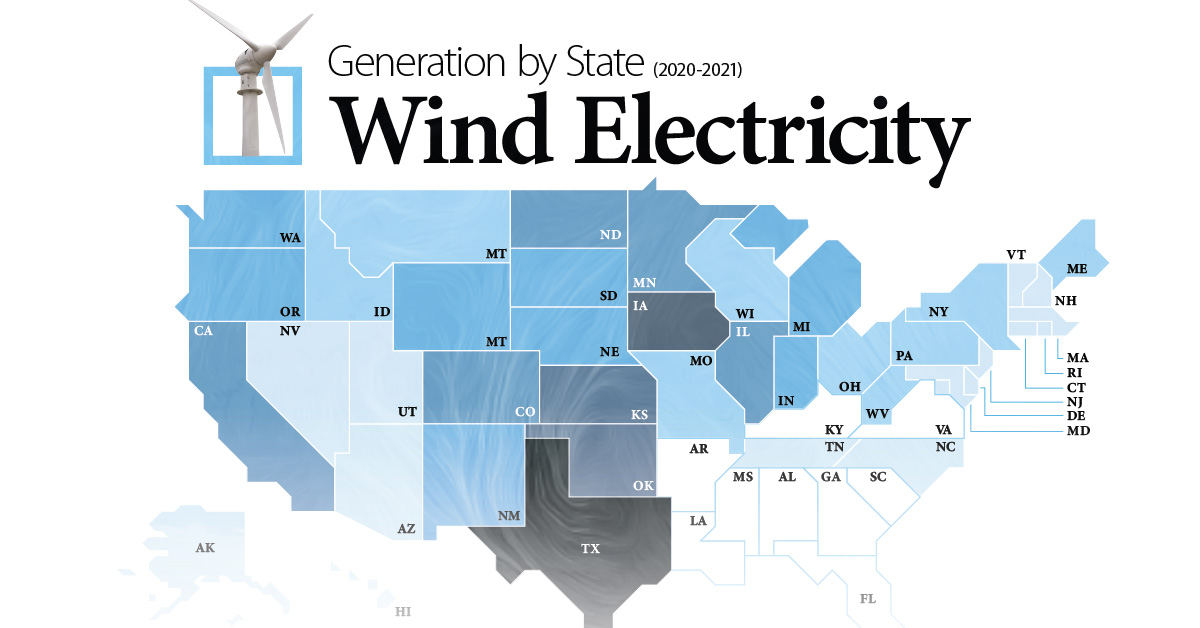
This map uses data from the EIA to show how much wind electricity different U.S. states generate, and breaks down wind’s share of total electricity generation in top wind power producing states.
Wind Electricity Generation by State Compared
America’s wind energy generating states are all primarily located in the Central and Midwest regions of the nation, where wind speeds are highest and most consistent.
Texas is the runaway leader in wind, generating over 92 Terawatt-hours of electricity during a year, more than the next three top states (Iowa, Oklahoma, and Kansas) combined. While Texas is the top generator in terms of wind-powered electricity, wind only makes up 20% of the state’s total electricity generation.
| State | Wind Electricity Generation (Terawatt hours) | Wind's Share of Net Electricity Generation |
|---|---|---|
| Texas | 92.9 TWh | 20% |
| Iowa | 34.1 TWh | 58% |
| Oklahoma | 29.6 TWh | 35% |
| Kansas | 23.5 TWh | 43% |
| Illinois | 17.1 TWh | 10% |
| California | 13.6 TWh | 7% |
| North Dakota | 13.2 TWh | 31% |
| Colorado | 12.7 TWh | 23% |
| Minnesota | 12.2 TWh | 22% |
| Nebraska | 8.7 TWh | 24% |
Data from Feb 2020-Feb 2021
Source: EIA
Meanwhile, wind makes up a much larger share of net electricity generation in states like Iowa (58%), Oklahoma (35%), and Kansas (43%). For both Iowa and Kansas, wind is the primary energy source of in-state electricity generation after overtaking coal in 2019.
The U.S. also has 10 states with no wind power generating facilities, all primarily located in the Southeast region.
How Does Wind Energy Work?
Humans have been harnessing wind power for millennia, with windmills originally relying on wind to pump water or mill flour.
Today’s wind turbines work similarly, with their large blades generating electricity as wind causes them to rotate. As these blades are pushed by the wind, a connected internal shaft that is attached to an electric generator also turns and generates electricity.
Wind power is one of the safest sources of energy and relies on one key factor: wind speeds. When analyzing minimum wind speeds for economic viability in a given location, the following annual average wind speeds are needed:
- Small wind turbines: Minimum of 4 meters per second (9 miles per hour)
- Utility-scale wind turbines: Minimum of 5.8 meters per second (13 miles per hour)
Source: EIA
Unsurprisingly, the majority of America’s onshore wind turbine infrastructure is located in the middle of the nation, where wind speeds are highest.
Growing America’s Wind Turbine Capacity
While wind energy only made up 0.2% of U.S. electricity generating capacity in 1990, it is now essential for the clean energy transition. Today, wind power makes up more than 10% of U.S. electricity generating capacity, and this share is set to continue growing.
Record-breaking wind turbine installations in 2020 and 2021, primarily in the Central and Midwest regions, have increased U.S. wind energy generation by 30% to 135.1 GW.
In 2020, the U.S. increased wind turbine capacity by 14.2 gigawatts, followed by another 17.1 gigawatts in 2021. This year is set to see another 7.6 GW come online, with around half of 2022’s added capacity located in Texas.
After two years of record-breaking wind turbine installations, 2021’s expiration of the U.S. production tax credit is likely to dampen the rate of future installations.


Energy
The World’s Biggest Nuclear Energy Producers
China has grown its nuclear capacity over the last decade, now ranking second on the list of top nuclear energy producers.


The World’s Biggest Nuclear Energy Producers
This was originally posted on our Voronoi app. Download the app for free on Apple or Android and discover incredible data-driven charts from a variety of trusted sources.
Scientists in South Korea recently broke a record in a nuclear fusion experiment. For 48 seconds, they sustained a temperature seven times that of the sun’s core.
But generating commercially viable energy from nuclear fusion still remains more science fiction than reality. Meanwhile, its more reliable sibling, nuclear fission, has been powering our world for many decades.
In this graphic, we visualized the top producers of nuclear energy by their share of the global total, measured in terawatt hours (TWh). Data for this was sourced from the Nuclear Energy Institute, last updated in August 2022.
Which Country Generates the Most Nuclear Energy?
Nuclear energy production in the U.S. is more than twice the amount produced by China (ranked second) and France (ranked third) put together. In total, the U.S. accounts for nearly 30% of global nuclear energy output.
However, nuclear power only accounts for one-fifth of America’s electricity supply. This is in contrast to France, which generates 60% of its electricity from nuclear plants.
| Rank | Country | Nuclear Energy Produced (TWh) | % of Total |
|---|---|---|---|
| 1 | 🇺🇸 U.S. | 772 | 29% |
| 2 | 🇨🇳 China | 383 | 14% |
| 3 | 🇫🇷 France | 363 | 14% |
| 4 | 🇷🇺 Russia | 208 | 8% |
| 5 | 🇰🇷 South Korea | 150 | 6% |
| 6 | 🇨🇦 Canada | 87 | 3% |
| 7 | 🇺🇦 Ukraine | 81 | 3% |
| 8 | 🇩🇪 Germany | 65 | 2% |
| 9 | 🇯🇵 Japan | 61 | 2% |
| 10 | 🇪🇸 Spain | 54 | 2% |
| 11 | 🇸🇪 Sweden | 51 | 2% |
| 12 | 🇧🇪 Belgium | 48 | 2% |
| 13 | 🇬🇧 UK | 42 | 2% |
| 14 | 🇮🇳 India | 40 | 2% |
| 15 | 🇨🇿 Czech Republic | 29 | 1% |
| N/A | 🌐 Other | 219 | 8% |
| N/A | 🌍 Total | 2,653 | 100% |
Another highlight is how China has rapidly grown its nuclear energy capabilities in the last decade. Between 2016 and 2021, for example, it increased its share of global nuclear energy output from less than 10% to more than 14%, overtaking France for second place.
On the opposite end, the UK’s share has slipped to 2% over the same time period.
Meanwhile, Ukraine has heavily relied on nuclear energy to power its grid. In March 2022, it lost access to its key Zaporizhzhia Nuclear Power Station after Russian forces wrested control of the facility. With six 1,000 MW reactors, the plant is one of the largest in Europe. It is currently not producing any power, and has been the site of recent drone attacks.

-

 Maps2 weeks ago
Mapped: Average Wages Across Europe
-

 Money1 week ago
Which States Have the Highest Minimum Wage in America?
-

 Real Estate1 week ago
Ranked: The Most Valuable Housing Markets in America
-

 Markets1 week ago
Charted: Big Four Market Share by S&P 500 Audits
-

 AI1 week ago
The Stock Performance of U.S. Chipmakers So Far in 2024
-

 Automotive1 week ago
Almost Every EV Stock is Down After Q1 2024
-

 Money2 weeks ago
Where Does One U.S. Tax Dollar Go?
-

 Green2 weeks ago
Ranked: Top Countries by Total Forest Loss Since 2001