Energy
Mapped: U.S. Wind Electricity Generation by State
![]() Subscribe to the Elements free mailing list for more like this
Subscribe to the Elements free mailing list for more like this
Mapping U.S. Wind Energy by State
This was originally posted on Elements. Sign up to the free mailing list to get beautiful visualizations on natural resource megatrends in your email every week.
Wind power is the most productive renewable energy source in the U.S., generating nearly half of America’s renewable energy.
But wind doesn’t blow fairly across the nation, so which states are contributing the most to U.S. wind energy generation?
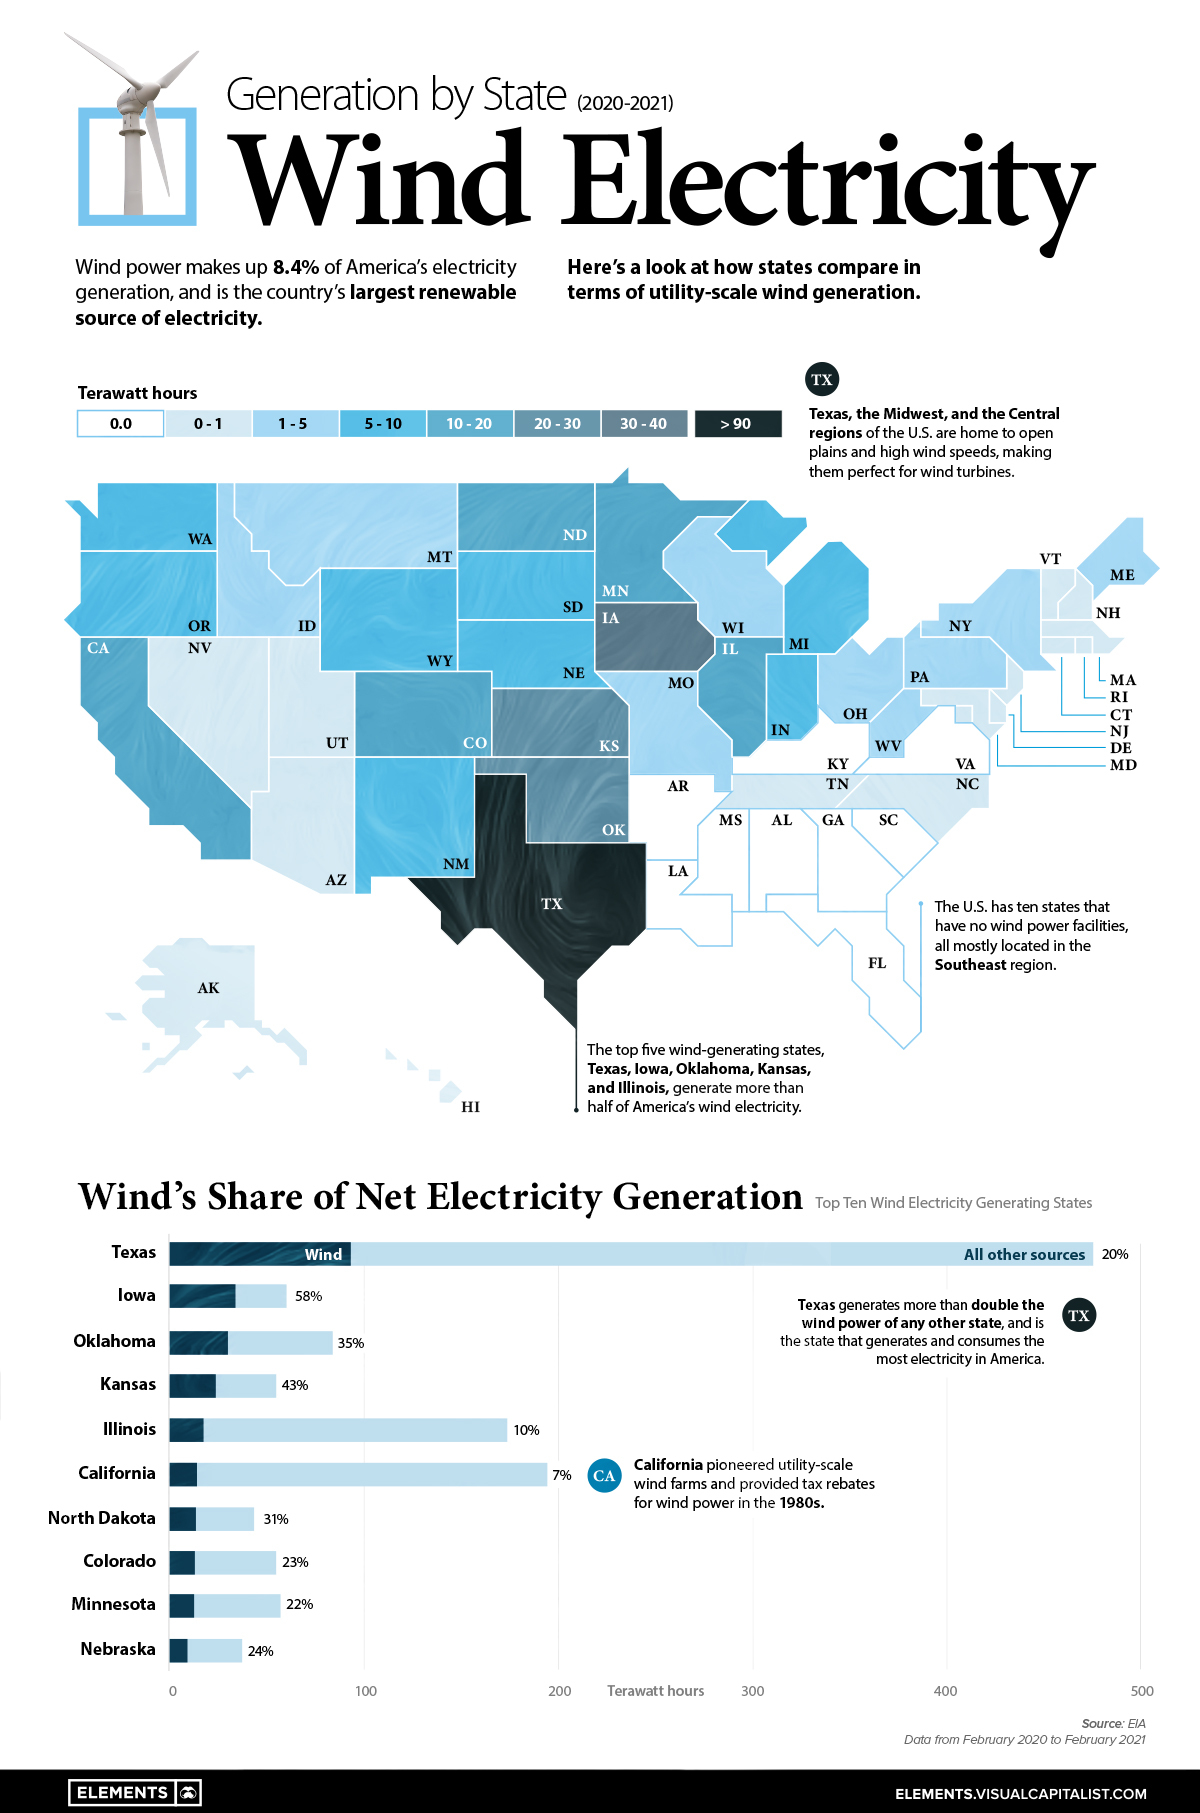
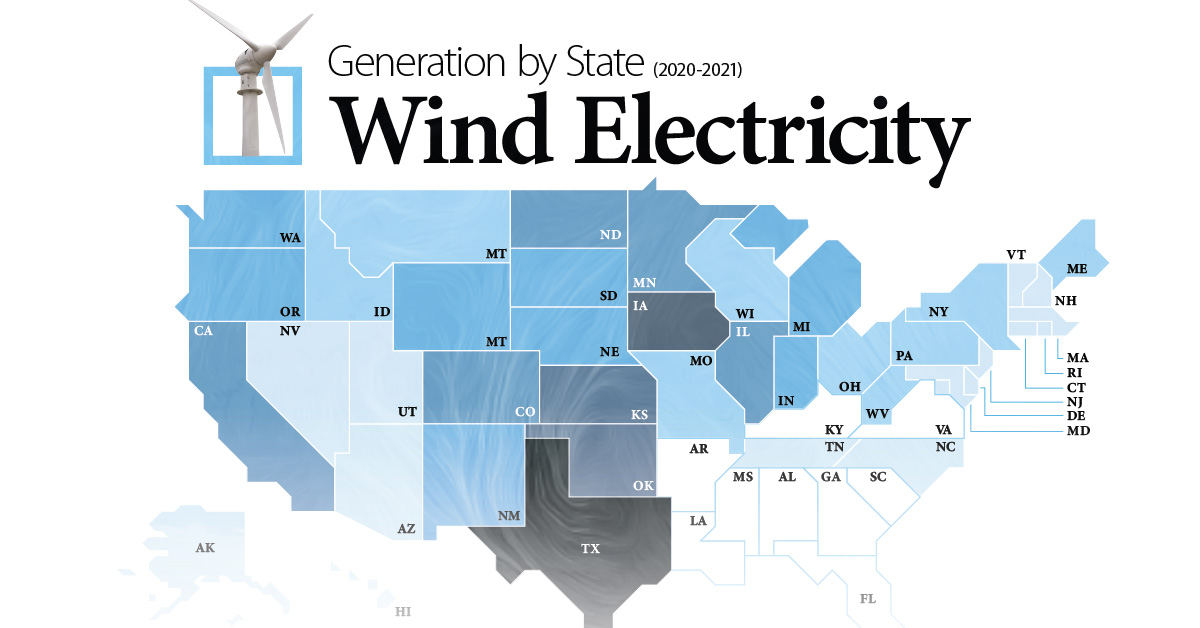
This map uses data from the EIA to show how much wind electricity different U.S. states generate, and breaks down wind’s share of total electricity generation in top wind power producing states.
Wind Electricity Generation by State Compared
America’s wind energy generating states are all primarily located in the Central and Midwest regions of the nation, where wind speeds are highest and most consistent.
Texas is the runaway leader in wind, generating over 92 Terawatt-hours of electricity during a year, more than the next three top states (Iowa, Oklahoma, and Kansas) combined. While Texas is the top generator in terms of wind-powered electricity, wind only makes up 20% of the state’s total electricity generation.
| State | Wind Electricity Generation (Terawatt hours) | Wind's Share of Net Electricity Generation |
|---|---|---|
| Texas | 92.9 TWh | 20% |
| Iowa | 34.1 TWh | 58% |
| Oklahoma | 29.6 TWh | 35% |
| Kansas | 23.5 TWh | 43% |
| Illinois | 17.1 TWh | 10% |
| California | 13.6 TWh | 7% |
| North Dakota | 13.2 TWh | 31% |
| Colorado | 12.7 TWh | 23% |
| Minnesota | 12.2 TWh | 22% |
| Nebraska | 8.7 TWh | 24% |
Data from Feb 2020-Feb 2021
Source: EIA
Meanwhile, wind makes up a much larger share of net electricity generation in states like Iowa (58%), Oklahoma (35%), and Kansas (43%). For both Iowa and Kansas, wind is the primary energy source of in-state electricity generation after overtaking coal in 2019.
The U.S. also has 10 states with no wind power generating facilities, all primarily located in the Southeast region.
How Does Wind Energy Work?
Humans have been harnessing wind power for millennia, with windmills originally relying on wind to pump water or mill flour.
Today’s wind turbines work similarly, with their large blades generating electricity as wind causes them to rotate. As these blades are pushed by the wind, a connected internal shaft that is attached to an electric generator also turns and generates electricity.
Wind power is one of the safest sources of energy and relies on one key factor: wind speeds. When analyzing minimum wind speeds for economic viability in a given location, the following annual average wind speeds are needed:
- Small wind turbines: Minimum of 4 meters per second (9 miles per hour)
- Utility-scale wind turbines: Minimum of 5.8 meters per second (13 miles per hour)
Source: EIA
Unsurprisingly, the majority of America’s onshore wind turbine infrastructure is located in the middle of the nation, where wind speeds are highest.
Growing America’s Wind Turbine Capacity
While wind energy only made up 0.2% of U.S. electricity generating capacity in 1990, it is now essential for the clean energy transition. Today, wind power makes up more than 10% of U.S. electricity generating capacity, and this share is set to continue growing.
Record-breaking wind turbine installations in 2020 and 2021, primarily in the Central and Midwest regions, have increased U.S. wind energy generation by 30% to 135.1 GW.
In 2020, the U.S. increased wind turbine capacity by 14.2 gigawatts, followed by another 17.1 gigawatts in 2021. This year is set to see another 7.6 GW come online, with around half of 2022’s added capacity located in Texas.
After two years of record-breaking wind turbine installations, 2021’s expiration of the U.S. production tax credit is likely to dampen the rate of future installations.


Energy
Charted: 4 Reasons Why Lithium Could Be the Next Gold Rush
Visual Capitalist has partnered with EnergyX to show why drops in prices and growing demand may make now the right time to invest in lithium.


4 Reasons Why You Should Invest in Lithium
Lithium’s importance in powering EVs makes it a linchpin of the clean energy transition and one of the world’s most precious minerals.
In this graphic, Visual Capitalist partnered with EnergyX to explore why now may be the time to invest in lithium.
1. Lithium Prices Have Dropped
One of the most critical aspects of evaluating an investment is ensuring that the asset’s value is higher than its price would indicate. Lithium is integral to powering EVs, and, prices have fallen fast over the last year:
| Date | LiOH·H₂O* | Li₂CO₃** |
|---|---|---|
| Feb 2023 | $76 | $71 |
| March 2023 | $71 | $61 |
| Apr 2023 | $43 | $33 |
| May 2023 | $43 | $33 |
| June 2023 | $47 | $45 |
| July 2023 | $44 | $40 |
| Aug 2023 | $35 | $35 |
| Sept 2023 | $28 | $27 |
| Oct 2023 | $24 | $23 |
| Nov 2023 | $21 | $21 |
| Dec 2023 | $17 | $16 |
| Jan 2024 | $14 | $15 |
| Feb 2024 | $13 | $14 |
Note: Monthly spot prices were taken as close to the 14th of each month as possible.
*Lithium hydroxide monohydrate MB-LI-0033
**Lithium carbonate MB-LI-0029
2. Lithium-Ion Battery Prices Are Also Falling
The drop in lithium prices is just one reason to invest in the metal. Increasing economies of scale, coupled with low commodity prices, have caused the cost of lithium-ion batteries to drop significantly as well.
In fact, BNEF reports that between 2013 and 2023, the price of a Li-ion battery dropped by 82%.
| Year | Price per KWh |
|---|---|
| 2023 | $139 |
| 2022 | $161 |
| 2021 | $150 |
| 2020 | $160 |
| 2019 | $183 |
| 2018 | $211 |
| 2017 | $258 |
| 2016 | $345 |
| 2015 | $448 |
| 2014 | $692 |
| 2013 | $780 |

3. EV Adoption is Sustainable
One of the best reasons to invest in lithium is that EVs, one of the main drivers behind the demand for lithium, have reached a price point similar to that of traditional vehicle.
According to the Kelly Blue Book, Tesla’s average transaction price dropped by 25% between 2022 and 2023, bringing it in line with many other major manufacturers and showing that EVs are a realistic transport option from a consumer price perspective.
| Manufacturer | September 2022 | September 2023 |
|---|---|---|
| BMW | $69,000 | $72,000 |
| Ford | $54,000 | $56,000 |
| Volkswagon | $54,000 | $56,000 |
| General Motors | $52,000 | $53,000 |
| Tesla | $68,000 | $51,000 |
4. Electricity Demand in Transport is Growing
As EVs become an accessible transport option, there’s an investment opportunity in lithium. But possibly the best reason to invest in lithium is that the IEA reports global demand for the electricity in transport could grow dramatically by 2030:
| Transport Type | 2022 | 2025 | 2030 |
|---|---|---|---|
| Buses 🚌 | 23,000 GWh | 50,000 GWh | 130,000 GWh |
| Cars 🚙 | 65,000 GWh | 200,000 GWh | 570,000 GWh |
| Trucks 🛻 | 4,000 GWh | 15,000 GWh | 94,000 GWh |
| Vans 🚐 | 6,000 GWh | 16,000 GWh | 72,000 GWh |
The Lithium Investment Opportunity
Lithium presents a potentially classic investment opportunity. Lithium and battery prices have dropped significantly, and recently, EVs have reached a price point similar to other vehicles. By 2030, the demand for clean energy, especially in transport, will grow dramatically.
With prices dropping and demand skyrocketing, now is the time to invest in lithium.
EnergyX is poised to exploit lithium demand with cutting-edge lithium extraction technology capable of extracting 300% more lithium than current processes.

-

 Lithium2 days ago
Ranked: The Top 10 EV Battery Manufacturers in 2023
Asia dominates this ranking of the world’s largest EV battery manufacturers in 2023.
-

 Energy1 week ago
The World’s Biggest Nuclear Energy Producers
China has grown its nuclear capacity over the last decade, now ranking second on the list of top nuclear energy producers.
-

 Energy4 weeks ago
The World’s Biggest Oil Producers in 2023
Just three countries accounted for 40% of global oil production last year.
-

 Energy1 month ago
How Much Does the U.S. Depend on Russian Uranium?
Currently, Russia is the largest foreign supplier of nuclear power fuel to the U.S.
-

 Uranium2 months ago
Charted: Global Uranium Reserves, by Country
We visualize the distribution of the world’s uranium reserves by country, with 3 countries accounting for more than half of total reserves.
-

 Energy3 months ago
Visualizing the Rise of the U.S. as Top Crude Oil Producer
Over the last decade, the United States has established itself as the world’s top producer of crude oil, surpassing Saudi Arabia and Russia.


-

 Markets1 week ago
U.S. Debt Interest Payments Reach $1 Trillion
-

 Markets2 weeks ago
Ranked: The Most Valuable Housing Markets in America
-

 Money2 weeks ago
Which States Have the Highest Minimum Wage in America?
-

 AI2 weeks ago
Ranked: Semiconductor Companies by Industry Revenue Share
-

 Markets2 weeks ago
Ranked: The World’s Top Flight Routes, by Revenue
-

 Countries2 weeks ago
Population Projections: The World’s 6 Largest Countries in 2075
-

 Markets2 weeks ago
The Top 10 States by Real GDP Growth in 2023
-

 Money2 weeks ago
The Smallest Gender Wage Gaps in OECD Countries