Energy
Mapped: Visualizing U.S. Oil Production by State


Mapped: Visualizing U.S. Oil Production by State
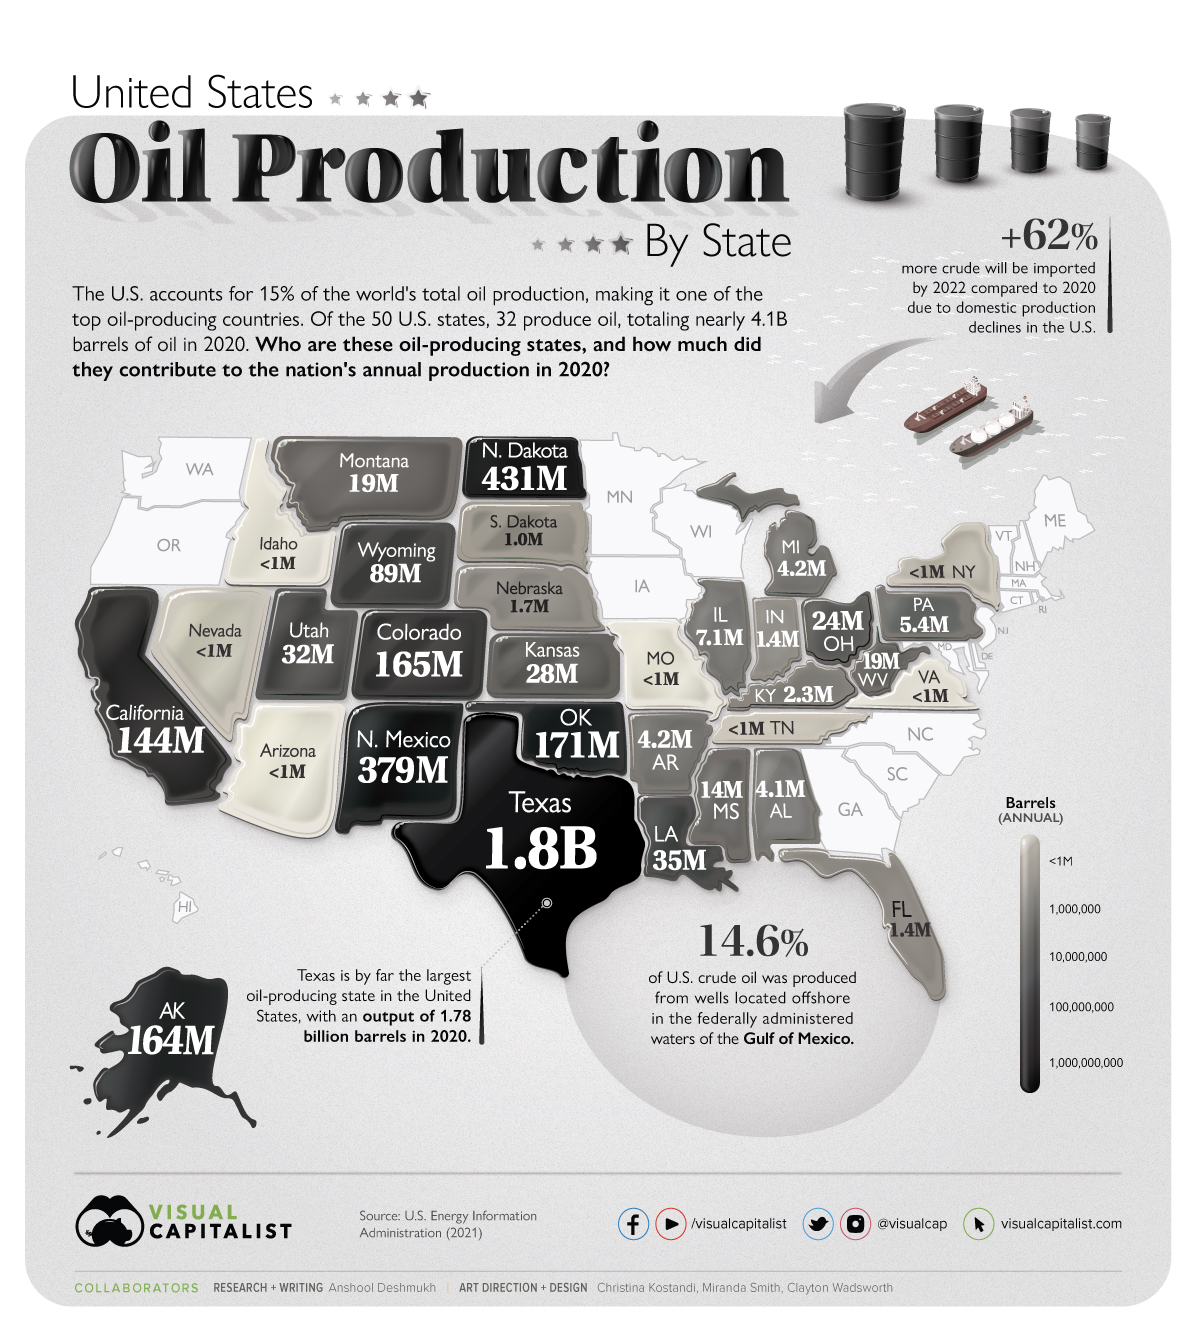
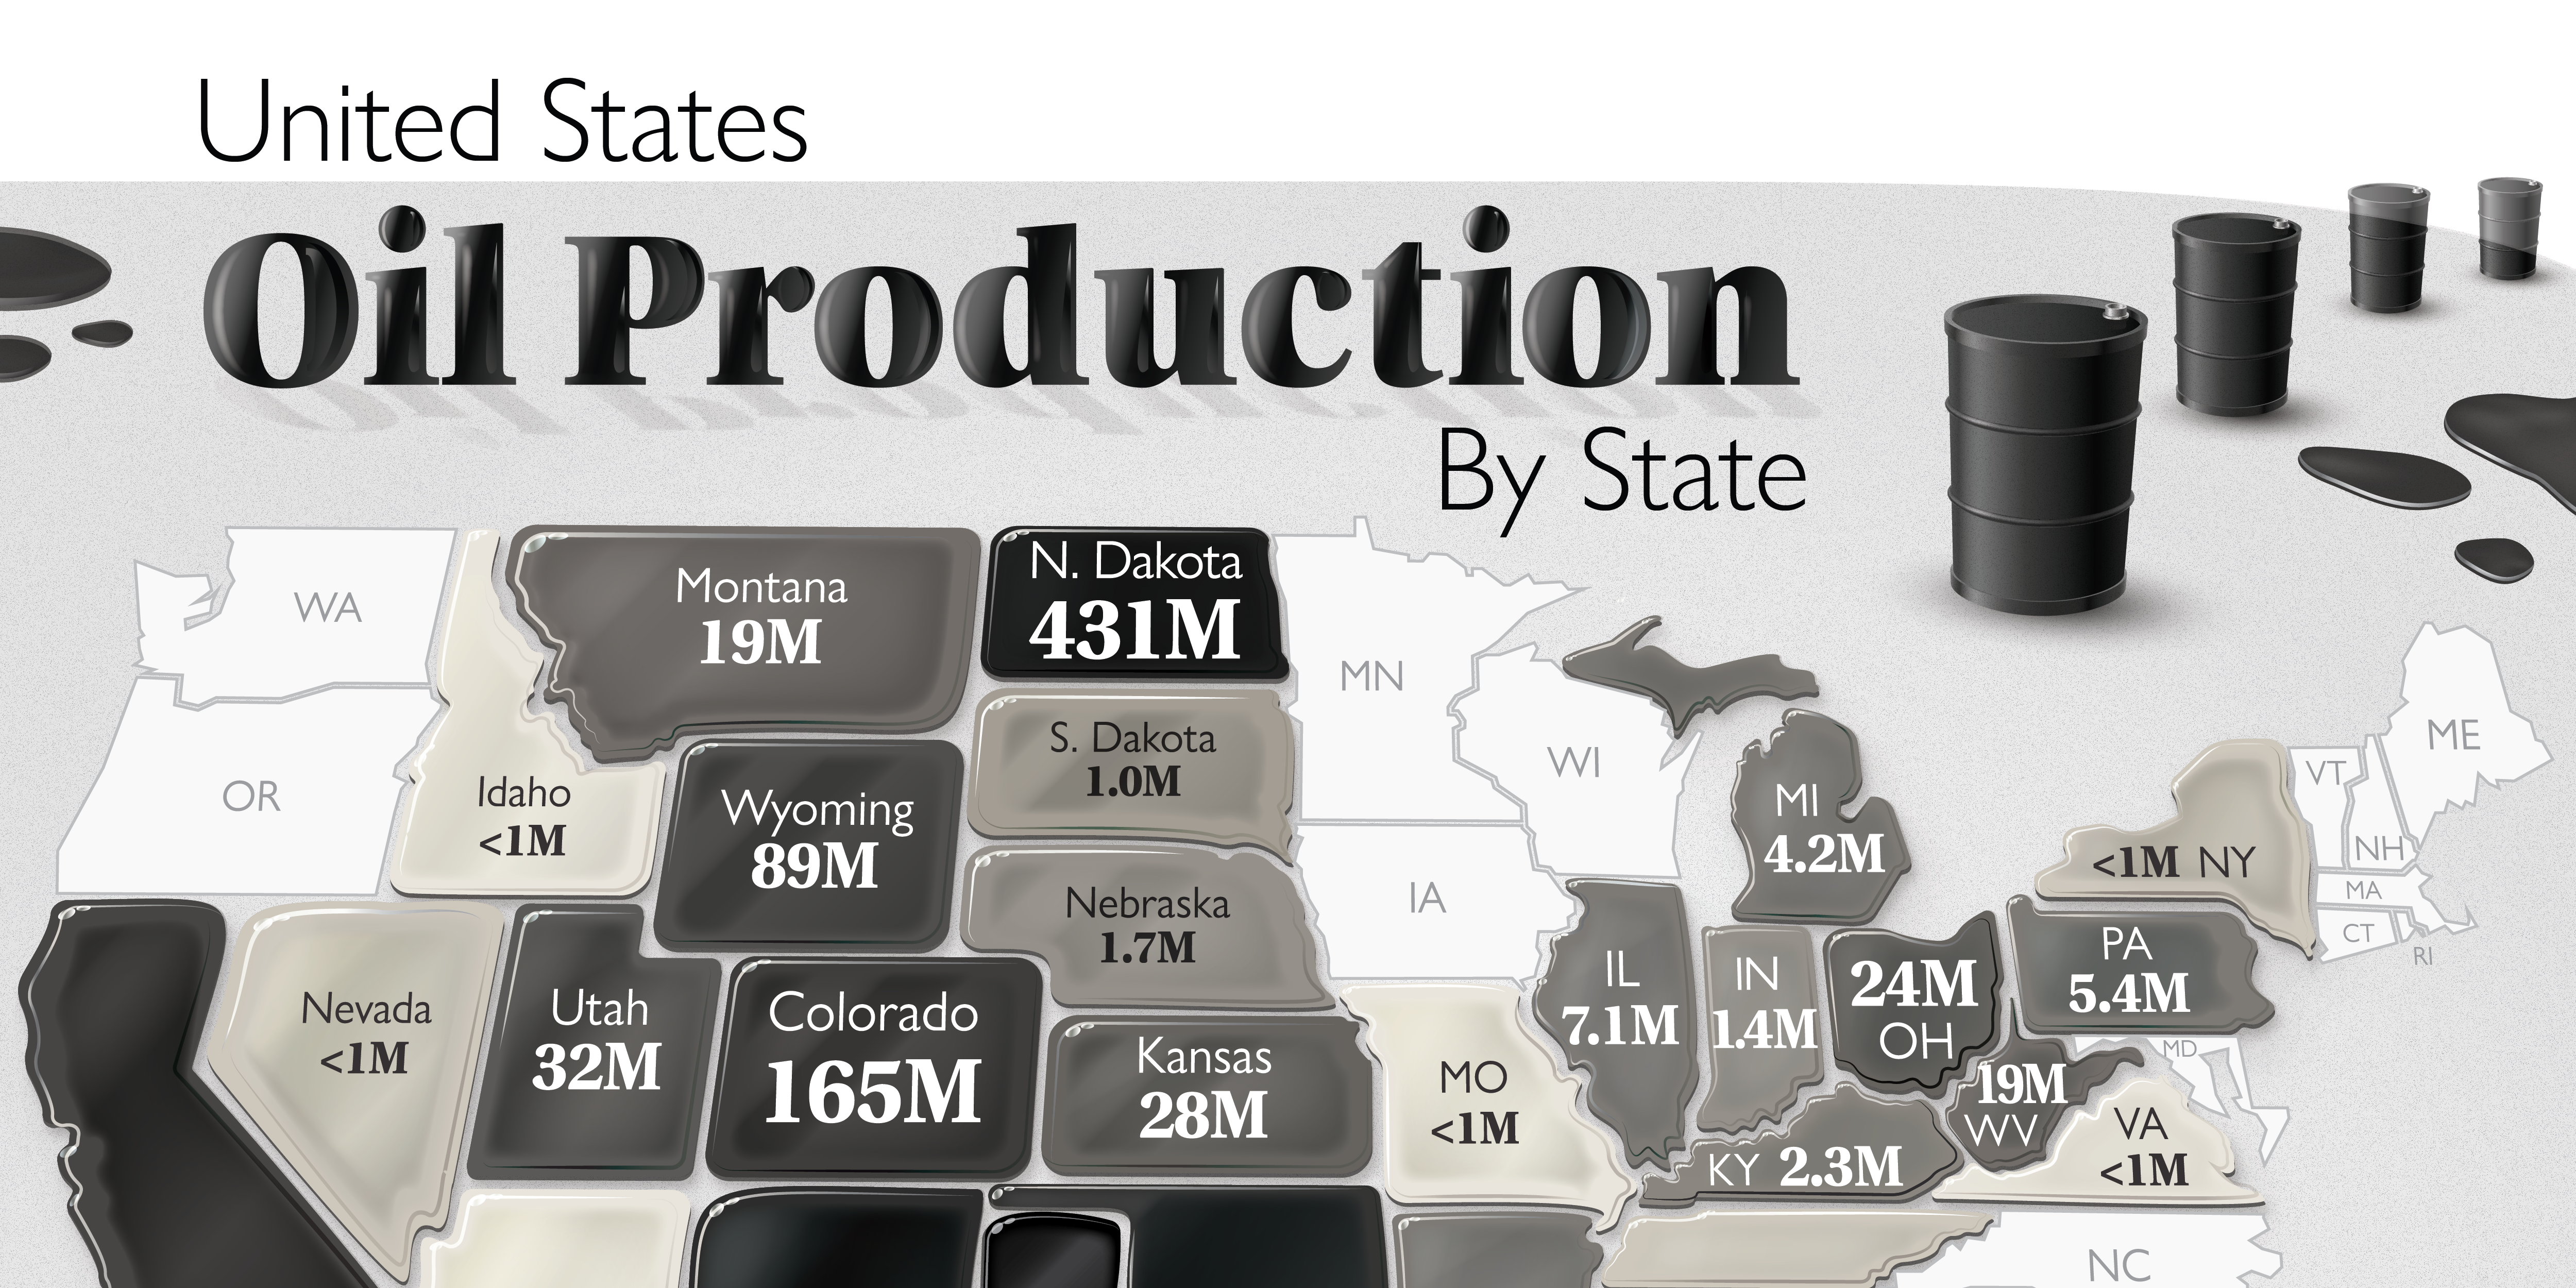
In 2018, the United States became the world’s top crude oil producer. It has strongly held this position ever since.
According to the U.S. Energy Information Administration (EIA), the country accounted for nearly 15% of the world’s total oil production in 2020, churning out close to 13 million barrels of crude oil per day—more than Russia or Saudi Arabia.
Although total U.S. oil production declined between 1985 and 2008, annual production increased nearly every year from 2009 through 2019, reaching the highest amount on record in 2019.
The Dominant Oil Producing States
Impressively, 71% of total U.S. oil production came from just five states. An additional 14.6% came from the Gulf of Mexico, which is a federal jurisdiction.
Here are the five states that produce the largest amount of crude oil:
| Rank | State | Oil Production (billion barrels) | Share of Total Production |
|---|---|---|---|
| 1 | Texas | 1.78 | 43.0% |
| 2 | North Dakota | 0.43 | 10.4% |
| 3 | New Mexico | 0.37 | 9.2% |
| 4 | Oklahoma | 0.17 | 4.1% |
| 5 | Colorado | 0.16 | 4.0% |
Rounding the top 10 are states like Alaska, California, Wyoming, Louisiana, and Utah.
Texas is undoubtedly the largest oil-producing state in the United States. In 2020, Texas produced a total of 1.78 billion barrels of oil. Texas is home to the most productive U.S. oil basin, the Permian, routinely accounting for at least 50% of total onshore production. A distant second is North Dakota, which produced about 431.2 million barrels of oil in 2020.
Regional Distribution of U.S. Oil Production
A total of 32 of the 50 U.S. states produce oil. They are divided among five regional divisions for oil production in the U.S., known as the Petroleum Administration for Defense Districts (PADD).
These five regional divisions of the allocation of fuels were established in the U.S. during the Second World War and are still used today for data collection purposes.
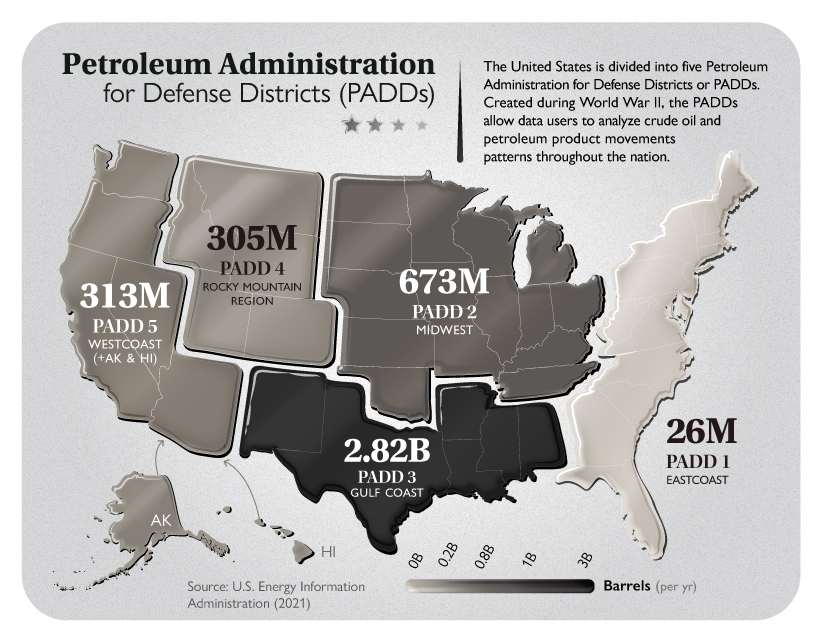
Given that Texas is the largest U.S. oil-producing state, PADD 3 (Gulf Coast) is also the largest oil-producing PADD. PADD 3 also includes the federal offshore region in the Gulf of Mexico. There are around 400 operational oil and gas rigs in the country.
Impact of U.S. Oil Production on Employment
Rapid growth in oil production using advanced drilling methods has created high-paying jobs in states like North Dakota and Texas.
Thanks to the rapid development in the Bakken Shale formation, North Dakota boasts the nation’s lowest unemployment rate. The state has also grown personal income and state economic output at a fast rate, due to oil and gas industry growth.
Oil production from the Eagle Ford Shale has transformed a relatively poor region of South Texas into one of the nation’s most significant economic development zones. In fact, due largely to the oil and natural gas industry, the Texas Comptroller estimates that Texas has recovered 100% of the jobs lost during the Great Recession.
Looking to the Future
The U.S. slashed its oil production forecast through next year just as OPEC and its allies begin to roll back their production cuts in the coming months.
U.S. oil output will drop to 11.04 million barrels a day this year, down from a forecasted 11.15 million. This was a result of the deep freeze that shut down the oil industry in Texas. The EIA also lowered its output forecast for 2022 by 100,000 barrels a day.
Despite its forecast for a rise in supply from outside the cartel this year, OPEC said in its report that it is uncertain about the levels of investment expected to determine the non-OPEC supply outlook for the years to come.


Energy
Charted: 4 Reasons Why Lithium Could Be the Next Gold Rush
Visual Capitalist has partnered with EnergyX to show why drops in prices and growing demand may make now the right time to invest in lithium.


4 Reasons Why You Should Invest in Lithium
Lithium’s importance in powering EVs makes it a linchpin of the clean energy transition and one of the world’s most precious minerals.
In this graphic, Visual Capitalist partnered with EnergyX to explore why now may be the time to invest in lithium.
1. Lithium Prices Have Dropped
One of the most critical aspects of evaluating an investment is ensuring that the asset’s value is higher than its price would indicate. Lithium is integral to powering EVs, and, prices have fallen fast over the last year:
| Date | LiOH·H₂O* | Li₂CO₃** |
|---|---|---|
| Feb 2023 | $76 | $71 |
| March 2023 | $71 | $61 |
| Apr 2023 | $43 | $33 |
| May 2023 | $43 | $33 |
| June 2023 | $47 | $45 |
| July 2023 | $44 | $40 |
| Aug 2023 | $35 | $35 |
| Sept 2023 | $28 | $27 |
| Oct 2023 | $24 | $23 |
| Nov 2023 | $21 | $21 |
| Dec 2023 | $17 | $16 |
| Jan 2024 | $14 | $15 |
| Feb 2024 | $13 | $14 |
Note: Monthly spot prices were taken as close to the 14th of each month as possible.
*Lithium hydroxide monohydrate MB-LI-0033
**Lithium carbonate MB-LI-0029
2. Lithium-Ion Battery Prices Are Also Falling
The drop in lithium prices is just one reason to invest in the metal. Increasing economies of scale, coupled with low commodity prices, have caused the cost of lithium-ion batteries to drop significantly as well.
In fact, BNEF reports that between 2013 and 2023, the price of a Li-ion battery dropped by 82%.
| Year | Price per KWh |
|---|---|
| 2023 | $139 |
| 2022 | $161 |
| 2021 | $150 |
| 2020 | $160 |
| 2019 | $183 |
| 2018 | $211 |
| 2017 | $258 |
| 2016 | $345 |
| 2015 | $448 |
| 2014 | $692 |
| 2013 | $780 |

3. EV Adoption is Sustainable
One of the best reasons to invest in lithium is that EVs, one of the main drivers behind the demand for lithium, have reached a price point similar to that of traditional vehicle.
According to the Kelly Blue Book, Tesla’s average transaction price dropped by 25% between 2022 and 2023, bringing it in line with many other major manufacturers and showing that EVs are a realistic transport option from a consumer price perspective.
| Manufacturer | September 2022 | September 2023 |
|---|---|---|
| BMW | $69,000 | $72,000 |
| Ford | $54,000 | $56,000 |
| Volkswagon | $54,000 | $56,000 |
| General Motors | $52,000 | $53,000 |
| Tesla | $68,000 | $51,000 |
4. Electricity Demand in Transport is Growing
As EVs become an accessible transport option, there’s an investment opportunity in lithium. But possibly the best reason to invest in lithium is that the IEA reports global demand for the electricity in transport could grow dramatically by 2030:
| Transport Type | 2022 | 2025 | 2030 |
|---|---|---|---|
| Buses 🚌 | 23,000 GWh | 50,000 GWh | 130,000 GWh |
| Cars 🚙 | 65,000 GWh | 200,000 GWh | 570,000 GWh |
| Trucks 🛻 | 4,000 GWh | 15,000 GWh | 94,000 GWh |
| Vans 🚐 | 6,000 GWh | 16,000 GWh | 72,000 GWh |
The Lithium Investment Opportunity
Lithium presents a potentially classic investment opportunity. Lithium and battery prices have dropped significantly, and recently, EVs have reached a price point similar to other vehicles. By 2030, the demand for clean energy, especially in transport, will grow dramatically.
With prices dropping and demand skyrocketing, now is the time to invest in lithium.
EnergyX is poised to exploit lithium demand with cutting-edge lithium extraction technology capable of extracting 300% more lithium than current processes.

-

 Lithium20 hours ago
Ranked: The Top 10 EV Battery Manufacturers in 2023
Asia dominates this ranking of the world’s largest EV battery manufacturers in 2023.
-

 Energy6 days ago
The World’s Biggest Nuclear Energy Producers
China has grown its nuclear capacity over the last decade, now ranking second on the list of top nuclear energy producers.
-

 Energy4 weeks ago
The World’s Biggest Oil Producers in 2023
Just three countries accounted for 40% of global oil production last year.
-

 Energy1 month ago
How Much Does the U.S. Depend on Russian Uranium?
Currently, Russia is the largest foreign supplier of nuclear power fuel to the U.S.
-

 Uranium2 months ago
Charted: Global Uranium Reserves, by Country
We visualize the distribution of the world’s uranium reserves by country, with 3 countries accounting for more than half of total reserves.
-

 Energy2 months ago
Visualizing the Rise of the U.S. as Top Crude Oil Producer
Over the last decade, the United States has established itself as the world’s top producer of crude oil, surpassing Saudi Arabia and Russia.


-

 Markets1 week ago
Ranked: The Largest U.S. Corporations by Number of Employees
-

 Green3 weeks ago
Ranked: Top Countries by Total Forest Loss Since 2001
-

 Money2 weeks ago
Where Does One U.S. Tax Dollar Go?
-

 Automotive2 weeks ago
Almost Every EV Stock is Down After Q1 2024
-

 AI2 weeks ago
The Stock Performance of U.S. Chipmakers So Far in 2024
-

 Markets2 weeks ago
Charted: Big Four Market Share by S&P 500 Audits
-

 Real Estate2 weeks ago
Ranked: The Most Valuable Housing Markets in America
-

 Money2 weeks ago
Which States Have the Highest Minimum Wage in America?