Energy
Mapped: The World’s Largest State-Owned Oil Companies
View the full-resolution version of this infographic


Mapped: The World’s Largest State-Owned Oil Companies
View the high-resolution of the infographic by clicking here.
Oil is one of the world’s most important natural resources, playing a critical role in everything from transportation fuels to cosmetics.
For this reason, many governments choose to nationalize their supply of oil. This gives them a greater degree of control over their oil reserves as well as access to additional revenue streams. In practice, nationalization often involves the creation of a national oil company to oversee the country’s energy operations.
What are the world’s largest and most influential state-owned oil companies?
Editor’s Note: This post and infographic are intended to provide a broad summary of the state-owned oil industry. Due to variations in reporting and available information, the companies named do not represent a comprehensive index.
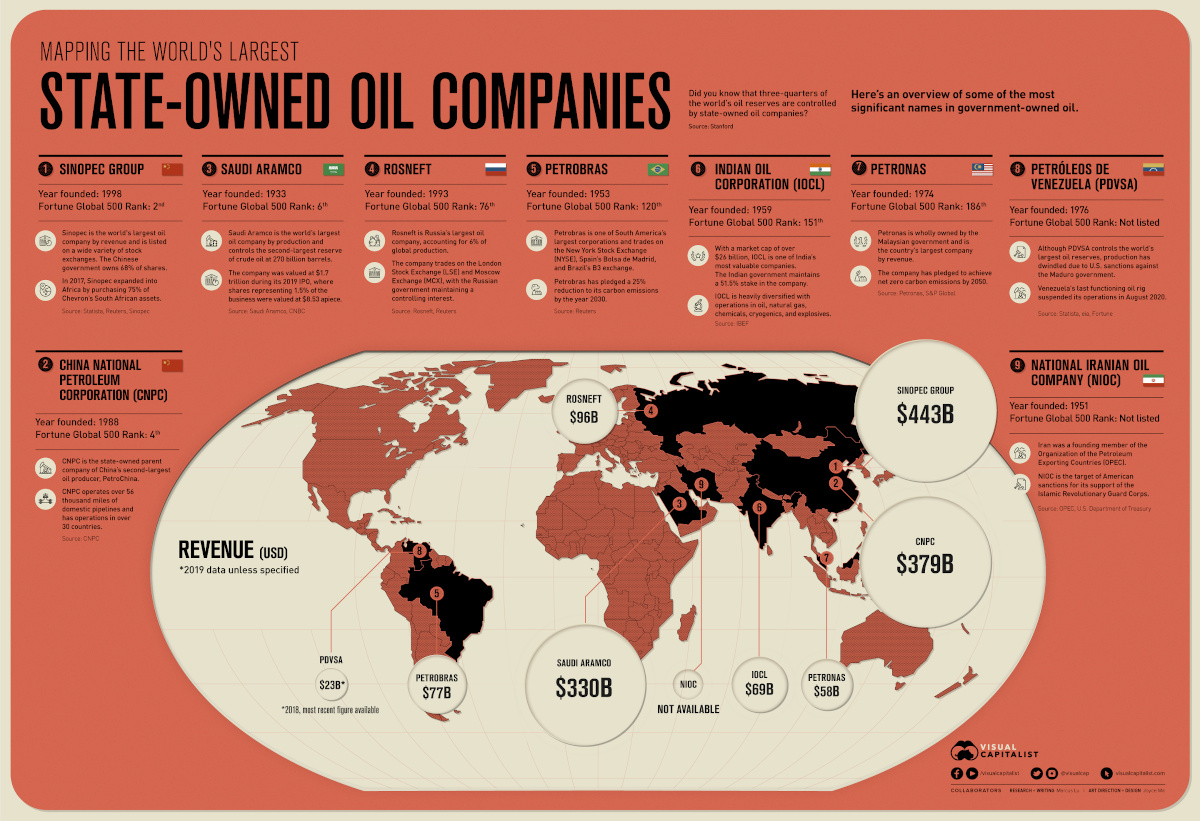
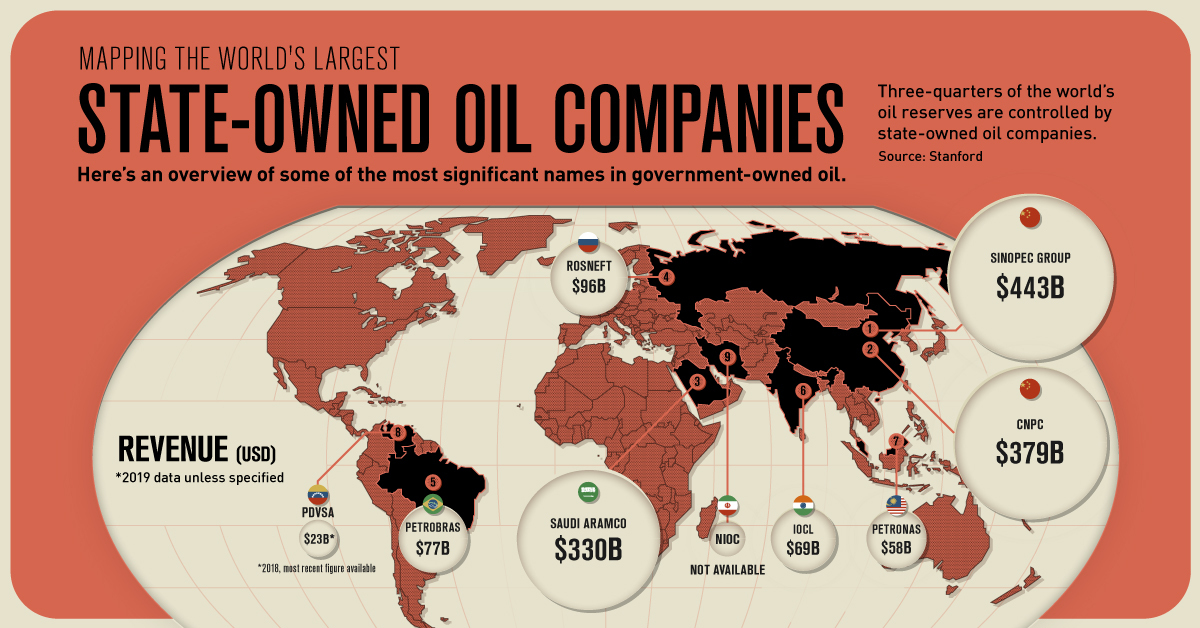
State-Owned Oil Companies by Revenue
National oil companies are a major force in the global energy sector, controlling approximately three-quarters of the Earth’s oil reserves.
As a result, many have found their place on the Fortune Global 500 list, a ranking of the world’s 500 largest companies by revenue.
| Country | Name | Fortune Global 500 Rank | 2019 Revenues |
|---|---|---|---|
| 🇨🇳 China | Sinopec Group | 2 | $443B |
| 🇨🇳 China | China National Petroleum Corporation (CNPC) | 4 | $379B |
| 🇸🇦 Saudi Arabia | Saudi Aramco | 6 | $330B |
| 🇷🇺 Russia | Rosneft | 76 | $96B |
| 🇧🇷 Brazil | Petrobras | 120 | $77B |
| 🇮🇳 India | Indian Oil Corporation (IOCL) | 151 | $69B |
| 🇲🇾 Malaysia | Petronas | 186 | $58B |
| 🇮🇷 Iran | National Iranian Oil Company (NIOC) | Not listed | $19B* |
| 🇻🇪 Venezuela | Petróleos de Venezuela (PDVSA) | Not listed | $23B (2018) |
*Value of Iranian petroleum exports in 2019. Source: Fortune, Statista, OPEC
China is home to the two largest companies from this list, Sinopec Group and China National Petroleum Corporation (CNPC). Both are involved in upstream and downstream oil operations, where upstream refers to exploration and extraction, and downstream refers to refining and distribution.
It’s worth noting that many of these companies are listed on public stock markets—Sinopec, for example, trades on exchanges located in Shanghai, Hong Kong, New York, and London. Going public can be an effective strategy for these companies as it allows them to raise capital for new projects, while also ensuring their governments maintain control. In the case of Sinopec, 68% of shares are held by the Chinese government.
Saudi Aramco was the latest national oil company to follow this strategy, putting up 1.5% of its business in a 2019 initial public offering (IPO). At roughly $8.53 per share, Aramco’s IPO raised $25.6 billion, making it one of the world’s largest IPOs in history.
Geopolitical Tensions
Because state-owned oil companies are directly tied to their governments, they can sometimes get caught in the crosshairs of geopolitical conflicts.
The disputed presidency of Nicolás Maduro, for example, has resulted in the U.S. imposing sanctions against Venezuela’s government, central bank, and national oil company, Petróleos de Venezuela (PDVSA). The pressure of these sanctions is proving to be particularly damaging, with PDVSA’s daily production in decline since 2016.
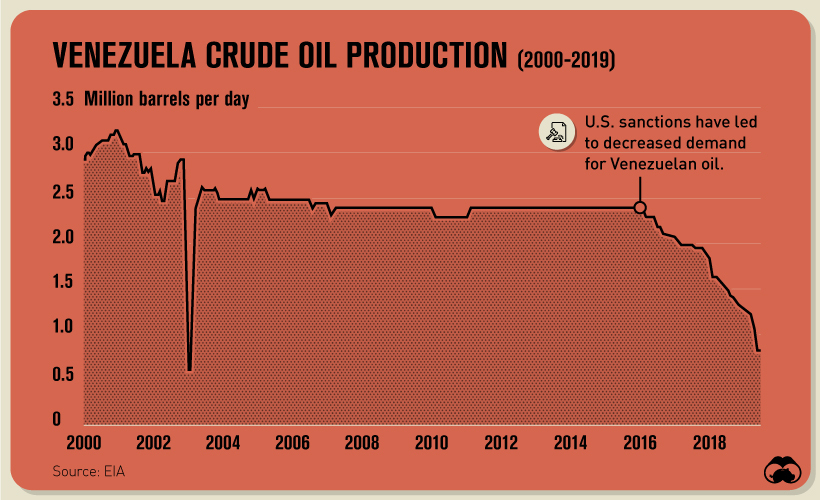
In a country for which oil comprises 95% of exports, Venezuela’s economic outlook is becoming increasingly dire. The final straw was drawn in August 2020 when the country’s last remaining oil rig suspended its operations.
Other national oil companies at the receiving end of American sanctions include Russia’s Rosneft and Iran’s National Iranian Oil Company (NIOC). Rosneft was sanctioned by the U.S. in 2020 for facilitating Venezuelan oil exports, while NIOC was targeted for providing financial support to Iran’s Islamic Revolutionary Guard Corps, an entity designated as a foreign terrorist organization.
Climate Pressures
Like the rest of the fossil fuel industry, state-owned oil companies are highly exposed to the effects of climate change. This suggests that as time passes, many governments will need to find a balance between economic growth and environmental protection.
Brazil has already found itself in this dilemma as the country’s president, Jair Bolsonaro, has drawn criticism for his dismissive stance on climate change. In June 2020, a group of European investment firms representing $2 trillion in assets threatened to divest from Brazil if it did not do more to protect the Amazon rainforest.
These types of ultimatums may be an effective solution for driving climate action forward. In December 2020, Brazil’s national oil company, Petrobras, pledged a 25% reduction in carbon emissions by 2030. When asked about commitments further into the future, however, the company’s CEO appeared to be less enthusiastic.
That’s like a fad, to make promises for 2050. It’s like a magical year. On this side of the Atlantic we have a different view of climate change.
— Roberto Castello Branco, CEO, Petrobras
With its 2030 pledge, Petrobras joins a growing collection of state-owned oil companies that have made public climate commitments. Another example is Malaysia’s Petronas, which in November 2020, announced its intention to achieve net-zero carbon emissions by 2050. Petronas is wholly owned by the Malaysian government and is the country’s only entry on the Fortune Global 500.
Challenges Lie Ahead
Between geopolitical conflicts, environmental concerns, and price fluctuations, state-owned oil companies are likely to face a much tougher environment in the decades to come.
For Petronas, achieving its 2050 climate commitments will require significant investment in cleaner forms of energy. The company has been involved in numerous solar energy projects across Asia and has stated its interests in hydrogen fuels.
Elsewhere, China’s national oil companies are dealing with a more near-term threat. In compliance with an executive order issued by the Trump Administration in November 2020, the New York Stock Exchange (NYSE) announced it would delist three of China’s state-run telecom companies. Analysts believe oil companies such as Sinopec could be delisted next, due to their ties with the Chinese military.


Energy
The World’s Biggest Nuclear Energy Producers
China has grown its nuclear capacity over the last decade, now ranking second on the list of top nuclear energy producers.


The World’s Biggest Nuclear Energy Producers
This was originally posted on our Voronoi app. Download the app for free on Apple or Android and discover incredible data-driven charts from a variety of trusted sources.
Scientists in South Korea recently broke a record in a nuclear fusion experiment. For 48 seconds, they sustained a temperature seven times that of the sun’s core.
But generating commercially viable energy from nuclear fusion still remains more science fiction than reality. Meanwhile, its more reliable sibling, nuclear fission, has been powering our world for many decades.
In this graphic, we visualized the top producers of nuclear energy by their share of the global total, measured in terawatt hours (TWh). Data for this was sourced from the Nuclear Energy Institute, last updated in August 2022.
Which Country Generates the Most Nuclear Energy?
Nuclear energy production in the U.S. is more than twice the amount produced by China (ranked second) and France (ranked third) put together. In total, the U.S. accounts for nearly 30% of global nuclear energy output.
However, nuclear power only accounts for one-fifth of America’s electricity supply. This is in contrast to France, which generates 60% of its electricity from nuclear plants.
| Rank | Country | Nuclear Energy Produced (TWh) | % of Total |
|---|---|---|---|
| 1 | 🇺🇸 U.S. | 772 | 29% |
| 2 | 🇨🇳 China | 383 | 14% |
| 3 | 🇫🇷 France | 363 | 14% |
| 4 | 🇷🇺 Russia | 208 | 8% |
| 5 | 🇰🇷 South Korea | 150 | 6% |
| 6 | 🇨🇦 Canada | 87 | 3% |
| 7 | 🇺🇦 Ukraine | 81 | 3% |
| 8 | 🇩🇪 Germany | 65 | 2% |
| 9 | 🇯🇵 Japan | 61 | 2% |
| 10 | 🇪🇸 Spain | 54 | 2% |
| 11 | 🇸🇪 Sweden | 51 | 2% |
| 12 | 🇧🇪 Belgium | 48 | 2% |
| 13 | 🇬🇧 UK | 42 | 2% |
| 14 | 🇮🇳 India | 40 | 2% |
| 15 | 🇨🇿 Czech Republic | 29 | 1% |
| N/A | 🌐 Other | 219 | 8% |
| N/A | 🌍 Total | 2,653 | 100% |
Another highlight is how China has rapidly grown its nuclear energy capabilities in the last decade. Between 2016 and 2021, for example, it increased its share of global nuclear energy output from less than 10% to more than 14%, overtaking France for second place.
On the opposite end, the UK’s share has slipped to 2% over the same time period.
Meanwhile, Ukraine has heavily relied on nuclear energy to power its grid. In March 2022, it lost access to its key Zaporizhzhia Nuclear Power Station after Russian forces wrested control of the facility. With six 1,000 MW reactors, the plant is one of the largest in Europe. It is currently not producing any power, and has been the site of recent drone attacks.

-

 Green2 weeks ago
Ranked: Top Countries by Total Forest Loss Since 2001
-

 Travel1 week ago
Ranked: The World’s Top Flight Routes, by Revenue
-

 Technology2 weeks ago
Ranked: Semiconductor Companies by Industry Revenue Share
-

 Money2 weeks ago
Which States Have the Highest Minimum Wage in America?
-

 Real Estate2 weeks ago
Ranked: The Most Valuable Housing Markets in America
-

 Markets2 weeks ago
Charted: Big Four Market Share by S&P 500 Audits
-

 AI2 weeks ago
The Stock Performance of U.S. Chipmakers So Far in 2024
-

 Automotive2 weeks ago
Almost Every EV Stock is Down After Q1 2024