Money
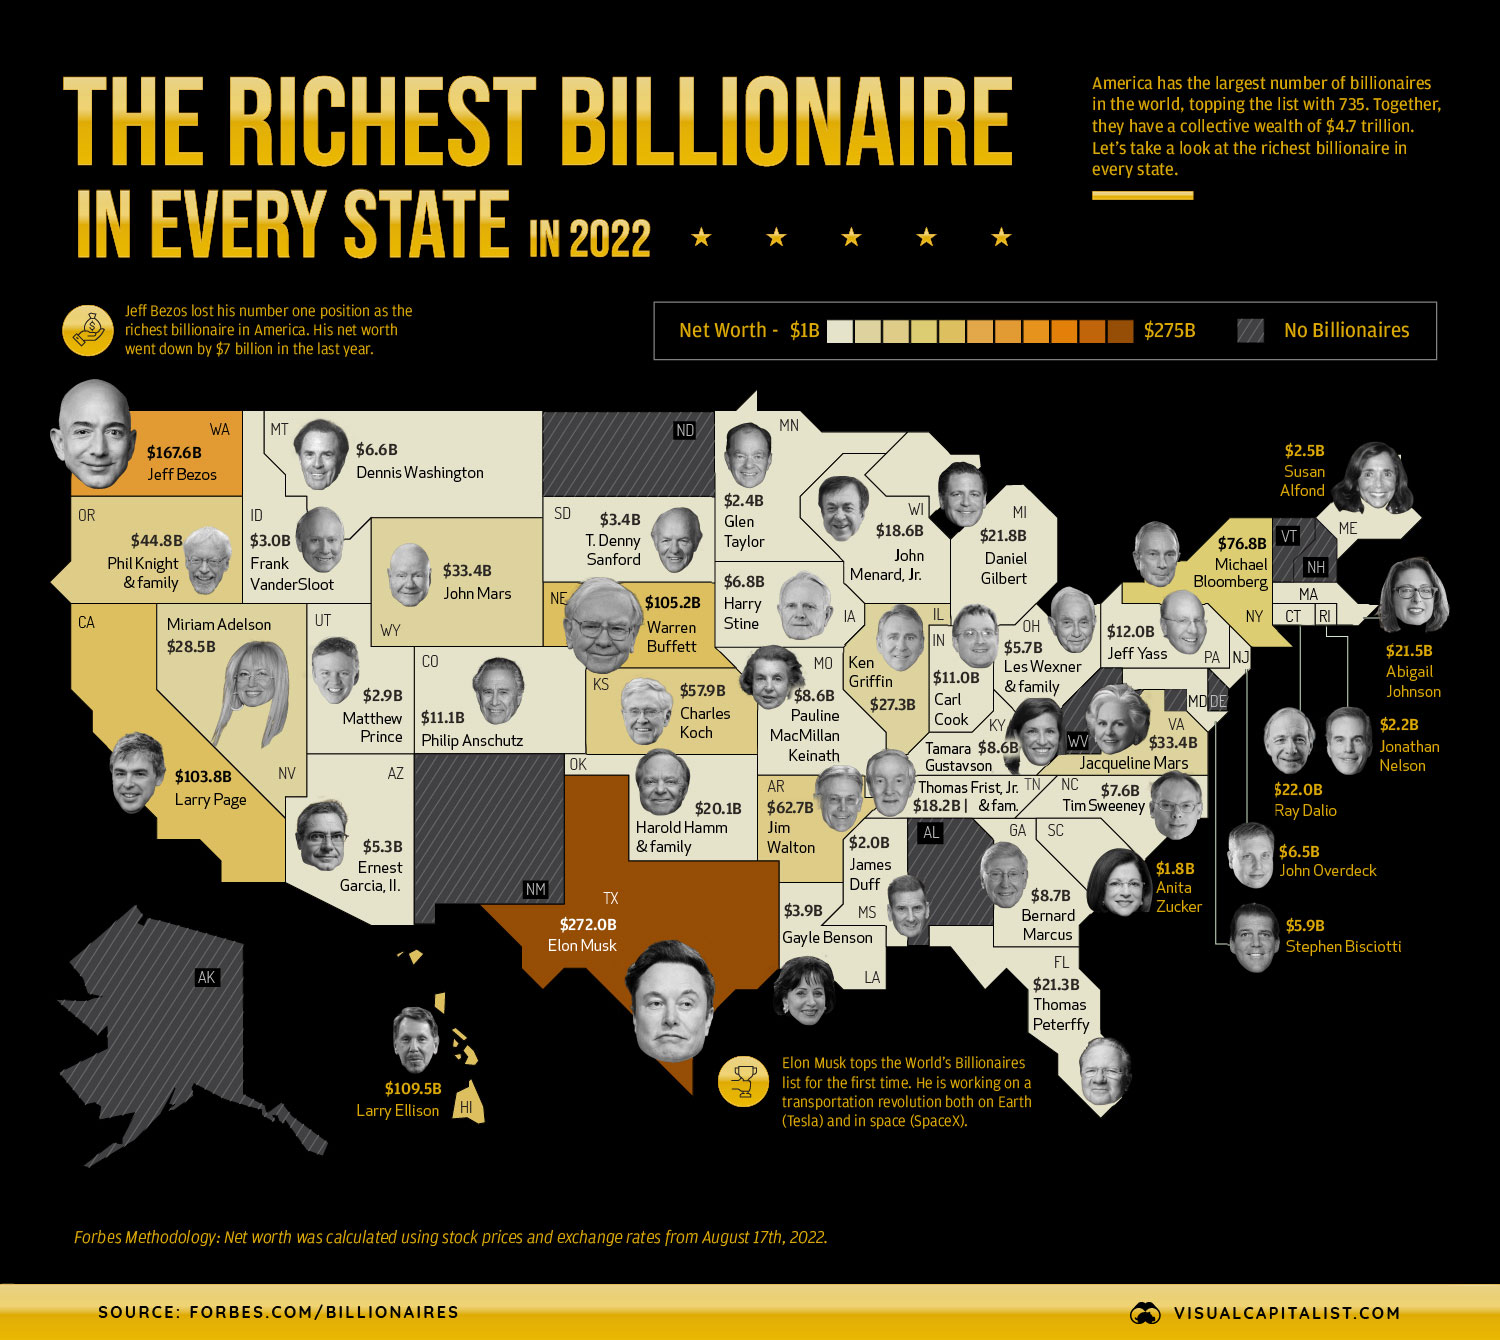
Mapped: The Wealthiest Billionaire in Each U.S. State in 2022
Check out the latest 2023 update of the richest person in each state.


Mapped: The Wealthiest Billionaire in Each U.S. State in 2022
Check out the latest 2023 update of the richest person in each state.
The U.S. is home to over a quarter of the world’s billionaires, representing about 720 of the roughly 2,700 that exist globally.
While the country has more billionaires than any other, the U.S. share of global billionaires has actually been shrinking in recent decades. In 2010, about 40% of the world’s billionaire population lived in America—and today, that number is closer to 27%.
But who is the richest billionaire in every American state in 2022? This graphic uses data from Forbes to find out.
The Richest of the Rich
The billionaires on this list have made their fortune in a wide range of industries, including tech, automobiles, asset management, and video games.
Jeff Bezos and Elon Musk have had their relative fortunes fluctuate in tandem with Amazon and Tesla stock prices in recent years. The volatility in share prices has meant they’ve each carried the title of the world’s wealthiest person at varying points.
| Rank | Name | Net Worth ($B) | Residence (State) |
|---|---|---|---|
| #1 | Elon Musk | 272.0 | Texas |
| #2 | Jeff Bezos | 167.6 | Washington |
| #3 | Larry Ellison | 109.5 | Hawaii |
| #4 | Warren Buffett | 105.2 | Nebraska |
| #5 | Larry Page | 103.8 | California |
| #6 | Michael Bloomberg | 76.8 | New York |
| #7 | Jim Walton | 62.7 | Arkansas |
| #8 | Charles Koch | 57.9 | Kansas |
| #9 | Phil Knight & Family | 44.8 | Oregon |
| #10 | Jacqueline Mars | 33.4 | Virginia |
| #11 | John Mars | 33.4 | Wyoming |
| #12 | Miriam Adelson | 28.5 | Nevada |
| #13 | Ken Griffin | 27.3 | Illinois |
| #14 | Ray Dalio | 22.0 | Connecticut |
| #15 | Daniel Gilbert | 21.8 | Michigan |
| #16 | Abigail Johnson | 21.5 | Massachusetts |
| #17 | Thomas Peterffy | 21.3 | Florida |
| #18 | Harold Hamm & family | 20.1 | Oklahoma |
| #19 | John Menard, Jr. | 18.6 | Wisconsin |
| #20 | Thomas Frist, Jr. & family | 18.2 | Tennessee |
| #21 | Jeff Yass | 12.0 | Pennsylvania |
| #22 | Philip Anschutz | 11.1 | Colorado |
| #23 | Carl Cook | 11.0 | Indiana |
| #24 | Bernard Marcus | 8.7 | Georgia |
| #25 | Pauline MacMillan Keinath | 8.6 | Missouri |
| #26 | Tamara Gustavson | 8.6 | Kentucky |
| #27 | Tim Sweeney | 7.6 | North Carolina |
| #28 | Harry Stine | 6.8 | Iowa |
| #29 | Dennis Washington | 6.6 | Montana |
| #30 | John Overdeck | 6.5 | New Jersey |
| #31 | Stephen Bisciotti | 5.9 | Maryland |
| #32 | Les Wexner & family | 5.7 | Ohio |
| #33 | Ernest Garcia, II. | 5.3 | Arizona |
| #34 | Gayle Benson | 3.9 | Louisiana |
| #35 | T. Denny Sanford | 3.4 | South Dakota |
| #36 | Frank VanderSloot | 3.0 | Idaho |
| #37 | Matthew Prince | 2.9 | Utah |
| #38 | Susan Alfond | 2.5 | Maine |
| #39 | Glen Taylor | 2.4 | Minnesota |
| #40 | Jonathan Nelson | 2.2 | Rhode Island |
| #41 | James Duff | 2.0 | Mississippi |
| #42 | Anita Zucker | 1.8 | South Carolina |
Jeff Bezos previously had the top spot but now has a net worth of $162 billion. While he’s stepped down from the CEO role and has sold large amounts of Amazon stock, his ranking will likely still tie in closely to the company’s performance for the foreseeable future.
Elon Musk is the richest billionaire in Texas, however, he only recently became a resident of the state. His move is part of a broader migration trend occurring in the U.S. today, where California is experiencing a population decline for the first time ever. Last year, 68% of counties in California saw population declines, and data from the U.S. Census Bureau suggests many of these Americans opted for states like Florida and Texas.
| Region | Net Domestic Migration 2019-2020 | Net Domestic Migration 2020-2021 |
|---|---|---|
| Northeast | -315,166 | -399,638 |
| Midwest | -207,685 | -123,103 |
| South | +503,502 | +657,682 |
| West | 19,349 | -144,941 |
Between 2019 to 2021, the South is the only region that saw positive net flows of over a million people, while the Northeast, Midwest, and West all saw declines.
Warren Buffett, the “Oracle of Omaha,” is the richest billionaire in Nebraska by a wide margin, with a net worth of $105 billion. Despite the stock market experiencing one of its worst starts to the year historically, Buffett’s net worth has been surprisingly steady.
This might be due to value assets rotating back into fashion in favor of growth and tech themes this year. Also, historically Buffett has been bullish in environments where fear and negative sentiment reflect through lower asset prices.
Female Billionaires
There are eight different women that hold the title of richest billionaire in their state.
Tamara Gustavson is Public Storage’s largest shareholder, with an 11% stake in the company, valued at $60 billion on the New York Stock Exchange. In addition, she acts as the director of the company and is the daughter of founder B. Wayne Hughes, who recently passed away last year. Incredibly, Public Storage operates more than 170 million square feet of real estate.
Abigail Johnson and Jacqueline Mars were featured on our infographic showing the richest women in the world last year. Johnson has served as CEO of top asset manager Fidelity, which her grandfather Edward Johnson founded. And Jacqueline Mars is part of the Mars family, which owns the world’s largest candy maker.
Big Disparities
The U.S. wealth landscape is one of extremes. On one end, there are ample opportunities to earn substantial wealth, but on the other, wealth inequality and income disparity are higher than many other peer countries.
This productivity and hustle-oriented culture suggests that while there isn’t a billionaire in every state in 2022, it seems like it’s only a matter of time before the likes of Alabama, New Mexico, and North Dakota add a billionaire to their ranks.


Money
Charted: Who Has Savings in This Economy?
Older, better-educated adults are winning the savings game, reveals a January survey by the National Opinion Research Center at the University of Chicago.


Who Has Savings in This Economy?
This was originally posted on our Voronoi app. Download the app for free on iOS or Android and discover incredible data-driven charts from a variety of trusted sources.
Two full years of inflation have taken their toll on American households. In 2023, the country’s collective credit card debt crossed $1 trillion for the first time. So who is managing to save money in the current economic environment?
We visualize the percentage of respondents to the statement “I have money leftover at the end of the month” categorized by age and education qualifications. Data is sourced from a National Endowment for Financial Education (NEFE) report, published last month.
The survey for NEFE was conducted from January 12-14, 2024, by the National Opinion Research Center at the University of Chicago. It involved 1,222 adults aged 18+ and aimed to be representative of the U.S. population.
Older Americans Save More Than Their Younger Counterparts
General trends from this dataset indicate that as respondents get older, a higher percentage of them are able to save.
| Age | Always/Often | Sometimes | Rarely/Never |
|---|---|---|---|
| 18–29 | 29% | 33% | 38% |
| 30–44 | 36% | 27% | 37% |
| 45–59 | 39% | 23% | 38% |
| Above 60 | 49% | 28% | 23% |
| All Adults | 39% | 33% | 27% |
Note: Percentages are rounded and may not sum to 100.
Perhaps not surprisingly, those aged 60+ are the age group with the highest percentage saying they have leftover money at the end of the month. This age group spent the most time making peak earnings in their careers, are more likely to have investments, and are more likely to have paid off major expenses like a mortgage or raising a family.
The Impact of Higher Education on Earnings and Savings
Based on this survey, higher education dramatically improves one’s ability to save. Shown in the table below, those with a bachelor’s degree or higher are three times more likely to have leftover money than those without a high school diploma.
| Education | Always/Often | Sometimes | Rarely/Never |
|---|---|---|---|
| No HS Diploma | 18% | 26% | 56% |
| HS Diploma | 28% | 33% | 39% |
| Associate Degree | 33% | 31% | 36% |
| Bachelor/Higher Degree | 59% | 21% | 20% |
| All Adults | 39% | 33% | 27% |
Note: Percentages are rounded and may not sum to 100.
As the Bureau of Labor Statistics notes, earnings improve with every level of education completed.
For example, those with a high school diploma made 25% more than those without in 2022. And as the qualifications increase, the effects keep stacking.
Meanwhile, a Federal Reserve study also found that those with more education tended to make financial decisions that contributed to building wealth, of which the first step is to save.

-

 Markets1 week ago
U.S. Debt Interest Payments Reach $1 Trillion
-

 Business2 weeks ago
Charted: Big Four Market Share by S&P 500 Audits
-

 Real Estate2 weeks ago
Ranked: The Most Valuable Housing Markets in America
-

 Money2 weeks ago
Which States Have the Highest Minimum Wage in America?
-

 AI2 weeks ago
Ranked: Semiconductor Companies by Industry Revenue Share
-

 Markets2 weeks ago
Ranked: The World’s Top Flight Routes, by Revenue
-

 Demographics2 weeks ago
Population Projections: The World’s 6 Largest Countries in 2075
-

 Markets2 weeks ago
The Top 10 States by Real GDP Growth in 2023