Energy
Mapped: Solar Power by Country in 2021
![]() Subscribe to the Elements free mailing list for more like this
Subscribe to the Elements free mailing list for more like this


Mapped: Solar Power by Country in 2021
This was originally posted on Elements. Sign up to the free mailing list to get beautiful visualizations on natural resource megatrends in your email every week.
The world is adopting renewable energy at an unprecedented pace, and solar power is the energy source leading the way.
Despite a 4.5% fall in global energy demand in 2020, renewable energy technologies showed promising progress. While the growth in renewables was strong across the board, solar power led from the front with 127 gigawatts installed in 2020, its largest-ever annual capacity expansion.
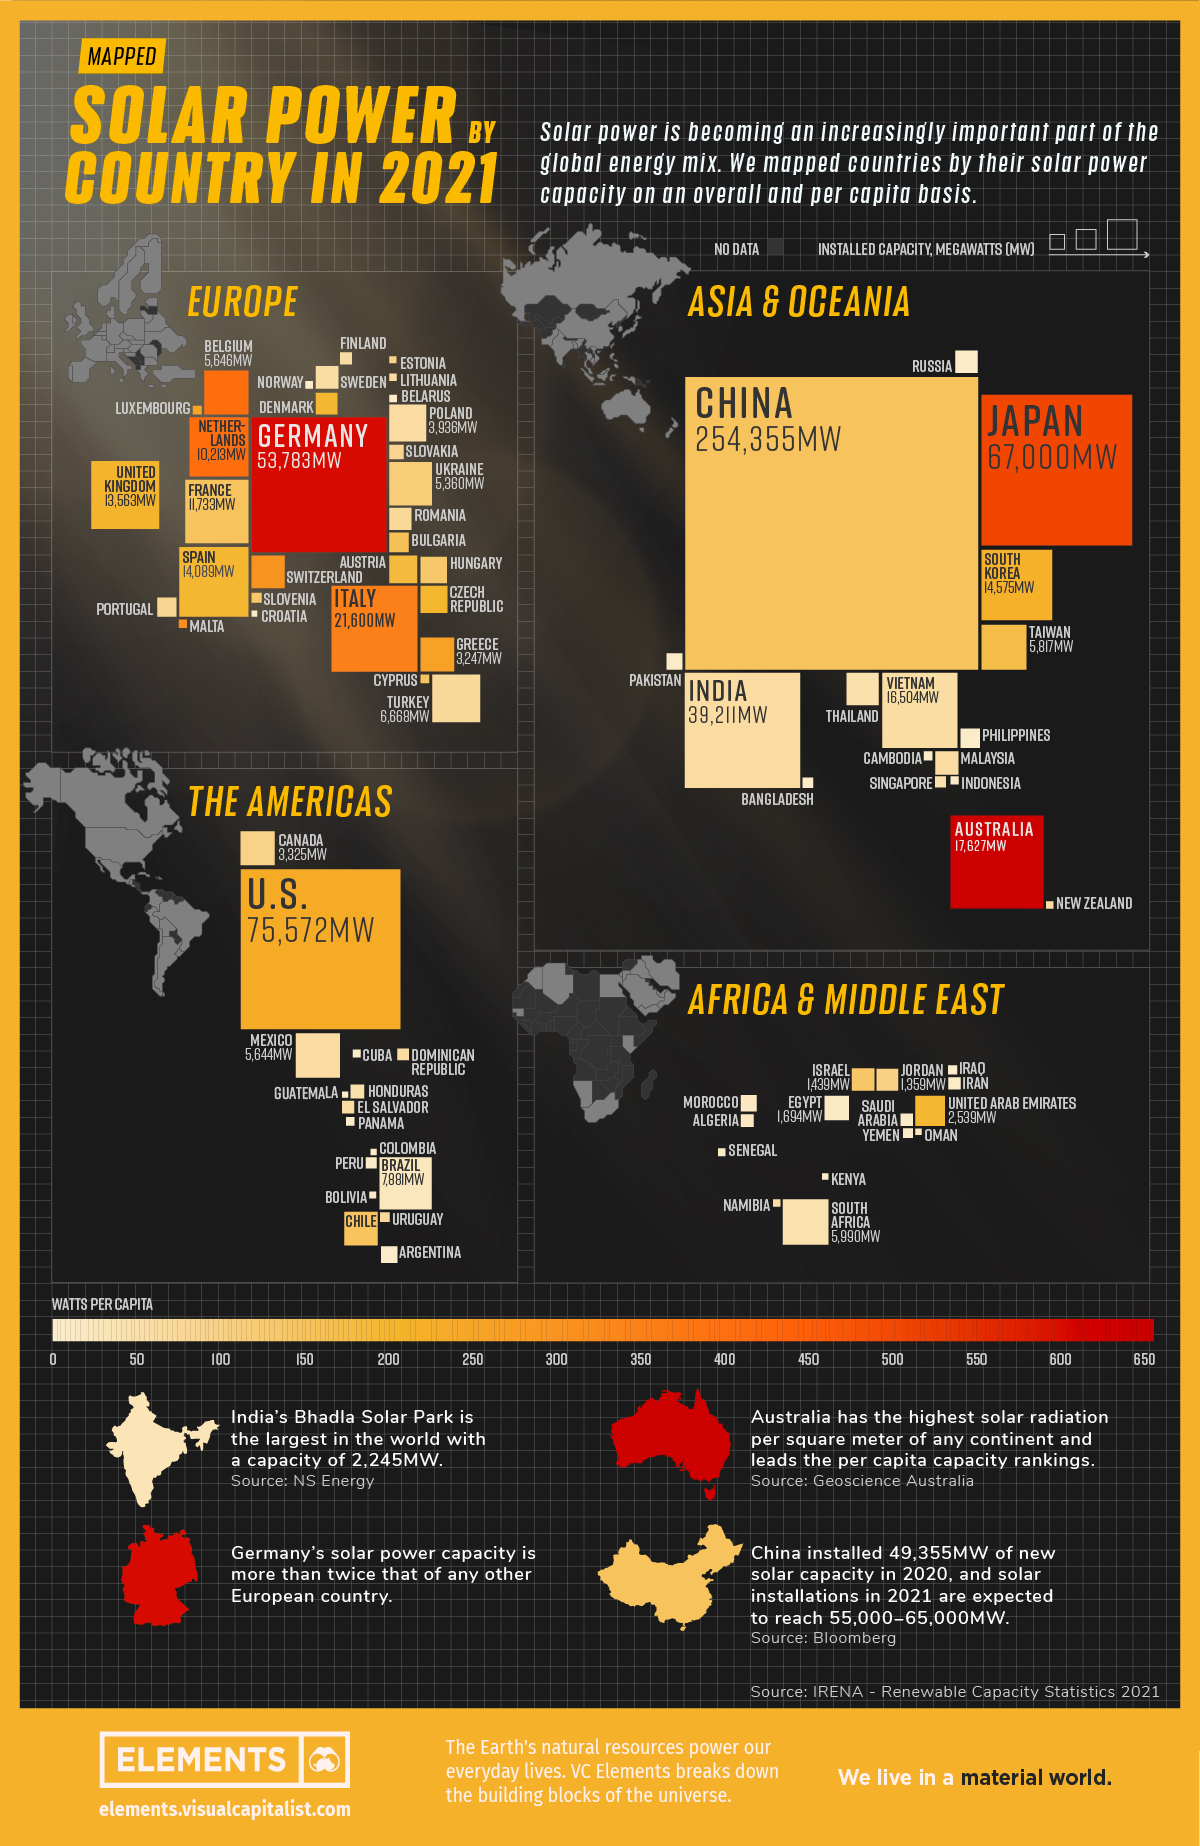
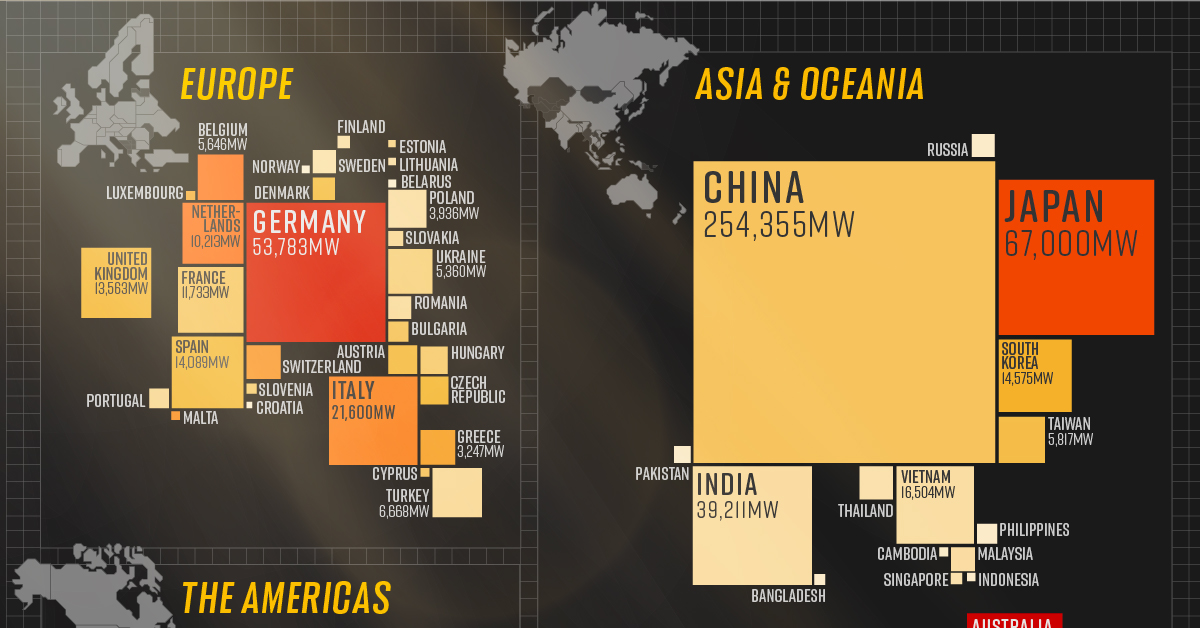
The above infographic uses data from the International Renewable Energy Agency (IRENA) to map solar power capacity by country in 2021. This includes both solar photovoltaic (PV) and concentrated solar power capacity.
The Solar Power Leaderboard
From the Americas to Oceania, countries in virtually every continent (except Antarctica) added more solar to their mix last year. Here’s a snapshot of solar power capacity by country at the beginning of 2021:
| Country | Installed capacity, megawatts | Watts* per capita | % of world total |
|---|---|---|---|
| China 🇨🇳 | 254,355 | 147 | 35.6% |
| U.S. 🇺🇸 | 75,572 | 231 | 10.6% |
| Japan 🇯🇵 | 67,000 | 498 | 9.4% |
| Germany 🇩🇪 | 53,783 | 593 | 7.5% |
| India 🇮🇳 | 39,211 | 32 | 5.5% |
| Italy 🇮🇹 | 21,600 | 345 | 3.0% |
| Australia 🇦🇺 | 17,627 | 637 | 2.5% |
| Vietnam 🇻🇳 | 16,504 | 60 | 2.3% |
| South Korea 🇰🇷 | 14,575 | 217 | 2.0% |
| Spain 🇪🇸 | 14,089 | 186 | 2.0% |
| United Kingdom 🇬🇧 | 13,563 | 200 | 1.9% |
| France 🇫🇷 | 11,733 | 148 | 1.6% |
| Netherlands 🇳🇱 | 10,213 | 396 | 1.4% |
| Brazil 🇧🇷 | 7,881 | 22 | 1.1% |
| Turkey 🇹🇷 | 6,668 | 73 | 0.9% |
| South Africa 🇿🇦 | 5,990 | 44 | 0.8% |
| Taiwan 🇹🇼 | 5,817 | 172 | 0.8% |
| Belgium 🇧🇪 | 5,646 | 394 | 0.8% |
| Mexico 🇲🇽 | 5,644 | 35 | 0.8% |
| Ukraine 🇺🇦 | 5,360 | 114 | 0.8% |
| Poland 🇵🇱 | 3,936 | 34 | 0.6% |
| Canada 🇨🇦 | 3,325 | 88 | 0.5% |
| Greece 🇬🇷 | 3,247 | 258 | 0.5% |
| Chile 🇨🇱 | 3,205 | 142 | 0.4% |
| Switzerland 🇨🇭 | 3,118 | 295 | 0.4% |
| Thailand 🇹🇭 | 2,988 | 43 | 0.4% |
| United Arab Emirates 🇦🇪 | 2,539 | 185 | 0.4% |
| Austria 🇦🇹 | 2,220 | 178 | 0.3% |
| Czech Republic 🇨🇿 | 2,073 | 194 | 0.3% |
| Hungary 🇭🇺 | 1,953 | 131 | 0.3% |
| Egypt 🇪🇬 | 1,694 | 17 | 0.2% |
| Malaysia 🇲🇾 | 1,493 | 28 | 0.2% |
| Israel 🇮🇱 | 1,439 | 134 | 0.2% |
| Russia 🇷🇺 | 1,428 | 7 | 0.2% |
| Sweden 🇸🇪 | 1,417 | 63 | 0.2% |
| Romania 🇷🇴 | 1,387 | 71 | 0.2% |
| Jordan 🇯🇴 | 1,359 | 100 | 0.2% |
| Denmark 🇩🇰 | 1,300 | 186 | 0.2% |
| Bulgaria 🇧🇬 | 1,073 | 152 | 0.2% |
| Philippines 🇵🇭 | 1,048 | 9 | 0.1% |
| Portugal 🇵🇹 | 1,025 | 81 | 0.1% |
| Argentina 🇦🇷 | 764 | 17 | 0.1% |
| Pakistan 🇵🇰 | 737 | 6 | 0.1% |
| Morocco 🇲🇦 | 734 | 6 | 0.1% |
| Slovakia 🇸🇰 | 593 | 87 | 0.1% |
| Honduras 🇭🇳 | 514 | 53 | 0.1% |
| Algeria 🇩🇿 | 448 | 10 | 0.1% |
| El Salvador 🇸🇻 | 429 | 66 | 0.1% |
| Iran 🇮🇷 | 414 | 5 | 0.1% |
| Saudi Arabia 🇸🇦 | 409 | 12 | 0.1% |
| Finland 🇫🇮 | 391 | 39 | 0.1% |
| Dominican Republic 🇩🇴 | 370 | 34 | 0.1% |
| Peru 🇵🇪 | 331 | 10 | 0.05% |
| Singapore 🇸🇬 | 329 | 45 | 0.05% |
| Bangladesh 🇧🇩 | 301 | 2 | 0.04% |
| Slovenia 🇸🇮 | 267 | 128 | 0.04% |
| Uruguay 🇺🇾 | 256 | 74 | 0.04% |
| Yemen 🇾🇪 | 253 | 8 | 0.04% |
| Iraq 🇮🇶 | 216 | 5 | 0.03% |
| Cambodia 🇰🇭 | 208 | 12 | 0.03% |
| Cyprus 🇨🇾 | 200 | 147 | 0.03% |
| Panama 🇵🇦 | 198 | 46 | 0.03% |
| Luxembourg 🇱🇺 | 195 | 244 | 0.03% |
| Malta 🇲🇹 | 184 | 312 | 0.03% |
| Indonesia 🇮🇩 | 172 | 1 | 0.02% |
| Cuba 🇨🇺 | 163 | 14 | 0.02% |
| Belarus 🇧🇾 | 159 | 17 | 0.02% |
| Senegal 🇸🇳 | 155 | 8 | 0.02% |
| Norway 🇳🇴 | 152 | 17 | 0.02% |
| Lithuania 🇱🇹 | 148 | 37 | 0.02% |
| Namibia 🇳🇦 | 145 | 55 | 0.02% |
| New Zealand 🇳🇿 | 142 | 29 | 0.02% |
| Estonia 🇪🇪 | 130 | 98 | 0.02% |
| Bolivia 🇧🇴 | 120 | 10 | 0.02% |
| Oman 🇴🇲 | 109 | 21 | 0.02% |
| Colombia 🇨🇴 | 107 | 2 | 0.01% |
| Kenya 🇰🇪 | 106 | 2 | 0.01% |
| Guatemala 🇬🇹 | 101 | 6 | 0.01% |
| Croatia 🇭🇷 | 85 | 17 | 0.01% |
| World total 🌎 | 713,970 | 83 | 100.0% |
*1 megawatt = 1,000,000 watts.
China is the undisputed leader in solar installations, with over 35% of global capacity. What’s more, the country is showing no signs of slowing down. It has the world’s largest wind and solar project in the pipeline, which could add another 400,000MW to its clean energy capacity.
Following China from afar is the U.S., which recently surpassed 100,000MW of solar power capacity after installing another 50,000MW in the first three months of 2021. Annual solar growth in the U.S. has averaged an impressive 42% over the last decade. Policies like the solar investment tax credit, which offers a 26% tax credit on residential and commercial solar systems, have helped propel the industry forward.
Although Australia hosts a fraction of China’s solar capacity, it tops the per capita rankings due to its relatively low population of 26 million people. The Australian continent receives the highest amount of solar radiation of any continent, and over 30% of Australian households now have rooftop solar PV systems.
China: The Solar Champion
In 2020, President Xi Jinping stated that China aims to be carbon neutral by 2060, and the country is taking steps to get there.
China is a leader in the solar industry, and it seems to have cracked the code for the entire solar supply chain. In 2019, Chinese firms produced 66% of the world’s polysilicon, the initial building block of silicon-based photovoltaic (PV) panels. Furthermore, more than three-quarters of solar cells came from China, along with 72% of the world’s PV panels.
With that said, it’s no surprise that 5 of the world’s 10 largest solar parks are in China, and it will likely continue to build more as it transitions to carbon neutrality.
What’s Driving the Rush for Solar Power?
The energy transition is a major factor in the rise of renewables, but solar’s growth is partly due to how cheap it has become over time. Solar energy costs have fallen exponentially over the last decade, and it’s now the cheapest source of new energy generation.
Since 2010, the cost of solar power has seen a 85% decrease, down from $0.28 to $0.04 per kWh. According to MIT researchers, economies of scale have been the single-largest factor in continuing the cost decline for the last decade. In other words, as the world installed and made more solar panels, production became cheaper and more efficient.
This year, solar costs are rising due to supply chain issues, but the rise is likely to be temporary as bottlenecks resolve.


Energy
The World’s Biggest Nuclear Energy Producers
China has grown its nuclear capacity over the last decade, now ranking second on the list of top nuclear energy producers.


The World’s Biggest Nuclear Energy Producers
This was originally posted on our Voronoi app. Download the app for free on Apple or Android and discover incredible data-driven charts from a variety of trusted sources.
Scientists in South Korea recently broke a record in a nuclear fusion experiment. For 48 seconds, they sustained a temperature seven times that of the sun’s core.
But generating commercially viable energy from nuclear fusion still remains more science fiction than reality. Meanwhile, its more reliable sibling, nuclear fission, has been powering our world for many decades.
In this graphic, we visualized the top producers of nuclear energy by their share of the global total, measured in terawatt hours (TWh). Data for this was sourced from the Nuclear Energy Institute, last updated in August 2022.
Which Country Generates the Most Nuclear Energy?
Nuclear energy production in the U.S. is more than twice the amount produced by China (ranked second) and France (ranked third) put together. In total, the U.S. accounts for nearly 30% of global nuclear energy output.
However, nuclear power only accounts for one-fifth of America’s electricity supply. This is in contrast to France, which generates 60% of its electricity from nuclear plants.
| Rank | Country | Nuclear Energy Produced (TWh) | % of Total |
|---|---|---|---|
| 1 | 🇺🇸 U.S. | 772 | 29% |
| 2 | 🇨🇳 China | 383 | 14% |
| 3 | 🇫🇷 France | 363 | 14% |
| 4 | 🇷🇺 Russia | 208 | 8% |
| 5 | 🇰🇷 South Korea | 150 | 6% |
| 6 | 🇨🇦 Canada | 87 | 3% |
| 7 | 🇺🇦 Ukraine | 81 | 3% |
| 8 | 🇩🇪 Germany | 65 | 2% |
| 9 | 🇯🇵 Japan | 61 | 2% |
| 10 | 🇪🇸 Spain | 54 | 2% |
| 11 | 🇸🇪 Sweden | 51 | 2% |
| 12 | 🇧🇪 Belgium | 48 | 2% |
| 13 | 🇬🇧 UK | 42 | 2% |
| 14 | 🇮🇳 India | 40 | 2% |
| 15 | 🇨🇿 Czech Republic | 29 | 1% |
| N/A | 🌐 Other | 219 | 8% |
| N/A | 🌍 Total | 2,653 | 100% |
Another highlight is how China has rapidly grown its nuclear energy capabilities in the last decade. Between 2016 and 2021, for example, it increased its share of global nuclear energy output from less than 10% to more than 14%, overtaking France for second place.
On the opposite end, the UK’s share has slipped to 2% over the same time period.
Meanwhile, Ukraine has heavily relied on nuclear energy to power its grid. In March 2022, it lost access to its key Zaporizhzhia Nuclear Power Station after Russian forces wrested control of the facility. With six 1,000 MW reactors, the plant is one of the largest in Europe. It is currently not producing any power, and has been the site of recent drone attacks.

-

 Real Estate2 weeks ago
Visualizing America’s Shortage of Affordable Homes
-

 Technology1 week ago
Ranked: Semiconductor Companies by Industry Revenue Share
-

 Money1 week ago
Which States Have the Highest Minimum Wage in America?
-

 Real Estate1 week ago
Ranked: The Most Valuable Housing Markets in America
-

 Business2 weeks ago
Charted: Big Four Market Share by S&P 500 Audits
-

 AI2 weeks ago
The Stock Performance of U.S. Chipmakers So Far in 2024
-

 Misc2 weeks ago
Almost Every EV Stock is Down After Q1 2024
-

 Money2 weeks ago
Where Does One U.S. Tax Dollar Go?