Energy
Mapped: Solar and Wind Power by Country
![]() Subscribe to the Elements free mailing list for more like this
Subscribe to the Elements free mailing list for more like this


Mapped: Solar and Wind Power by Country
This was originally posted on Elements. Sign up to the free mailing list to get beautiful visualizations on natural resource megatrends in your email every week.
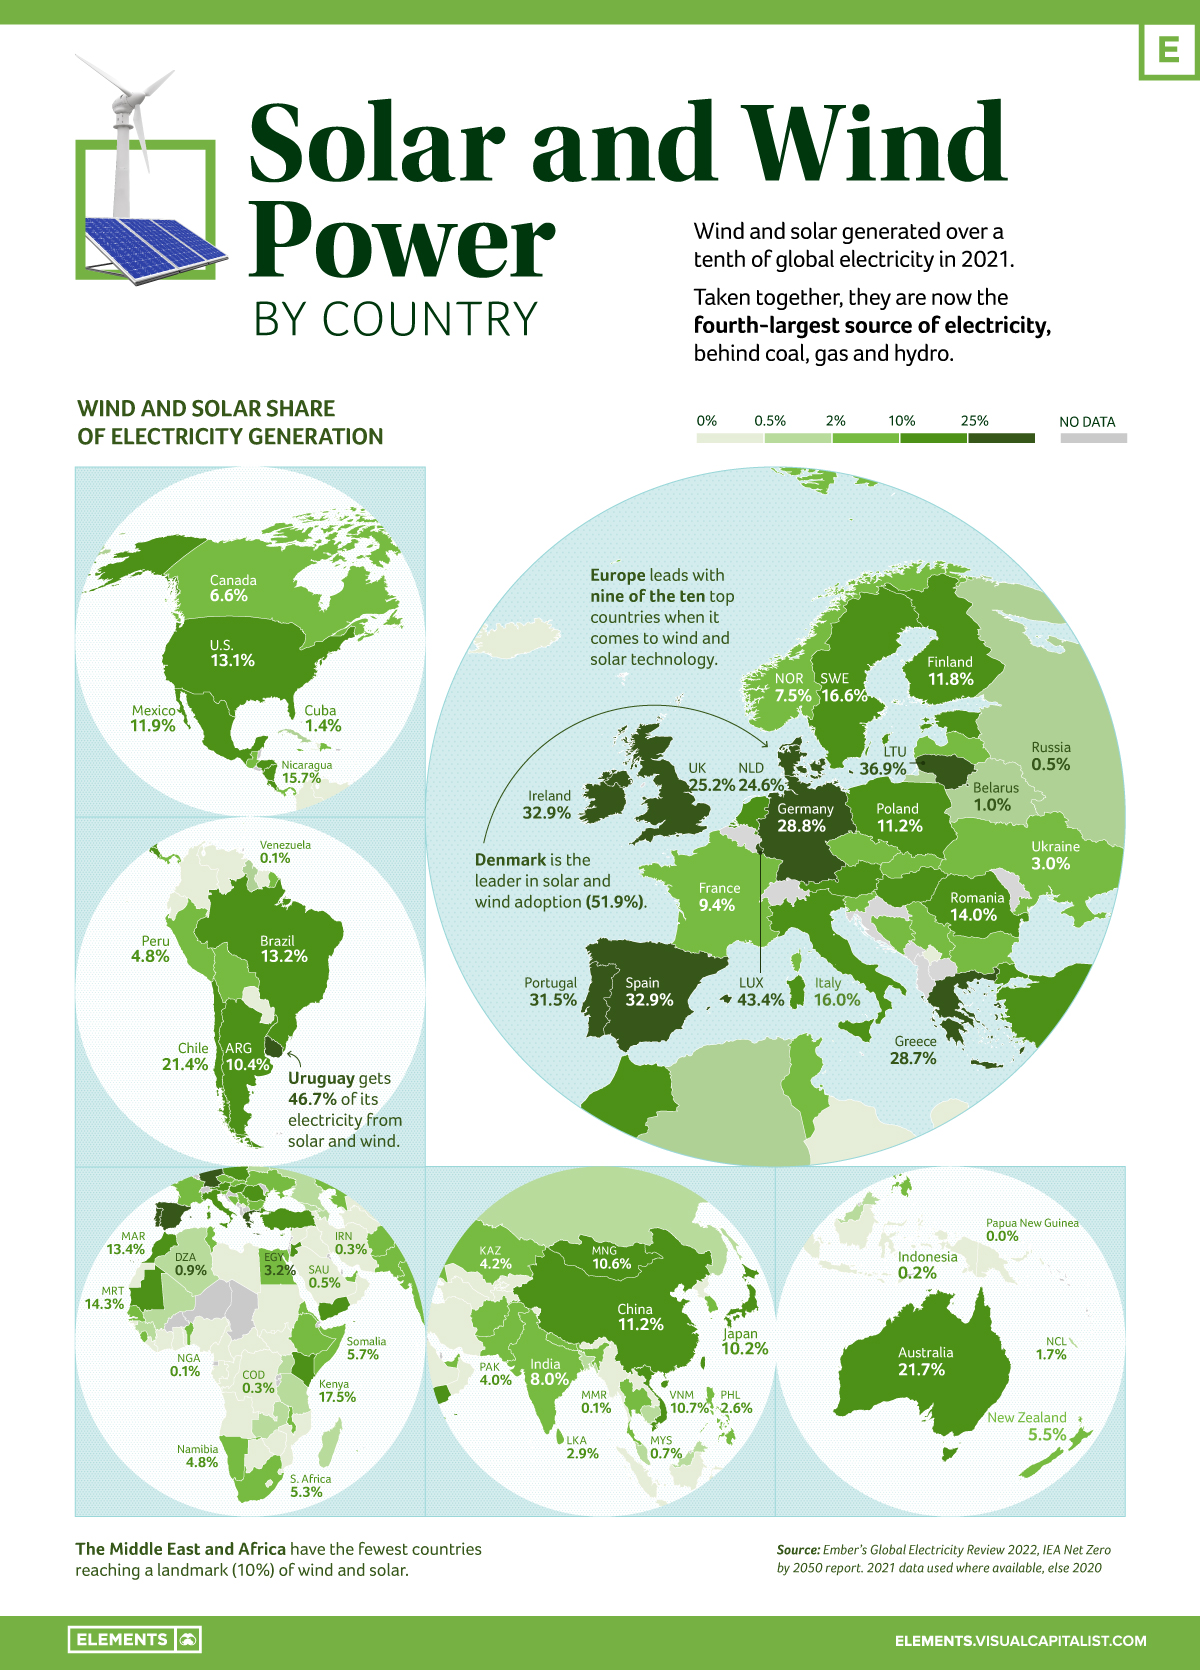
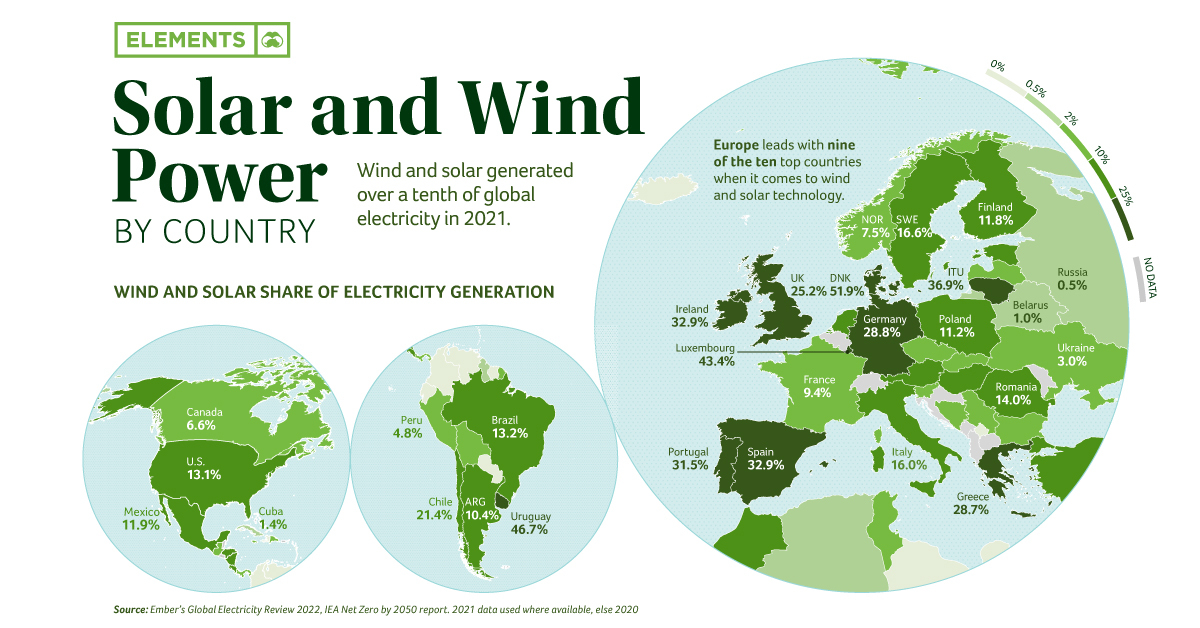
Wind and solar generate over a tenth of the world’s electricity. Taken together, they are the fourth-largest source of electricity, behind coal, gas, and hydro.
This infographic based on data from Ember shows the rise of electricity from these two clean sources over the last decade.
Europe Leads in Wind and Solar
Wind and solar generated 10.3% of global electricity for the first time in 2021, rising from 9.3% in 2020, and doubling their share compared to 2015 when the Paris Climate Agreement was signed.
In fact, 50 countries (26%) generated over a tenth of their electricity from wind and solar in 2021, with seven countries hitting this landmark for the first time: China, Japan, Mongolia, Vietnam, Argentina, Hungary, and El Salvador.
Denmark and Uruguay achieved 52% and 47% respectively, leading the way in technology for high renewable grid integration.
| Rank | Top Countries | Solar/Wind Power Share |
|---|---|---|
| #1 | 🇩🇰 Denmark | 51.9% |
| #2 | 🇺🇾 Uruguay | 46.7% |
| #3 | 🇱🇺 Luxembourg | 43.4% |
| #4 | 🇱🇹 Lithuania | 36.9% |
| #5 | 🇪🇸 Spain | 32.9% |
| #6 | 🇮🇪 Ireland | 32.9% |
| #7 | 🇵🇹 Portugal | 31.5% |
| #8 | 🇩🇪 Germany | 28.8% |
| #9 | 🇬🇷 Greece | 28.7% |
| #10 | 🇬🇧 United Kingdom | 25.2% |
From a regional perspective, Europe leads with nine of the top 10 countries. On the flipside, the Middle East and Africa have the fewest countries reaching the 10% threshold.
Further Renewables Growth Needed to meet Global Climate Goals
The electricity sector was the highest greenhouse gas emitting sector in 2020.
According to the International Energy Agency (IEA), the sector needs to hit net zero globally by 2040 to achieve the Paris Agreement’s goals of limiting global heating to 1.5 degrees. And to hit that goal, wind and solar power need to grow at nearly a 20% clip each year to 2030.
Despite the record rise in renewables, solar and wind electricity generation growth currently doesn’t meet the required marks to reach the Paris Agreement’s goals.
In fact, when the world faced an unprecedented surge in electricity demand in 2021, only 29% of the global rise in electricity demand was met with solar and wind.
Transition Underway
Even as emissions from the electricity sector are at an all-time high, there are signs that the global electricity transition is underway.
Governments like the U.S., Germany, UK, and Canada are planning to increase their share of clean electricity within the next decade and a half. Investments are also coming from the private sector, with companies like Amazon and Apple extending their positions on renewable energy to become some of the biggest buyers overall.
More wind and solar are being added to grids than ever, with renewables expected to provide the majority of clean electricity needed to phase out fossil fuels.


Energy
The World’s Biggest Nuclear Energy Producers
China has grown its nuclear capacity over the last decade, now ranking second on the list of top nuclear energy producers.


The World’s Biggest Nuclear Energy Producers
This was originally posted on our Voronoi app. Download the app for free on Apple or Android and discover incredible data-driven charts from a variety of trusted sources.
Scientists in South Korea recently broke a record in a nuclear fusion experiment. For 48 seconds, they sustained a temperature seven times that of the sun’s core.
But generating commercially viable energy from nuclear fusion still remains more science fiction than reality. Meanwhile, its more reliable sibling, nuclear fission, has been powering our world for many decades.
In this graphic, we visualized the top producers of nuclear energy by their share of the global total, measured in terawatt hours (TWh). Data for this was sourced from the Nuclear Energy Institute, last updated in August 2022.
Which Country Generates the Most Nuclear Energy?
Nuclear energy production in the U.S. is more than twice the amount produced by China (ranked second) and France (ranked third) put together. In total, the U.S. accounts for nearly 30% of global nuclear energy output.
However, nuclear power only accounts for one-fifth of America’s electricity supply. This is in contrast to France, which generates 60% of its electricity from nuclear plants.
| Rank | Country | Nuclear Energy Produced (TWh) | % of Total |
|---|---|---|---|
| 1 | 🇺🇸 U.S. | 772 | 29% |
| 2 | 🇨🇳 China | 383 | 14% |
| 3 | 🇫🇷 France | 363 | 14% |
| 4 | 🇷🇺 Russia | 208 | 8% |
| 5 | 🇰🇷 South Korea | 150 | 6% |
| 6 | 🇨🇦 Canada | 87 | 3% |
| 7 | 🇺🇦 Ukraine | 81 | 3% |
| 8 | 🇩🇪 Germany | 65 | 2% |
| 9 | 🇯🇵 Japan | 61 | 2% |
| 10 | 🇪🇸 Spain | 54 | 2% |
| 11 | 🇸🇪 Sweden | 51 | 2% |
| 12 | 🇧🇪 Belgium | 48 | 2% |
| 13 | 🇬🇧 UK | 42 | 2% |
| 14 | 🇮🇳 India | 40 | 2% |
| 15 | 🇨🇿 Czech Republic | 29 | 1% |
| N/A | 🌐 Other | 219 | 8% |
| N/A | 🌍 Total | 2,653 | 100% |
Another highlight is how China has rapidly grown its nuclear energy capabilities in the last decade. Between 2016 and 2021, for example, it increased its share of global nuclear energy output from less than 10% to more than 14%, overtaking France for second place.
On the opposite end, the UK’s share has slipped to 2% over the same time period.
Meanwhile, Ukraine has heavily relied on nuclear energy to power its grid. In March 2022, it lost access to its key Zaporizhzhia Nuclear Power Station after Russian forces wrested control of the facility. With six 1,000 MW reactors, the plant is one of the largest in Europe. It is currently not producing any power, and has been the site of recent drone attacks.

-

 Green2 weeks ago
Ranked: Top Countries by Total Forest Loss Since 2001
-

 Travel1 week ago
Ranked: The World’s Top Flight Routes, by Revenue
-

 Technology2 weeks ago
Ranked: Semiconductor Companies by Industry Revenue Share
-

 Money2 weeks ago
Which States Have the Highest Minimum Wage in America?
-

 Real Estate2 weeks ago
Ranked: The Most Valuable Housing Markets in America
-

 Markets2 weeks ago
Charted: Big Four Market Share by S&P 500 Audits
-

 AI2 weeks ago
The Stock Performance of U.S. Chipmakers So Far in 2024
-

 Automotive2 weeks ago
Almost Every EV Stock is Down After Q1 2024