Markets
Mapped: GDP Growth Forecasts by Country, in 2023
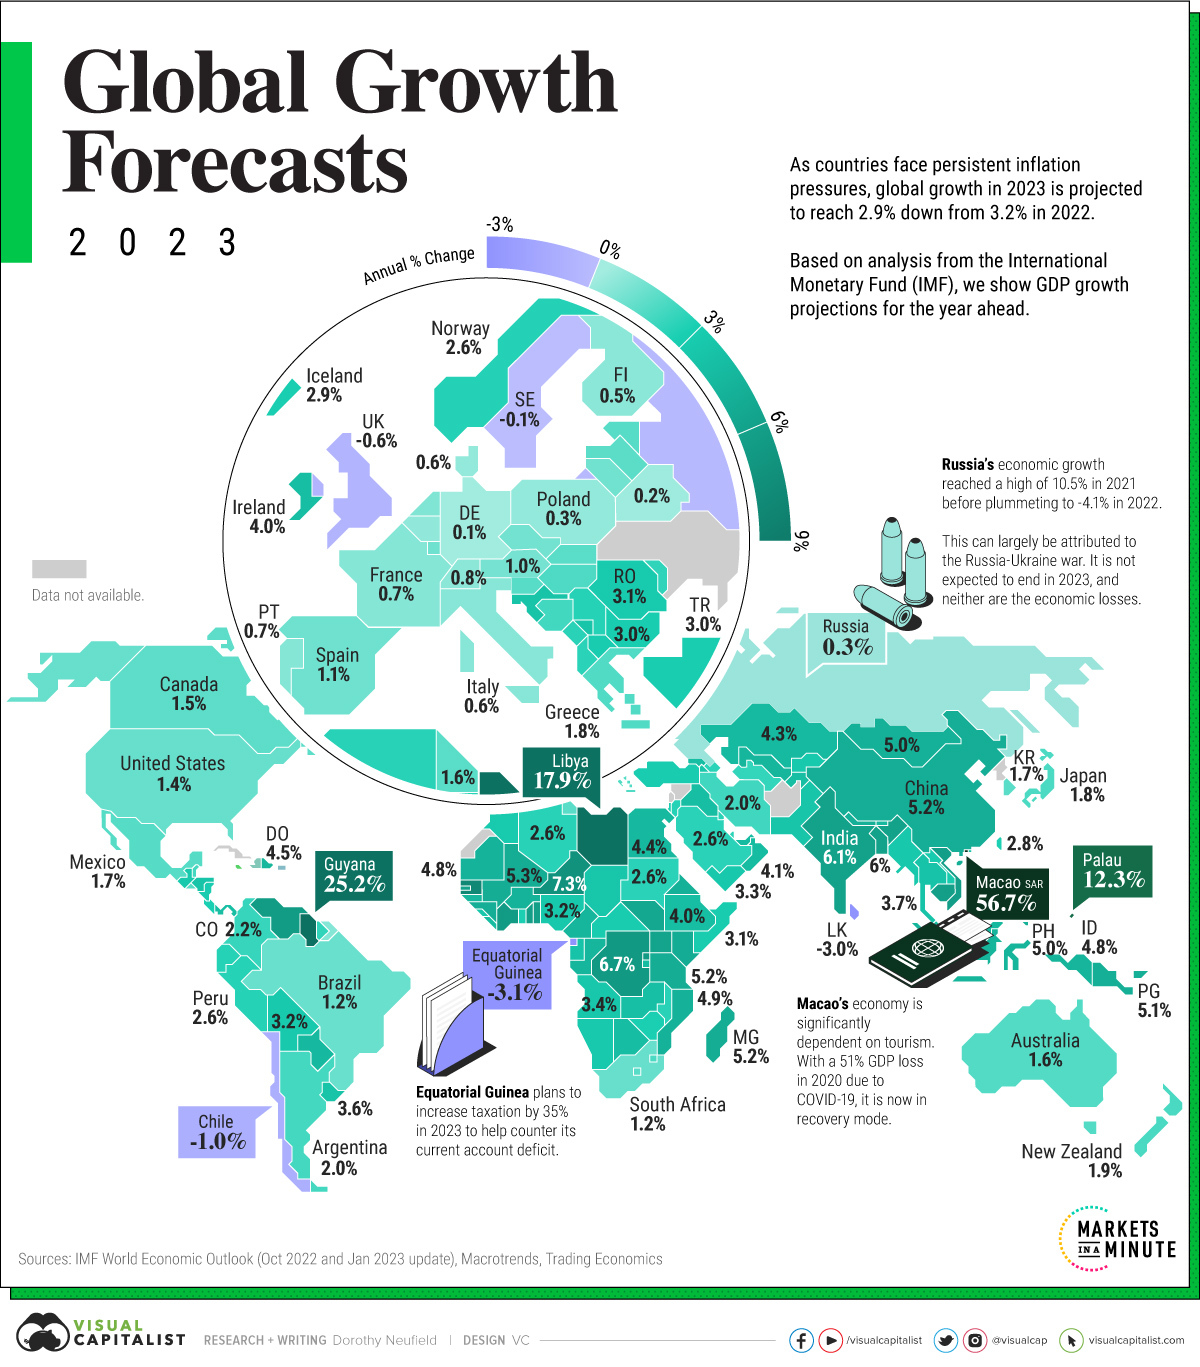


Mapped: GDP Growth Forecasts by Country, in 2023
This was originally posted on Advisor Channel. Sign up to the free mailing list to get beautiful visualizations on financial markets that help advisors and their clients.
Since Russia’s invasion of Ukraine early last year, talk of global recession has dominated the outlook for 2023.
High inflation, spurred by rising energy costs, has tested GDP growth. Tightening monetary policy in the U.S., with interest rates jumping from roughly 0% to over 4% in 2022, has historically preceded a downturn about one to two years later.
For European economies, energy prices are critical. The good news is that prices have fallen recently since March highs, but the continent remains on shaky ground.
The above infographic maps GDP growth forecasts by country for the year ahead, based on projections from the International Monetary Fund (IMF) October 2022 Outlook and January 2023 update.
2023 GDP Growth Outlook
The world economy is projected to see just 2.9% GDP growth in 2023, down from 3.2% projected for 2022.
This is a 0.2% increase since the October 2022 Outlook thanks in part to China’s reopening, higher global demand, and slowing inflation projected across certain countries in the year ahead.
With this in mind, we show GDP growth forecasts for 191 jurisdictions given multiple economic headwinds—and a few emerging bright spots in 2023.
| Country / Region | 2023 Real GDP % Change (Projected) |
|---|---|
| 🇦🇱 Albania | 2.5% |
| 🇩🇿 Algeria | 2.6% |
| 🇦🇴 Angola | 3.4% |
| 🇦🇬 Antigua and Barbuda | 5.6% |
| 🇦🇷 Argentina* | 2.0% |
| 🇦🇲 Armenia | 3.5% |
| 🇦🇼 Aruba | 2.0% |
| 🇦🇺 Australia* | 1.6% |
| 🇦🇹 Austria | 1.0% |
| 🇦🇿 Azerbaijan | 2.5% |
| 🇧🇭 Bahrain | 3.0% |
| 🇧🇩 Bangladesh | 6.0% |
| 🇧🇧 Barbados | 5.0% |
| 🇧🇾 Belarus | 0.2% |
| 🇧🇪 Belgium | 0.4% |
| 🇧🇿 Belize | 2.0% |
| 🇧🇯 Benin | 6.2% |
| 🇧🇹 Bhutan | 4.3% |
| 🇧🇴 Bolivia | 3.2% |
| 🇧🇦 Bosnia and Herzegovina | 2.0% |
| 🇧🇼 Botswana | 4.0% |
| 🇧🇷 Brazil* | 1.2% |
| 🇧🇳 Brunei Darussalam | 3.3% |
| 🇧🇬 Bulgaria | 3.0% |
| 🇧🇫 Burkina Faso | 4.8% |
| 🇧🇮 Burundi | 4.1% |
| 🇨🇻 Cabo Verde | 4.8% |
| 🇨🇲 Cameroon | 4.6% |
| 🇰🇭 Cambodia | 6.2% |
| 🇨🇦 Canada* | 1.5% |
| 🇨🇫 Central African Republic | 3.0% |
| 🇹🇩 Chad | 3.4% |
| 🇨🇱 Chile | -1.0% |
| 🇨🇳 China* | 5.3% |
| 🇨🇴 Colombia | 2.2% |
| 🇰🇲 Comoros | 3.4% |
| 🇨🇷 Costa Rica | 2.9% |
| 🇨🇮 Côte d'Ivoire | 6.5% |
| 🇭🇷 Croatia | 3.5% |
| 🇨🇾 Cyprus | 2.5% |
| 🇨🇿 Czech Republic | 1.5% |
| 🇨🇩 Democratic Republic of the Congo | 6.7% |
| 🇩🇰 Denmark | 0.6% |
| 🇩🇯 Djibouti | 5.0% |
| 🇩🇲 Dominica | 4.9% |
| 🇩🇴 Dominican Republic | 4.5% |
| 🇪🇨 Ecuador | 2.7% |
| 🇪🇬 Egypt* | 4.0% |
| 🇸🇻 El Salvador | 1.7% |
| 🇬🇶 Equatorial Guinea | -3.1% |
| 🇪🇷 Eritrea | 2.9% |
| 🇪🇪 Estonia | 1.8% |
| 🇸🇿 Eswatini | 1.8% |
| 🇪🇹 Ethiopia | 5.3% |
| 🇫🇯 Fiji | 6.9% |
| 🇫🇮 Finland | 0.5% |
| 🇫🇷 France* | 0.7% |
| 🇲🇰 North Macedonia | 3.0% |
| 🇬🇦 Gabon | 3.7% |
| Georgia | 4.0% |
| Germany* | 0.1% |
| Ghana | 2.8% |
| Greece | 1.8% |
| Grenada | 3.6% |
| Guatemala | 3.2% |
| Guinea | 5.1% |
| Guinea-Bissau | 4.5% |
| Guyana | 25.2% |
| Haiti | 0.5% |
| Honduras | 3.5% |
| Hong Kong SAR | 3.9% |
| Hungary | 1.8% |
| Iceland | 2.9% |
| India* | 6.1% |
| Indonesia* | 4.8% |
| Iraq | 4.0% |
| Ireland | 4.0% |
| Iran* | 2.0% |
| Israel | 3.0% |
| Italy* | 0.6% |
| Jamaica | 3.0% |
| Japan* | 1.8% |
| Jordan | 2.7% |
| Kazakhstan* | 4.3% |
| Kenya | 5.1% |
| Kiribati | 2.4% |
| South Korea* | 1.7% |
| Kosovo | 3.5% |
| Kuwait | 2.6% |
| Kyrgyz Republic | 3.2% |
| Lao P.D.R. | 3.1% |
| Latvia | 1.6% |
| Lesotho | 1.6% |
| Liberia | 4.2% |
| Libya | 17.9% |
| Lithuania | 1.1% |
| Luxembourg | 1.1% |
| Macao SAR | 56.7% |
| Madagascar | 5.2% |
| 🇲🇼 Malawi | 2.5% |
| 🇲🇾 Malaysia* | 4.4% |
| 🇲🇻 Maldives | 6.1% |
| 🇲🇱 Mali | 5.3% |
| 🇲🇹 Malta | 3.3% |
| 🇲🇭 Marshall Islands | 3.2% |
| 🇲🇷 Mauritania | 4.8% |
| 🇲🇺 Mauritius | 5.4% |
| 🇲🇽 Mexico* | 1.7% |
| 🇫🇲 Micronesia | 2.9% |
| 🇲🇩 Moldova | 2.3% |
| 🇲🇳 Mongolia | 5.0% |
| 🇲🇪 Montenegro | 2.5% |
| 🇲🇦 Morocco | 3.1% |
| 🇲🇿 Mozambique | 4.9% |
| 🇲🇲 Myanmar | 3.3% |
| 🇳🇦 Namibia | 3.2% |
| 🇳🇷 Nauru | 2.0% |
| 🇳🇵 Nepal | 5.0% |
| 🇳🇱 Netherlands* | 0.6% |
| 🇳🇿 New Zealand | 1.9% |
| 🇳🇮 Nicaragua | 3.0% |
| 🇳🇪 Niger | 7.3% |
| 🇳🇬 Nigeria* | 3.2% |
| 🇳🇴 Norway | 2.6% |
| 🇴🇲 Oman | 4.1% |
| 🇵🇰 Pakistan* | 2.0% |
| 🇵🇼 Palau | 12.3% |
| 🇵🇦 Panama | 4.0% |
| 🇵🇬 Papua New Guinea | 5.1% |
| 🇵🇾 Paraguay | 4.3% |
| 🇵🇪 Peru | 2.6% |
| 🇵🇭 Philippines* | 5.0% |
| 🇵🇱 Poland* | 0.3% |
| 🇵🇹 Portugal | 0.7% |
| 🇵🇷 Puerto Rico | 0.4% |
| 🇶🇦 Qatar | 2.4% |
| 🇨🇬 Republic of Congo | 4.6% |
| 🇷🇴 Romania | 3.1% |
| 🇷🇺 Russia* | 0.3% |
| 🇷🇼 Rwanda | 6.7% |
| 🇼🇸 Samoa | 4.0% |
| 🇸🇲 San Marino | 0.8% |
| 🇸🇹 São Tomé and Príncipe | 2.6% |
| 🇸🇦 Saudi Arabia* | 2.6% |
| 🇸🇳 Senegal | 8.1% |
| 🇷🇸 Serbia | 2.7% |
| 🇸🇨 Seychelles | 5.2% |
| 🇸🇱 Sierra Leone | 3.3% |
| 🇸🇬 Singapore | 2.3% |
| 🇸🇰 Slovak Republic | 1.5% |
| 🇸🇮 Slovenia | 1.7% |
| 🇸🇧 Solomon Islands | 2.6% |
| 🇸🇴 Somalia | 3.1% |
| 🇿🇦 South Africa* | 1.2% |
| 🇸🇸 South Sudan | 5.6% |
| 🇪🇸 Spain* | 1.1% |
| 🇱🇰 Sri Lanka | -3.0% |
| 🇰🇳 St. Kitts and Nevis | 4.8% |
| 🇱🇨 St. Lucia | 5.8% |
| 🇻🇨 St. Vincent and the Grenadines | 6.0% |
| 🇸🇩 Sudan | 2.6% |
| 🇸🇷 Suriname | 2.3% |
| 🇸🇪 Sweden | -0.1% |
| 🇨🇭 Switzerland | 0.8% |
| 🇹🇼 Taiwan | 2.8% |
| 🇹🇯 Tajikistan | 4.0% |
| 🇹🇿 Tanzania | 5.2% |
| 🇹🇭 Thailand* | 3.7% |
| 🇧🇸 The Bahamas | 4.1% |
| 🇬🇲 The Gambia | 6.0% |
| 🇹🇱 Timor-Leste | 4.2% |
| 🇹🇬 Togo | 6.2% |
| 🇹🇴 Tonga | 2.9% |
| 🇹🇹 Trinidad and Tobago | 3.5% |
| 🇹🇳 Tunisia | 1.6% |
| 🇹🇷 Turkey* | 3.0% |
| 🇹🇲 Turkmenistan | 2.3% |
| 🇹🇻 Tuvalu | 3.5% |
| 🇺🇬 Uganda | 5.9% |
| 🇺🇦 Ukraine | N/A |
| 🇦🇪 United Arab Emirates | 4.2% |
| 🇬🇧 United Kingdom* | -0.6% |
| 🇺🇲 U.S.* | 1.4% |
| 🇺🇾 Uruguay | 3.6% |
| 🇺🇿 Uzbekistan | 4.7% |
| 🇻🇺 Vanuatu | 3.1% |
| 🇻🇪 Venezuela | 6.5% |
| 🇻🇳 Vietnam | 6.2% |
| West Bank and Gaza | 3.5% |
| 🇾🇪 Yemen | 3.3% |
| 🇿🇲 Zambia | 4.0% |
| 🇿🇼 Zimbabwe | 2.8% |
*Reflect updated figures from the January 2023 IMF Update.
The U.S. is forecast to see 1.4% GDP growth in 2023, up from 1.0% seen in the last October projection.
Still, signs of economic weakness can be seen in the growing wave of tech layoffs, foreshadowed as a white-collar or ‘Patagonia-vest’ recession. Last year, 88,000 tech jobs were cut and this trend has continued into 2023. Major financial firms have also followed suit. Still, unemployment remains fairly steadfast, at 3.5% as of December 2022. Going forward, concerns remain around inflation and the path of interest rate hikes, though both show signs of slowing.
Across Europe, the average projected GDP growth rate is 0.7% for 2023, a sharp decline from the 2.1% forecast for last year.
Both Germany and Italy are forecast to see slight growth, at 0.1% and 0.6%, respectively. Growth forecasts were revised upwards since the IMF’s October release. However, an ongoing energy crisis exposes the manufacturing sector to vulnerabilities, with potential spillover effects to consumers and businesses, and overall Euro Area growth.
China remains an open question. In 2023, growth is predicted to rise 5.2%, higher than many large economies. While its real estate sector has shown signs of weakness, the recent opening on January 8th, following 1,016 days of zero-Covid policy, could boost demand and economic activity.
A Long Way to Go
The IMF has stated that 2023 will feel like a recession for much of the global economy. But whether it is headed for a recovery or a sharper decline remains unknown.
Today, two factors propping up the global economy are lower-than-expected energy prices and resilient private sector balance sheets. European natural gas prices have sunk to levels seen before the war in Ukraine. During the height of energy shocks, firms showed a notable ability to withstand astronomical energy prices squeezing their finances. They are also sitting on significant cash reserves.
On the other hand, inflation is far from over. To counter this effect, many central banks will have to use measures to rein in prices. This may in turn have a dampening effect on economic growth and financial markets, with unknown consequences.
As economic data continues to be released over the year, there may be a divergence between consumer sentiment and whether things are actually changing in the economy. Where the economy is heading in 2023 will be anyone’s guess.


Economy
Economic Growth Forecasts for G7 and BRICS Countries in 2024
The IMF has released its economic growth forecasts for 2024. How do the G7 and BRICS countries compare?


G7 & BRICS Real GDP Growth Forecasts for 2024
The International Monetary Fund’s (IMF) has released its real gross domestic product (GDP) growth forecasts for 2024, and while global growth is projected to stay steady at 3.2%, various major nations are seeing declining forecasts.
This chart visualizes the 2024 real GDP growth forecasts using data from the IMF’s 2024 World Economic Outlook for G7 and BRICS member nations along with Saudi Arabia, which is still considering an invitation to join the bloc.
Get the Key Insights of the IMF’s World Economic Outlook
Want a visual breakdown of the insights from the IMF’s 2024 World Economic Outlook report?
This visual is part of a special dispatch of the key takeaways exclusively for VC+ members.
Get the full dispatch of charts by signing up to VC+.
Mixed Economic Growth Prospects for Major Nations in 2024
Economic growth projections by the IMF for major nations are mixed, with the majority of G7 and BRICS countries forecasted to have slower growth in 2024 compared to 2023.
Only three BRICS-invited or member countries, Saudi Arabia, the UAE, and South Africa, have higher projected real GDP growth rates in 2024 than last year.
| Group | Country | Real GDP Growth (2023) | Real GDP Growth (2024P) |
|---|---|---|---|
| G7 | 🇺🇸 U.S. | 2.5% | 2.7% |
| G7 | 🇨🇦 Canada | 1.1% | 1.2% |
| G7 | 🇯🇵 Japan | 1.9% | 0.9% |
| G7 | 🇫🇷 France | 0.9% | 0.7% |
| G7 | 🇮🇹 Italy | 0.9% | 0.7% |
| G7 | 🇬🇧 UK | 0.1% | 0.5% |
| G7 | 🇩🇪 Germany | -0.3% | 0.2% |
| BRICS | 🇮🇳 India | 7.8% | 6.8% |
| BRICS | 🇨🇳 China | 5.2% | 4.6% |
| BRICS | 🇦🇪 UAE | 3.4% | 3.5% |
| BRICS | 🇮🇷 Iran | 4.7% | 3.3% |
| BRICS | 🇷🇺 Russia | 3.6% | 3.2% |
| BRICS | 🇪🇬 Egypt | 3.8% | 3.0% |
| BRICS-invited | 🇸🇦 Saudi Arabia | -0.8% | 2.6% |
| BRICS | 🇧🇷 Brazil | 2.9% | 2.2% |
| BRICS | 🇿🇦 South Africa | 0.6% | 0.9% |
| BRICS | 🇪🇹 Ethiopia | 7.2% | 6.2% |
| 🌍 World | 3.2% | 3.2% |
China and India are forecasted to maintain relatively high growth rates in 2024 at 4.6% and 6.8% respectively, but compared to the previous year, China is growing 0.6 percentage points slower while India is an entire percentage point slower.
On the other hand, four G7 nations are set to grow faster than last year, which includes Germany making its comeback from its negative real GDP growth of -0.3% in 2023.
Faster Growth for BRICS than G7 Nations
Despite mostly lower growth forecasts in 2024 compared to 2023, BRICS nations still have a significantly higher average growth forecast at 3.6% compared to the G7 average of 1%.
While the G7 countries’ combined GDP is around $15 trillion greater than the BRICS nations, with continued higher growth rates and the potential to add more members, BRICS looks likely to overtake the G7 in economic size within two decades.
BRICS Expansion Stutters Before October 2024 Summit
BRICS’ recent expansion has stuttered slightly, as Argentina’s newly-elected president Javier Milei declined its invitation and Saudi Arabia clarified that the country is still considering its invitation and has not joined BRICS yet.
Even with these initial growing pains, South Africa’s Foreign Minister Naledi Pandor told reporters in February that 34 different countries have submitted applications to join the growing BRICS bloc.
Any changes to the group are likely to be announced leading up to or at the 2024 BRICS summit which takes place October 22-24 in Kazan, Russia.
Get the Full Analysis of the IMF’s Outlook on VC+
This visual is part of an exclusive special dispatch for VC+ members which breaks down the key takeaways from the IMF’s 2024 World Economic Outlook.
For the full set of charts and analysis, sign up for VC+.

-

 Markets1 week ago
U.S. Debt Interest Payments Reach $1 Trillion
-

 Business2 weeks ago
Charted: Big Four Market Share by S&P 500 Audits
-

 Real Estate2 weeks ago
Ranked: The Most Valuable Housing Markets in America
-

 Money2 weeks ago
Which States Have the Highest Minimum Wage in America?
-

 AI2 weeks ago
Ranked: Semiconductor Companies by Industry Revenue Share
-

 Markets2 weeks ago
Ranked: The World’s Top Flight Routes, by Revenue
-

 Demographics2 weeks ago
Population Projections: The World’s 6 Largest Countries in 2075
-

 Markets2 weeks ago
The Top 10 States by Real GDP Growth in 2023