Energy
Mapped: Gas Prices in America at All-Time Highs
Gas Prices in America at All-Time High
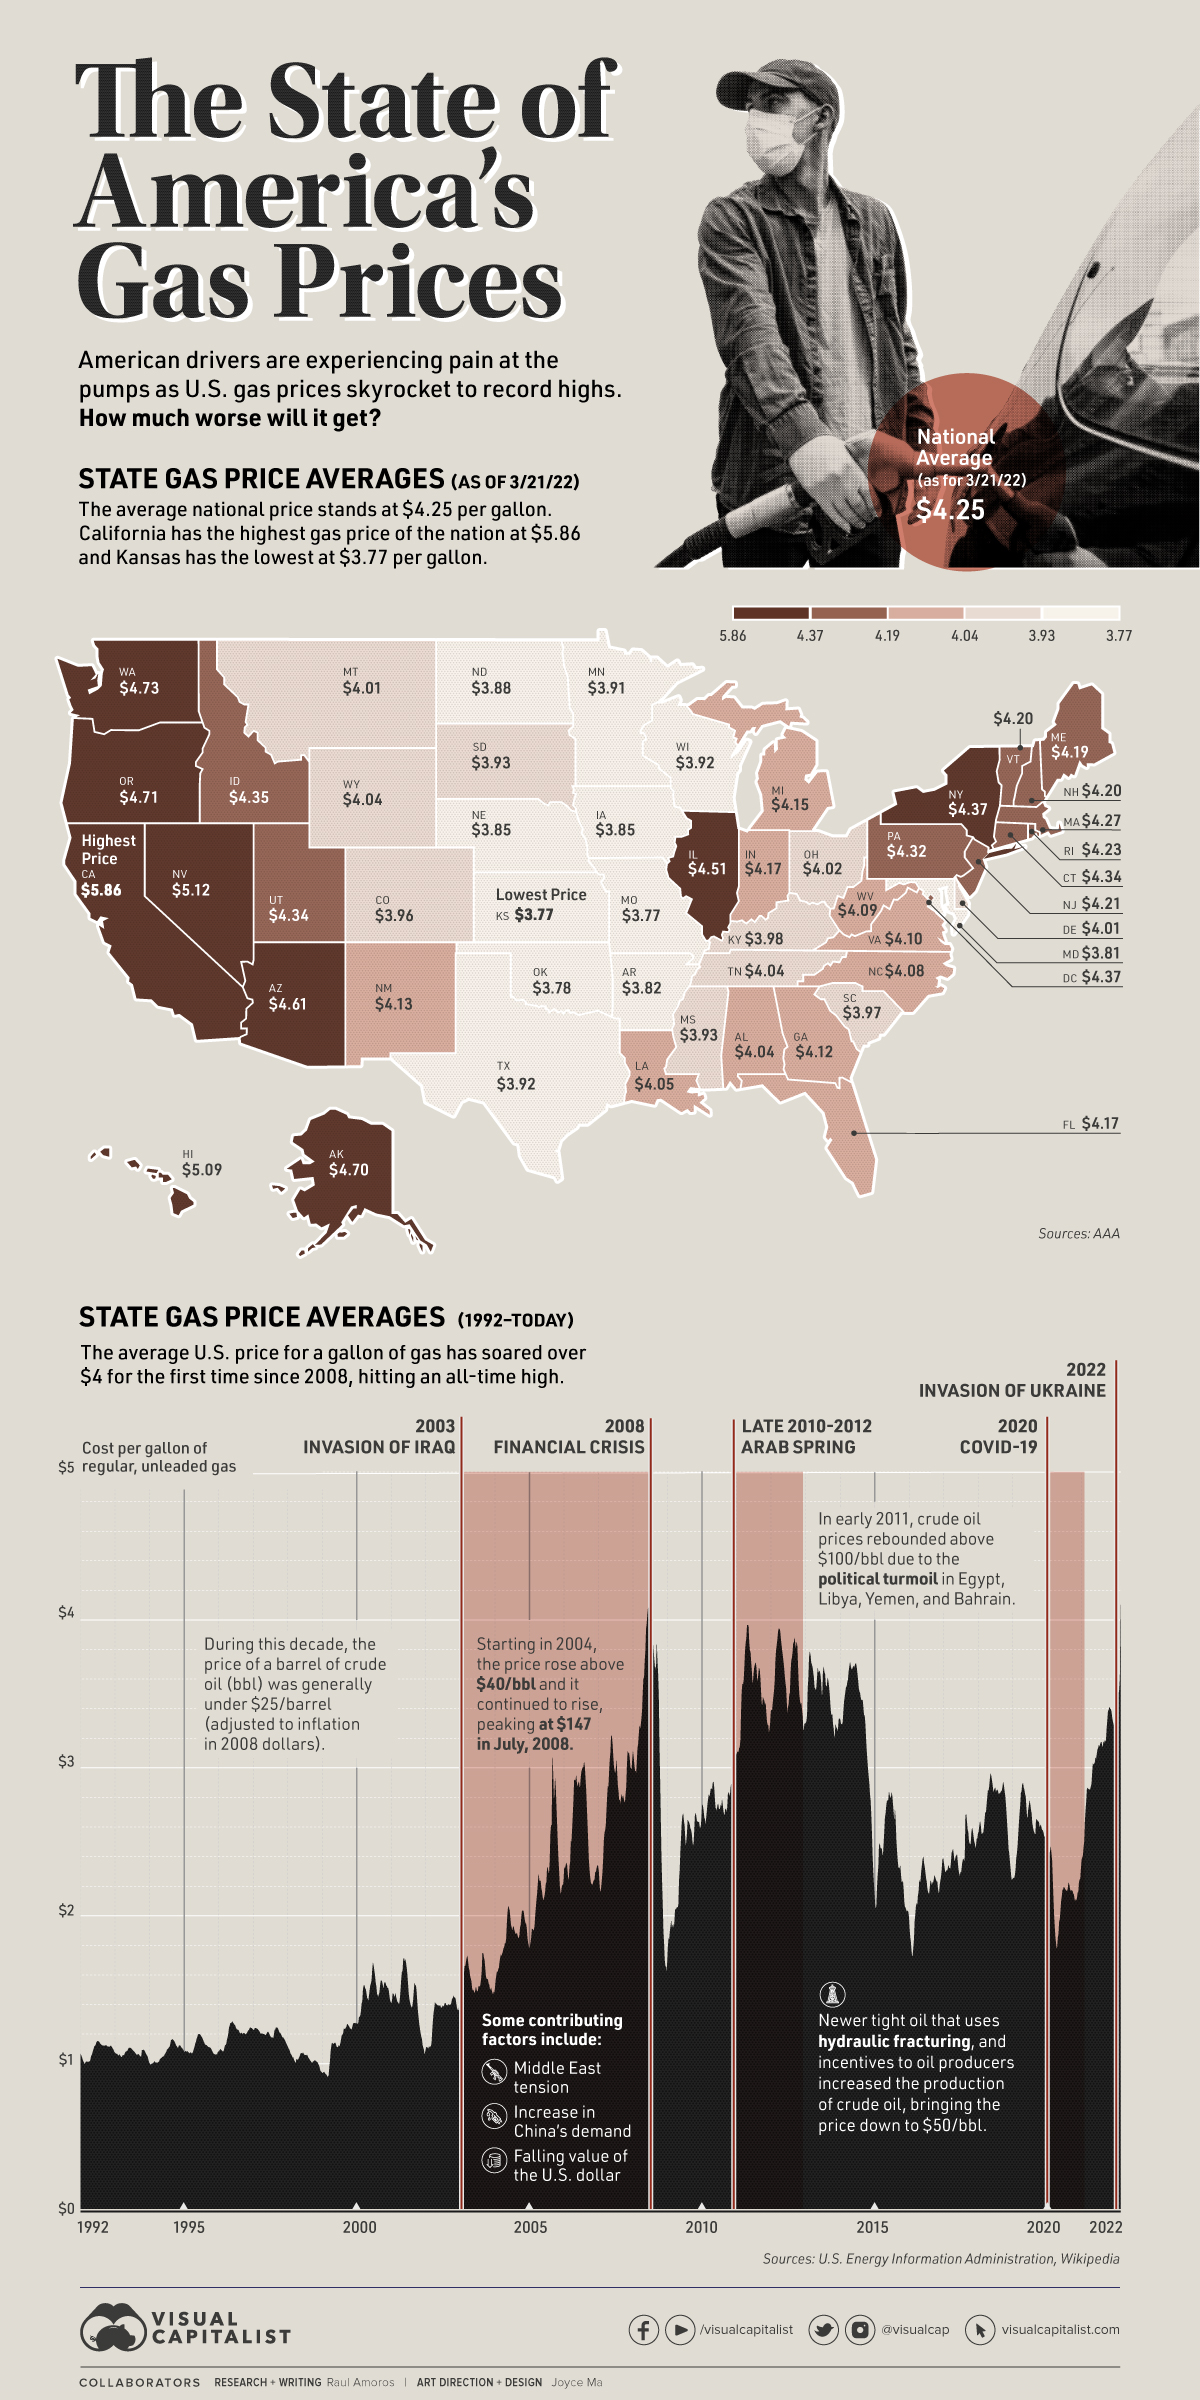
In recent days, gas prices have skyrocketed to all-time highs.
According to the American Automobile Association (AAA), the national average price of regular unleaded gas has reached $4.25 per gallon as of March 21st, 2022. This is the first time since 2008 that gas prices had exceeded the $4 per gallon mark.
The price of gas was already rising two weeks before the Russian invasion of Ukraine, owing to the increased demand due to the lifting of COVID restrictions. But when the war broke out, the price of regular gas jumped 41¢ during the first week. This surge in prices could add up to $2,000 in annual cost to the average American household.
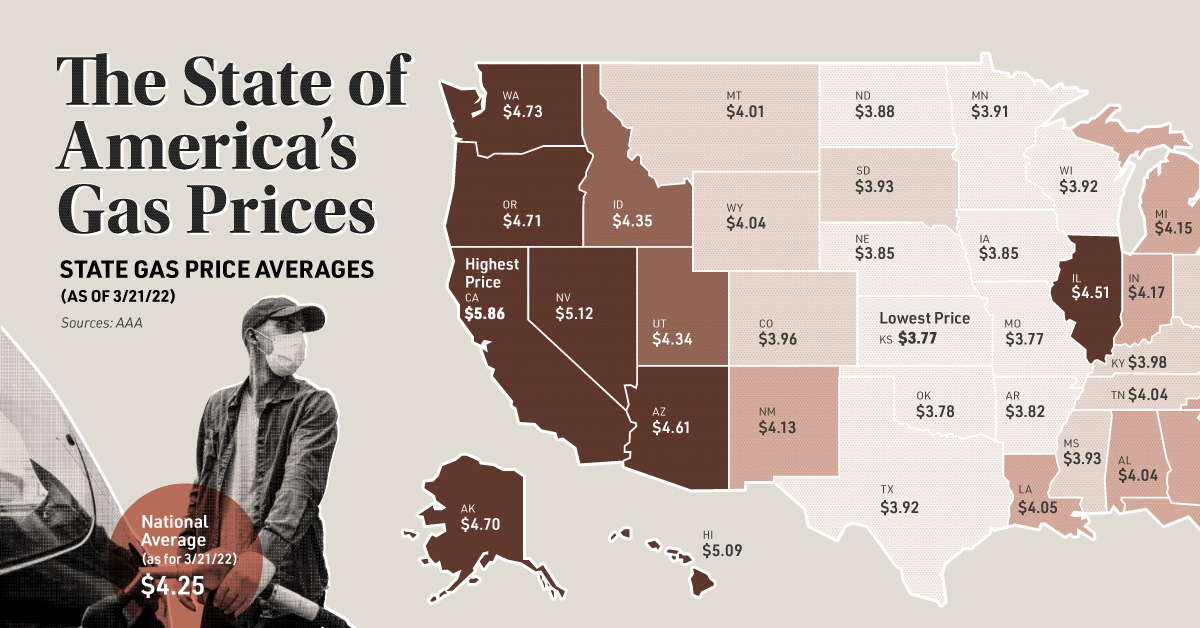
While the price at the pump sits at $4.25 per gallon on average, it’s worth mentioning that prices range quite substantially depending on the state. California has the highest average price at $5.86 per gallon. On the other extreme, Kansas has an average price of $3.77 per gallon.
Where is Gas the Most Expensive in America?
There are eight states where gas prices are above $4.50 per gallon, and three states where the price is above $5: California, Hawaii, and Nevada.
Here are the 10 states or districts with the highest gas prices:
| Rank | State | Cost per Gallon (as of 03/21/2022) |
|---|---|---|
| #1 | California | $5.855 |
| #2 | Nevada | $5.118 |
| #3 | Hawaii | $5.087 |
| #4 | Washington | $4.726 |
| #5 | Oregon | $4.708 |
| #6 | Alaska | $4.699 |
| #7 | Arizona | $4.613 |
| #8 | Illinois | $4.506 |
| #9 | New York | $4.368 |
| #10 | District of Columbia | $4.367 |
Where is Gas the Least Expensive in America?
There are 16 states where gas prices are under $4 per gallon. Here are the 10 states with the lowest gas prices:
| Rank | State | Cost per Gallon (as of 03/21/2022) |
|---|---|---|
| #1 | Kansas | $3.767 |
| #2 | Missouri | $3.773 |
| #3 | Oklahoma | $3.775 |
| #9 | Maryland | $3.811 |
| #5 | Arkansas | $3.822 |
| #6 | Nebraska | $3.848 |
| #7 | Iowa | $3.854 |
| #8 | North Dakota | $3.882 |
| #9 | Minnesota | $3.914 |
| #10 | Texas | $3.918 |
There are a few reasons why gas prices can vary from state to state. State taxes play a big role in the final price at the pump, and they can range from 57.6¢ per gallon in Pennsylvania to 8¢ per gallon in Alaska.
Proximity to refineries is another contributing factor for cheaper gas. States like Texas, Louisiana, Mississippi, and Alabama often have lower prices than other regions.
When Will Gas Prices Go Down?
Gas prices were on the rise due to an oil supply shortage. When war broke out, there was an additional price surge due to sanctions or bans on Russian oil exports by the West.
It’s also worth noting that even as the price of oil begins to fall once again, there is typically a lag before prices at the pump begin to ease for consumers.
The Energy Information Administration projects that average spot price of Brent crude oil will be $105.22 per barrel this year, a $22 difference compared to its original February forecast. As a result, many experts are expecting that gas prices could stay near or above $4 per gallon for the rest of the year.


Energy
The World’s Biggest Nuclear Energy Producers
China has grown its nuclear capacity over the last decade, now ranking second on the list of top nuclear energy producers.


The World’s Biggest Nuclear Energy Producers
This was originally posted on our Voronoi app. Download the app for free on Apple or Android and discover incredible data-driven charts from a variety of trusted sources.
Scientists in South Korea recently broke a record in a nuclear fusion experiment. For 48 seconds, they sustained a temperature seven times that of the sun’s core.
But generating commercially viable energy from nuclear fusion still remains more science fiction than reality. Meanwhile, its more reliable sibling, nuclear fission, has been powering our world for many decades.
In this graphic, we visualized the top producers of nuclear energy by their share of the global total, measured in terawatt hours (TWh). Data for this was sourced from the Nuclear Energy Institute, last updated in August 2022.
Which Country Generates the Most Nuclear Energy?
Nuclear energy production in the U.S. is more than twice the amount produced by China (ranked second) and France (ranked third) put together. In total, the U.S. accounts for nearly 30% of global nuclear energy output.
However, nuclear power only accounts for one-fifth of America’s electricity supply. This is in contrast to France, which generates 60% of its electricity from nuclear plants.
| Rank | Country | Nuclear Energy Produced (TWh) | % of Total |
|---|---|---|---|
| 1 | 🇺🇸 U.S. | 772 | 29% |
| 2 | 🇨🇳 China | 383 | 14% |
| 3 | 🇫🇷 France | 363 | 14% |
| 4 | 🇷🇺 Russia | 208 | 8% |
| 5 | 🇰🇷 South Korea | 150 | 6% |
| 6 | 🇨🇦 Canada | 87 | 3% |
| 7 | 🇺🇦 Ukraine | 81 | 3% |
| 8 | 🇩🇪 Germany | 65 | 2% |
| 9 | 🇯🇵 Japan | 61 | 2% |
| 10 | 🇪🇸 Spain | 54 | 2% |
| 11 | 🇸🇪 Sweden | 51 | 2% |
| 12 | 🇧🇪 Belgium | 48 | 2% |
| 13 | 🇬🇧 UK | 42 | 2% |
| 14 | 🇮🇳 India | 40 | 2% |
| 15 | 🇨🇿 Czech Republic | 29 | 1% |
| N/A | 🌐 Other | 219 | 8% |
| N/A | 🌍 Total | 2,653 | 100% |
Another highlight is how China has rapidly grown its nuclear energy capabilities in the last decade. Between 2016 and 2021, for example, it increased its share of global nuclear energy output from less than 10% to more than 14%, overtaking France for second place.
On the opposite end, the UK’s share has slipped to 2% over the same time period.
Meanwhile, Ukraine has heavily relied on nuclear energy to power its grid. In March 2022, it lost access to its key Zaporizhzhia Nuclear Power Station after Russian forces wrested control of the facility. With six 1,000 MW reactors, the plant is one of the largest in Europe. It is currently not producing any power, and has been the site of recent drone attacks.

-

 Mining2 weeks ago
Charted: The Value Gap Between the Gold Price and Gold Miners
-

 Real Estate1 week ago
Ranked: The Most Valuable Housing Markets in America
-

 Business1 week ago
Charted: Big Four Market Share by S&P 500 Audits
-

 AI1 week ago
The Stock Performance of U.S. Chipmakers So Far in 2024
-

 Misc1 week ago
Almost Every EV Stock is Down After Q1 2024
-

 Money2 weeks ago
Where Does One U.S. Tax Dollar Go?
-

 Green2 weeks ago
Ranked: Top Countries by Total Forest Loss Since 2001
-

 Real Estate2 weeks ago
Visualizing America’s Shortage of Affordable Homes